In today’s lecture, I will tell you what is a realistic price prediction for Holochain crypto coin or HOT as some investors know it. I will share with you what is my current investment with Holo, why I have bought just 6,500 coins, and I will share with you what you need to be careful of.
Holochain Price Prediction
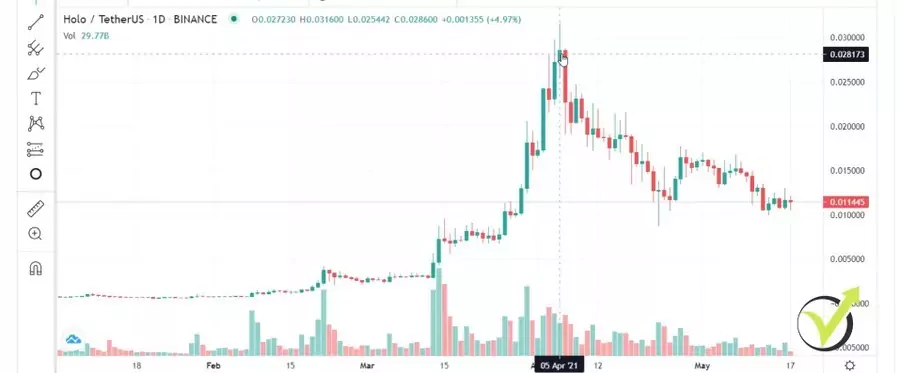
Holo or HOT which did an amazing move in the last year. The price did a great move starting from mid-February 2021 from about $0.001 reaching to the top which was on the 5th of April and the price reached $0.0316.
But then it lost a lot of its value which gave me a good opportunity to buy it and I’m looking for a second opportunity to buy the HOT.
Holochain community
So right now, I am on CoinGecko.com, a great website for analysis. What I like the most is that they have integrated Trading View which is one of the best platforms to use for price action trading. And I will show you my current setup, I will show you exactly how I draw the lines, and I do the whole Holochain price prediction. If you are new to CoinGecko, and I’m not promoting the website or anything, just using it.
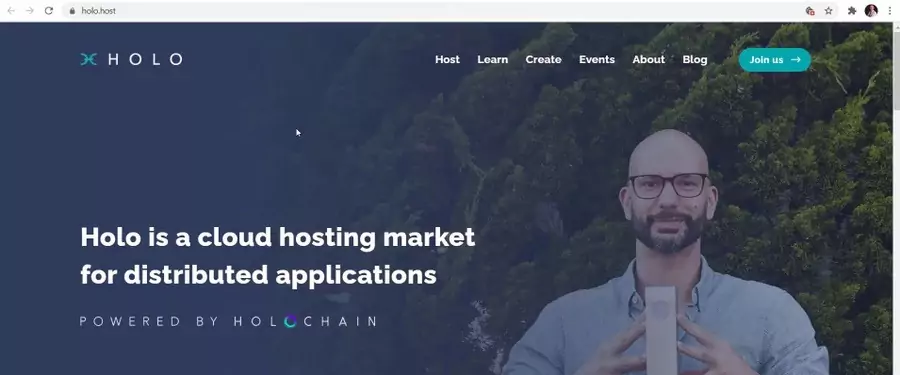
What you need to pay attention to when you are choosing a cryptocurrency to invest in is a couple of things. The first is the website. Do they have a professional website? So if I open, for example, Holo.host, you will see quite a professionally designed website with the community, with the development projects, they have a Forum as well.
And they have a lot of educational stuff which makes it trusty. However, I just look at the website, I don’t dive into it. What I care the most is the community. So they have Reddit, Twitter, Facebook, Telegram, and Bitcointalk. But I look usually at Reddit and Twitter. So if you look at Holochain’s Reddit you will see that they have above 21,000 agents, and as well on Twitter, they have above 74,000 followers which is a pretty decent community.
The support and resistance levels
Now, going back to the chart, I want to focus on what is the Holochain price prediction and I will share with you how I reached there. We are looking at the last few months after the price did that amazing move and when I’m looking to buy the asset or to identify potential targets and a crypto price prediction, I always start from the basics going to the more advanced stuff.
So the first thing is always the support and resistance levels.
For the beginners, the support and resistance levels are the levels where the price stopped a few times.
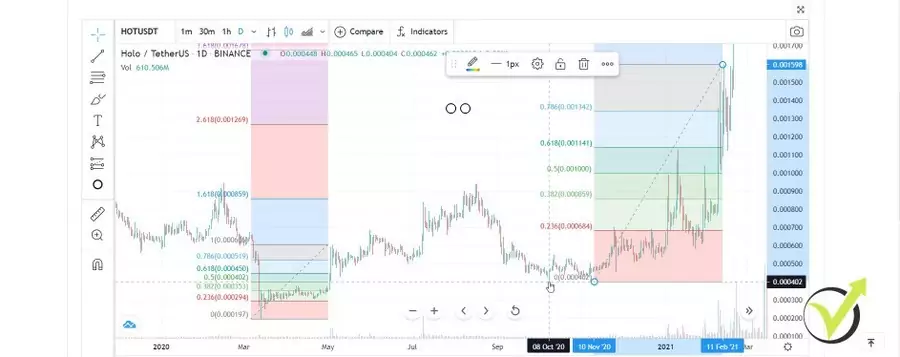
For example, right over here at $0.0010, I’ll just make it as a precise value at $0.01 or we can say this is 1 cent. The price actually stopped just before the 1 cent, then it retested it and continued higher.
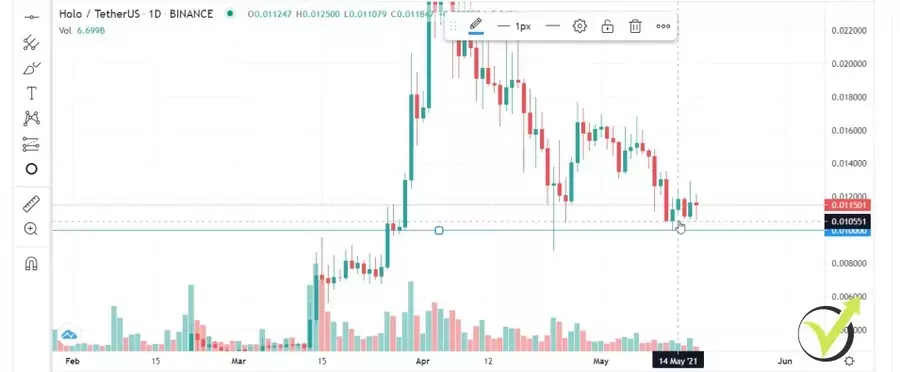
After that, the price stopped right there again, even broke a little bit lower but there was no day closing below the 1 cent and now recently the price stopped exactly at that level. And if you see the lowest point of this candlestick on the image above, you can see the exact value right over here is $0.010001. So it stopped exactly at 1 cent which means that this level is a strong support level.
In other words, the buyers don’t allow the price to drop below 1 cent. And when there is a strong support level, I always look for buying opportunities. And one last thing to mention about the support, the more times the price stopped at that level, so right here it was resistance then it was a support, second time support, third-time support makes it an important level.
The uptrend
As well, if we are back on these times right in March 2021 when the price climbs from $0.003 to $0.0089, obviously, the next roundish number is $0.01 which is the 1 cent. So this is the first important thing to point out. Here we have strong support at the 1 cent or 0.01 of the dollar. Where was my first investment?
I used exactly that bounce right there, so this is called to be a Doji candlestick which is a reversal pattern.
When the opening and closing prices of a security are almost equal within a given period of time, a Doji candlestick is formed and usually signals a reversal pattern to technical analysts.
Even the price after that continued a little bit lower, then continued higher, so I saw that this level is actually important, the 1 cent, and then I was looking for buying opportunities. As you probably have seen in some of my price prediction videos, you will know that I use the counter-trend lines which are awesome tools to show me where to buy the asset. So I draw them against the trend.
Obviously, until that moment we’re in an uptrend. We have a series of higher highs, higher lows, which identifies the uptrend. If I put some moving averages they will be showing upwards. But then I don’t want to buy just somewhere randomly. I want to use a retracement. I want to buy when the price loses some of its value and this is where I want to enter.
Drawing the countertrend lines
And I usually use the countertrend lines so I draw them against the major trend and when the price breaks, this is when I usually enter. And if you look at my cryptocurrency portfolio spreadsheet, I have entered the Holo right at $0.016.
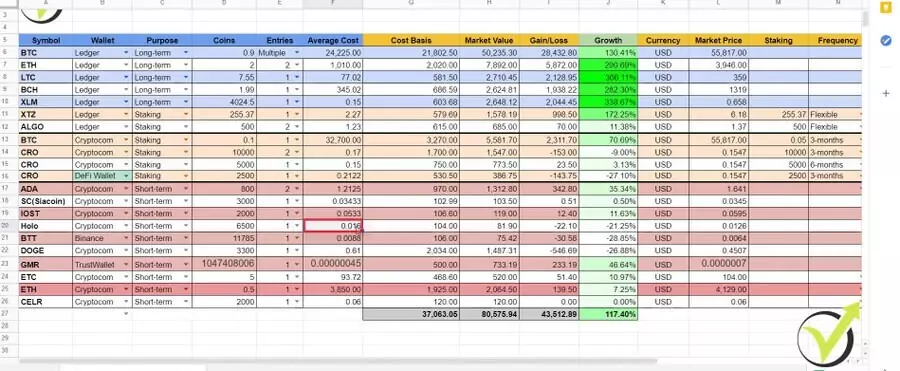
And I have bought just 6,500 coins which was an investment of $100 just because the price lost a lot of its value.
I will show you the retracements a little bit later. And when there is a huge drop I can expect a further down movement and I would buy more at a cheaper price to improve my average price.
However, the price went just sideways since then and now I’m looking for one more opportunity to buy it. But one more time, this is a small investment of $100 which I am implementing recently in my portfolio strategy.
So I’m purchasing cheap coins with just about $100 and then I’m chasing bigger percentages as growth. And actually, if you want to find my portfolio spreadsheet, you can check out my Patreon’s page where I share all of my investments. I simply send crypto buy and sell alerts to my followers. So right here I had a great sale alert with Ethereum and I took amazing profits right on the top.
I make weekly updates
Currently, it’s on a much lower value and Ethereum just lost a lot of its value. And as well on my Patreon’s page, you will be able to download the spreadsheet which I update regularly with all of my current investments. This is what I have currently in my wallets and on the exchanges. I have the growth right here so this is like the total investment I have at the moment.
What’s the market value and what’s the growth? And once a week I update the values in the market price and all the rest updates automatically with a formula behind.
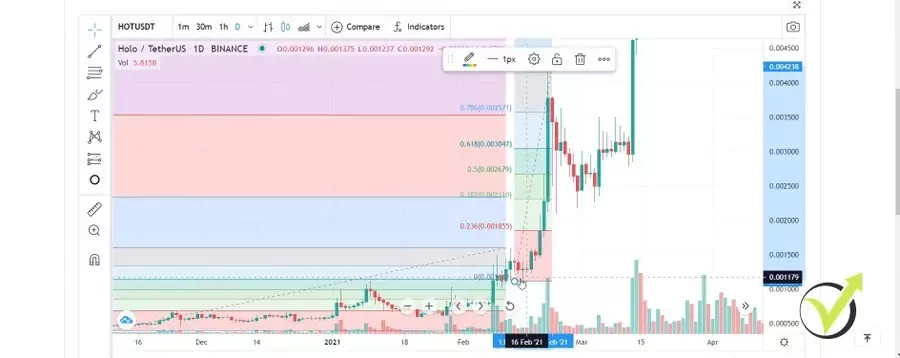
So this was my entry, one more time, at $0.016 and I will go to the 1-hour chart to show you exactly where I have bought it. So if you want to draw precisely, you better go down to the 1-hour chart.
For the beginners, each candlestick represents 1 hour.
So here was the bounce from the $0.01 level then there was a break of the counter trend line.
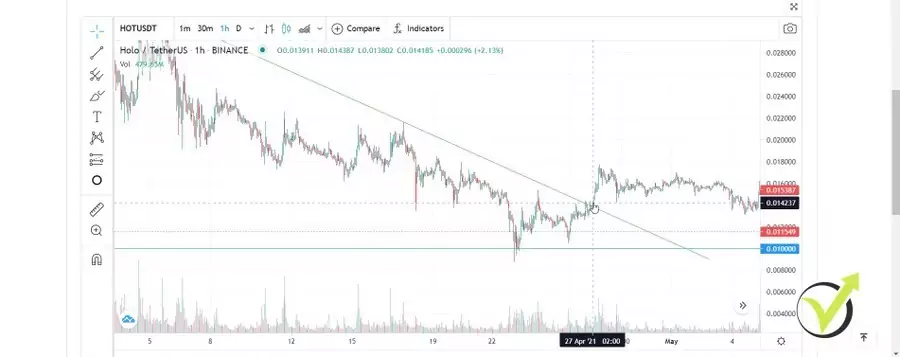
However, I wanted to see this high broken first which sits at $0.015 to make my Holochain price prediction so I opened the trade at $0.016 right over here. One more time, I wanted to see the price breaking this small top over here.
The value dropped after a few negative Elon Musk tweets
So we are back in an uptrend on the hourly chart and I had my entry somewhere right here at $0.06, something like that. Now, after that, the price just went sideways, lost a little bit of its value together with the Bitcoin recently after some Elon Musk tweets that nobody liked but that’s another story, I’m not going to talk about it.
However, the market is being quite negative recently, which gave me another opportunity to draw another counter trend line. So right now I’m looking to buy the break of this counter trend line which happened right here but immediately the price pulled back lower and it didn’t continue higher. So now if the price breaks the counter trend line, I’d be happy to buy somewhere at $0.013, right over here I want to see the break.
I want to see a higher high than that one. So if the price forms something like that, that would be great for me to buy. Because I will have a break of the counter trend line, I will have the support level of $0.01, and then I will have a higher high which forms a new uptrend on the hourly chart and I will improve my average price.
Don’t put all of your money into a single crypto coin
So, for example, if I buy for another $100 at $0.013, my average price will go somewhere to $0.01450 or something like that. So very important here is when I want to invest in an asset, I don’t put all of my money into it. I have a portfolio as you saw on my spreadsheet and as well if you look, for example, at Bitcoin, I have bought it multiple times.
Some of the others I have bought 2 times, some I have bought 3, 4, or more times. But the idea is that I’m looking for different entries just when the price shows strength and a new uptrend coming on the hourly chart. And if the price drops, I’m just averaging the price and improving my price so when the price goes up on profit again, I will have much more if I entered with all of the money that I planned for this asset from the first time.
Hope that’s not too complicated, guys, but this is my first entry and I’m looking for a second one after some time. If the price drops lower that’s fine. I’ll be looking for lower entries, lower counter trend lines, so I’ll have even a better average price. How do I determine my targets and what is the realistic Holochain price prediction? This is what I’m talking about right now.
The Fibonacci retracements
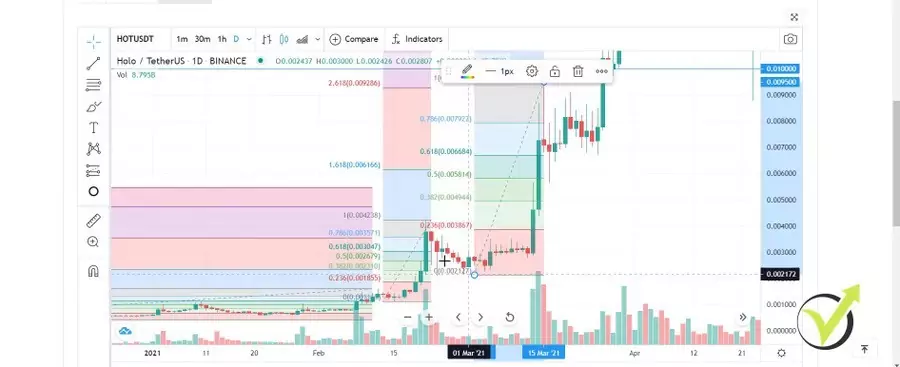
I start from the beginning of the uptrend so I’ll switch back to the daily chart and you will see that the new uptrend started from right over there. So right over there, you see that the price goes down. We have a series of lower lows and lower highs which forms the downtrend. And the first move from the new uptrend is this one over here. I will take a Fibonacci retracement and put it on the chart.
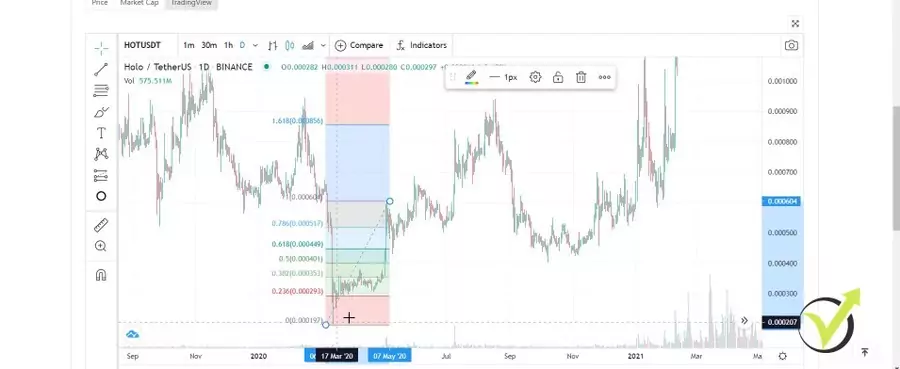
So this is the first move from the new uptrend and I take a Fibonacci retracement starting from the top going to the bottom. So I’m drawing it from the top to the bottom. Then what we have with the Fibonacci, I have explained it in a couple of my price prediction lectures, but I will explain it as well in here, we have retracement levels. So all of these levels starting from 0 – 100, we have 78.6%, we have 61.8%, we have the 50%, 38.2%, and 23.6%.
So these are potential levels where we can expect the price to drop and you can see at this level it dropped just below 61.8. But what is the thing that I’m using right here are the targets. So on the top, you will see that I have targets and I have 4 targets. And I usually use the second one, 2.618.
What to do when analyzing a new asset or chart
So when the price reaches that level, I usually take profits and when I’m analyzing the chart or if you’re just starting analyzing a new asset, a new chart, what you should be doing is when the price reaches the second target, it does right over here. I take the next high and I draw a new Fibonacci to the lowest retracement which in this case is this level over here.
And then what I have is a new Fibonacci and you can see that the price did another retracement to the 61.8, then it continued higher, and then let’s see where it reached, the second target right over here. So what do I do next? I take another level, I draw it from the top, and I stop at the lowest retracement after the last Fibonacci which is right over here.
And then the same thing repeats but right here we had a better retracement which went below the 38.2. So you see the price dropped and then it continued higher reaching the second target again, I will show you exactly so you see how well it works. This is the second target, the price just reached it perfectly and I will draw another Fibonacci starting from this top going to the bottom, right over here to make a precise Holochain price prediction.
A small change in the Fibonacci will cause a change in the target
And when I say the bottom, this is the lowest retracement. And then we have a new Fibonacci target which was reached, not with this top but with this candle over here and this is actually the top. So now I will take from the highest point that we have going to the lowest retracement after the last Fibonacci which is this one over here.
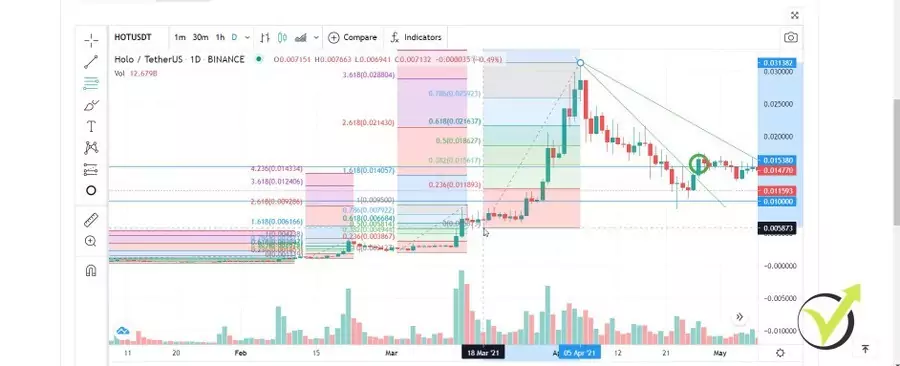
Stay with me, guys, it might sound complicated but it’s not. I will explain it very simply. So this is the lowest point and here we go. So now what we have is we have the new Fibonacci retracement levels and in this case, the price dropped down below 23.6% which is a huge retracement, you can see it’s marked in red already with the Fibonacci levels.
But what we have on the top are the new targets.
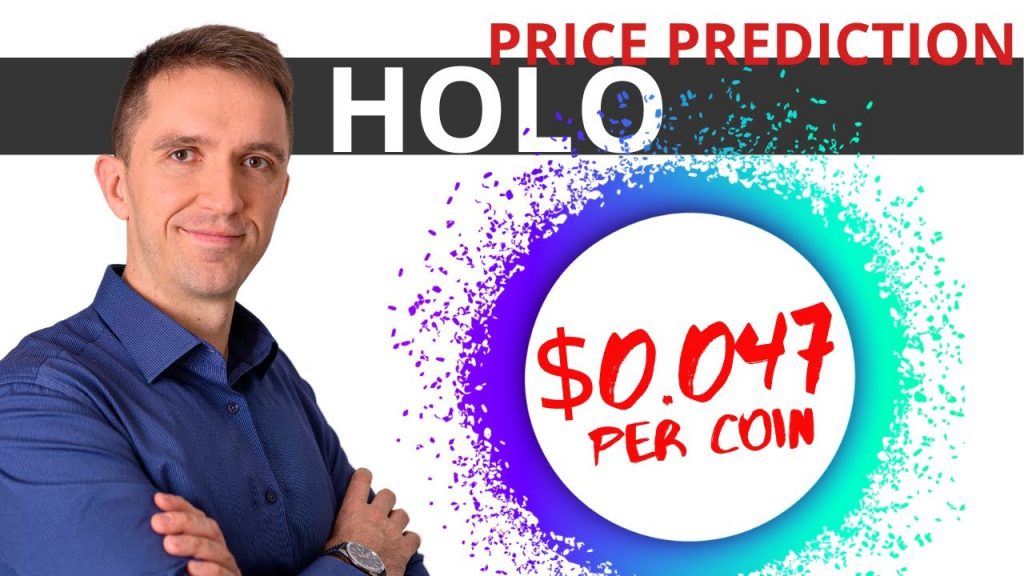
The first target sits at $0.0472 and the second one sits at $0.0730. And this is the realistic Holo HOT price prediction I have if the Holochain price continues higher and reaches new record highs for the year.
Now, let me draw this Fibonacci, the last one, very precise so we’ll know exactly what is the level because a small change in the Fibonacci will result obviously in a change into the target as well.
My realistic Holochain price prediction
So right over here I will just draw it to the lowest point, it’s right over here. That’s it. Let’s check out, one more time, where is the second target of the Fibonacci, is at $0.0735. So let’s say $0.07 would be my next realistic price prediction for Holochain HOT crypto. And after that, if the price reaches this level, I will have a new Fibonacci starting from the new top which could be here, could be here, could be even higher, I don’t know where it will be.
But then I will draw another Fibonacci going to the lowest retracement. We can have a new retracement but then I will have new targets which will be higher and probably I’ll be updating the lecture at that moment so you will see exactly where it is but I hope it’s really clear how I draw the Fibonaccis starting from the lowest point when the price reaches the second target, I draw a new Fibonacci from the top to the lowest retracement after the last Fibonacci.
And this system, I have explained very clearly and in detail in my Cryptocurrency Investment Strategy course which will help you to learn exactly how I do all of these analyses. And in the course, I have recorded many live examples of taking trades.
Conclusion
So usually, I use the Trading View platform to do the analysis but I buy the assets from the exchanges such as Binance, Crypto.com, Coinbase. I have put links in the reviews of these exchanges if you want to take some bonuses when registering. So this is my realistic price prediction for the Holochain HOT crypto. One more time, I’ll be buying again if the price breaks the aggressive counter trend line.
I’ll let you know on Patreon if you are following me in there. And if the price drops lower, it might be if Elon Musk keeps tweeting negatively about Bitcoin and the whole crypto world. But I believe personally there is a huge potential in HOT and Holochain because of the idea that stands behind and the nice community they already have.
So keep an eye on the Holo, it might be a great investment for the rest of 2021. If you have any questions, let me know in the comments below. I’ll be preparing more lectures about price predictions and if you don’t want to miss them, make sure to subscribe to web push notifications from Trading Academy.
I will see you guys in another lecture.