In this MetaTrader 4 tutorial, we will show you more about the MetaTrader platform, especially if you are a beginner trader. Moreover, we will give you some tips that you need to know before you trade with Expert Advisors on MT4.
Table of Contents:
- Getting Started with MT4
- The Swap
- MetaTrader 4 live tutorial
- Types of Charts
- Positive & Negative Bars
- The Price Always Matter
- Creating Strategies
- Expert Advisors and MetaTrader 4
- Leverage
- Why Trade Small
- How to Diversify the Risk
- The Navigator
- What is a Demo account
- Candlesticks Customization
- Candlesticks Values
- MetaTrader 4 PDF Guide
Later in this lecture, you will be able to download a MetaTrader 4 tutorial in PDF and learn how to use the platform with examples.
Now, let’s jump into this MetaTrader 4 tutorial for beginners
This is how the MetaTrader platform looks like after you install it.
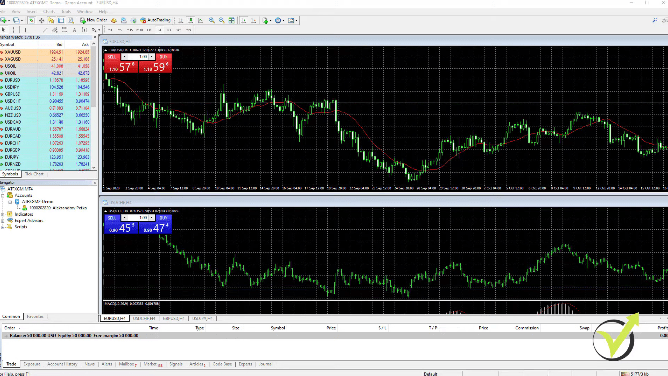
I have selected MetaTrader 4 for most of my courses because it is the most common platform for trading. It allows algorithmic trading, which is very important, and it is free. The brokers pay the MetaQuotes Company and the brokers provide the platform to us for free.
We don’t pay any monthly fees, charges, and so on. What we pay the brokers is the spread. This is the difference between the Bid and the Ask price.
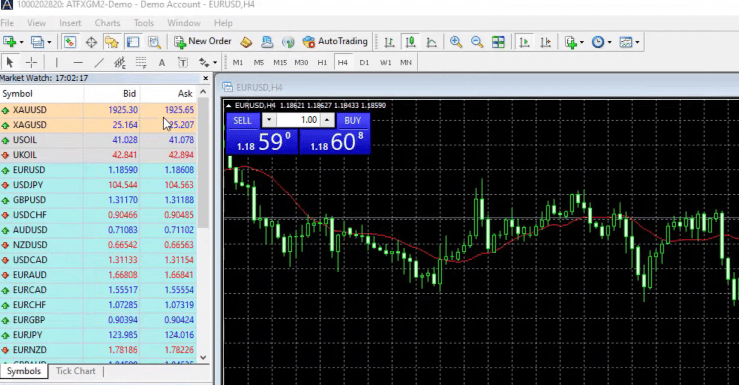
For beginner traders, when we buy an asset, we buy it at the Ask price or this is the more expensive price. And when we sell the asset, we sell it at the Bid price, which is the cheaper price.
For example, if I buy one trading lot at the moment at the price of 1.1860 and the price rises to 1.1960, this will be 100 pips of a profit. If I close the position at that moment, I will be closing it on the Bid price. Therefore, the broker will benefit from the difference between the Buy and the Sell prices. This is very normal and it is important to know when you are trading with Expert Advisors.
The Swap
The other cost that we pay the brokers is the swap. The swap comes if we hold our position overnight. If I buy EURUSD today, for example, I hold the position overnight, and I close the trade tomorrow, I will be charged a swap. This is the fee that the broker takes if it transfers the trade to the next day.
It is the same thing if you sell, but some brokers will give you actually a positive swap. In other words, if they hold your position overnight, you may benefit from that.
Let’s see, how much is the swap, for example, for EURUSD. If I right-click over the Market Watch, over the EURUSD and I click on Specification,
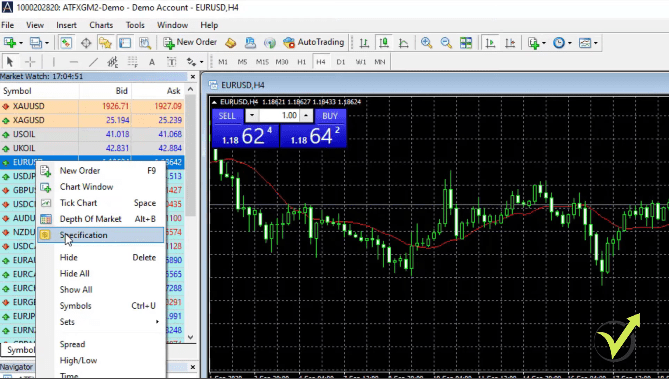
you will see below that I have some details about the asset.
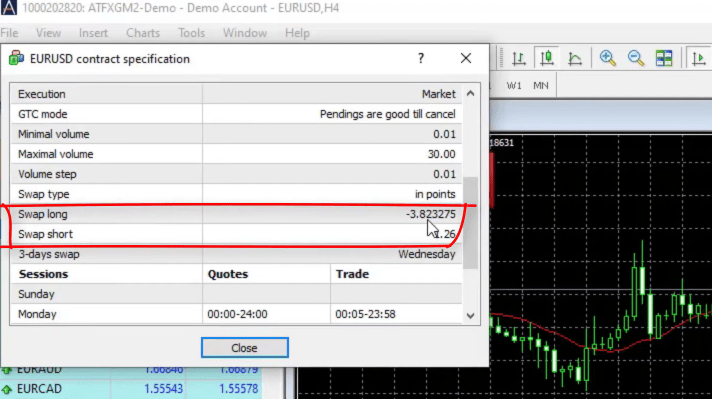
I have a Swap long negative and I have a Swap short positive. This means that if I keep my short trade overnight, I will have some positive swap out of that.
At the end of this MetaTrader 4 tutorial for beginners, you can download our MetaTrader 4 PDF Tutorial with some basic terminology about Forex trading which will help you learn all of these terms faster.
In the Market Watch, we see all of the assets that the broker offers you. However, if you don’t see too many, right-click anywhere on the Market Watch and check Show All.
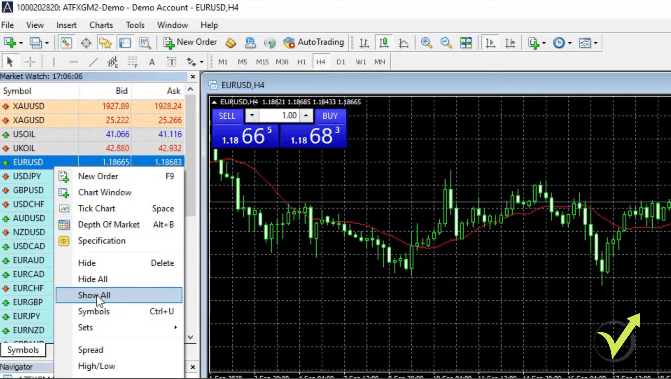
This will display more assets that are provided by the broker. Of course, it depends on the broker that you are using and the type of account you’re using.
MT4 Live Tutorial
So on the left side, we said that we have the Market Watch with the Bid and the Ask price.

This is from where we can select the assets we want to trade. If you don’t see all the assets, you can right-click and check Show All.

This will display some more assets depending on the broker you’re using.
And if you want to open a new chart, you just click on the symbol and you go to Chart Window.

So right here I have already opened 2 charts for Bitcoin and I have some more for Forex which was opened by default when I installed the MetaTrader.

So let me remove those. And I have 1 chart for Bitcoin on hourly time frame and the other one I can change, for example, to M15 timeframe.
Types of Charts
We have actually 3 types of charts. We have bars, we have candlesticks, and we have line chart.

The most popular is candlesticks.
So when we are on M15, this means that 1 candlestick or 1 bar represents 15 minutes of a time. The chart is a representation of the price which we have on the right side and the time which we have below the chart. Where these 2 meet, we have the candlesticks.
And if we are on hourly chart, then 1 candlestick or 1 bar represents 1 hour time frame. And for each candlestick, for each bar, we have the opening of the bar, we have the closing of the bar, the highest point and the lowest point.
Positive bars and negative bars
So in this case, the negative bar is represented with white color and the positive is with black color.

So if I put the mouse on the closing of the bar, you can see exactly what are the values for the open, high, low, and close.

And what happens after the bar closes, a new bar opens. So we have the closing of that bar and then the new bar opens. The price goes up and down. It closes at one level.
And because the closing was higher than the opening, we have a positive bar that is fulfilled with black and all of these colors you can change from Properties.

And if you go to colors, you can change what you want to see on your chart.

The price always matter
Now, I’m not touching that because when trading with Expert Advisors, it really doesn’t matter what you see on the chart. It doesn’t matter if you are on a candlestick chart, on the bar chart, what are the colors?
We don’t put any Indicators. Nothing over the MetaTrader 4 chart. I just wanted to give you a brief idea of what we see on the chart as price, because at the end of the day, the price always matters. And that’s the most important thing that is on the chart.
But for trading and strategies and Expert Advisors, we use different Indicators. So if I go to insert, Indicators and I click randomly on any of those let’s say I’ll select the trend Indicator called Bollinger Bands, which is a very popular Indicator in algorithmic trading.

You will see 3 lines that are around the price. But I’m not going into Indicators.

Creating strategies
I’m not going to explain any complicated stuff because you really don’t need to know it. And I will go to Indicators List,

and I will remove it.

One more time, when trading with Expert Advisors or with Robots, you don’t need to place anything over the chart.
The Indicators, the trading rules, they will be inside the Robots. And I will show you later on in the course what are the rules, how I create the strategies, how I test them even before putting on a Demo Account.
Then on the left, below the Market Watch, we have the Navigator.

This is where we have the accounts. As I said, you can have many accounts with a broker, but if you want to test Expert Advisors on different accounts, you need to install different platforms as well.
Expert Advisors
Below, we have the Indicators very similar if you want to insert them from Indicators or you will insert them from the Navigator, just double click on it and it will be over the chart. For example, the Accumulation Indicator is displayed below the price, not over the chart.

So let me remove it for the purpose of this MetaTrader 4 tutorial. And then we have some scripts that are useful for algorithmic trading and different purposes. But the most important is Expert Advisors. And I have 1 Expert Advisor for Bitcoin.
And in the next lectures, I will show you how I’m creating Robots, Expert Advisors, how I’m testing them and how I am installing them on the MetaTrader platform. Below the Navigator, we have the Terminal where we see our balance or our account, the equity, and the margin?

Leverage
So basically, the margin is how much free money we have in the account, how much we have blocked from the account, and how much free margin we have in the account. So when we start opening positions, some of this amount will be blocked.
And this depends on the leverage you’re using. For example, in Europe, we have the ESMA regulation since 2018 and we cannot have leverage more than 2 to 1 for the Cryptocurrencies, which means that if I want to buy a whole Bitcoin, I will need at least to have somewhere about $10 000. Depends on what the price of Bitcoin is at the moment.
But the leverage for the beginners with simple words is the amount of money that the broker borrowed the trader to use for trading. So if I have $5 000 in my account and I use leverage 2 to 1, then I will be able to Buy maximum with $10 000. If I use leverage 100 to 1, then I will be able to Buy 100 times more from what I have in the account. And of course the leverage is very useful.
Trade small
But when you are using it carefully, we don’t Buy with all of the money of the account because if you use high leverage and you open position with all of the money, then it is very likely that you will blow your account. Of course, you can make very quick profits, but that probably will be more of lucky trading. And at the same time, as I said, it is very likely that you will just lose everything in the account.
So take it easy with the leverage. It depends on where you live and what type of broker you use, but it is always very important to trade small piece from your amount so you are not risking the whole capital in a few trades. And this is how usually beginner traders lose their money in the 1st month of their trading.
Risk Diversification
The broker we’re using for this MT 4 tutorial, for example, offers more assets on its real account, which you will see later in the course. In this course, I will focus on the GBPUSD, which I believe you will be able to find with all of the brokers.
Actually, the GBPUSD is the third most traded currency pair, the first being EURUSD. The second is USDJPY, and the third spot is GBPUSD.
However, in most of our courses, we include different strategies for different assets. In other words, if you have already many of our courses, you will have Expert Advisors for EURUSD, USDJPY, EURJPY, and EURGBP.
You will have a great diversification of your risk by trading different assets.
For this course, I will include different strategies for the GBP so you will not rely on one single strategy or one single Expert Advisor. And still, this way, you will have an excellent risk diversification which you will see a little bit later in the course.
If you want to trade any of the assets, all you need to do is to right-click over it in the Market Watch and go to New Order.
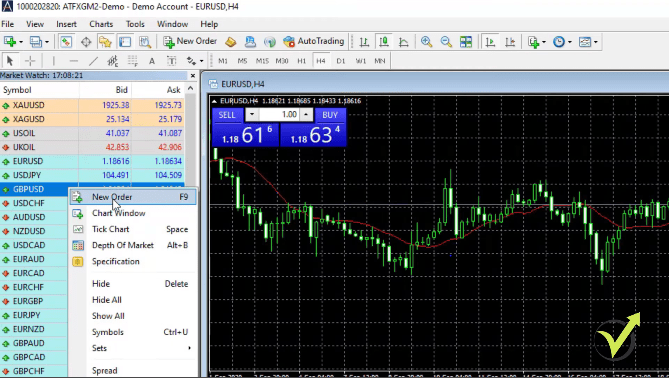
This is where you can execute an order, you can set the volume, how much you want to trade, the Stop Loss and the Take Profit.
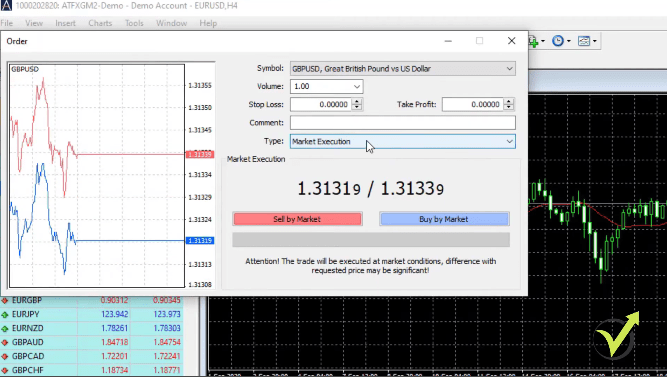
MetaTrader 4 Tutorial: The Navigator
If you want to execute the market price at the moment you can just sell or buy. Or you can use a pending order. In other words, you can select what type of pending order you want to do and select the price at which you want to buy or to sell.
I’m not doing manual trading and I won’t be executing trades manually. You will see how I do it all with Expert Advisors.
In the Navigator, you will see that we have the Accounts. In addition, this is where you will see your account that you opened with the broker, if you have a Demo or if you have a live account.
Then we have different indicators that you can use for your strategies.
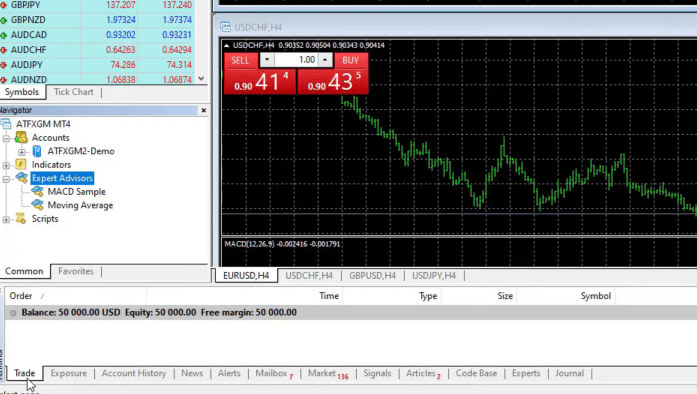
After that, we have the Expert Advisors, which I will show you how to put on your MetaTrader just in the next lectures. Below we have some scripts that are useful for different purposes when you’re using MetaTrader but I am not going into details about that in this tutorial.
The Demo account
Below the Navigator, we have the trading terminal where you will see the open trades and the closed trades. Moreover, we will have the account history where we will see all trades that open and closed.
I have opened a Demo account of 50000 USD, this is virtual money. So if you open a Demo Account and you lose, regardless of whether you are doing manual trading or with Expert Advisors, don’t worry – this is virtual money. In other words, you won’t owe anything to the broker. You can always restart your account and practice. This is the best thing.
To sum up, when you have a Demo account that you are actually trading, you have access to the market and you can practice without losing anything.
Don’t hurry to risk real money until you are confident with the system and until you feel satisfied with the strategies, with the Robots that you’re using. Not just from this course, but any other strategies that you learn.
Make sure to practice and make sure to master it before risking real money on the market.
In the middle of the screen, you see the charts and you can modify those. I can right-click and select Tile Windows. This will split the window into 4 charts, and I can close them if I want and leave just one. As I’ve said in this course, I will be trading the GBPUSD.
Customize the Candlesticks in MetaTrader 4
For the Expert Advisors, it really doesn’t matter if you have indicators over the chart or not. Therefore, what I like to do for the purpose of this MetaTrader 4 tutorial, is just to remove the indicators from the chart, and as well I remove the grid behind. So I can right-click over the chart, go to Properties,
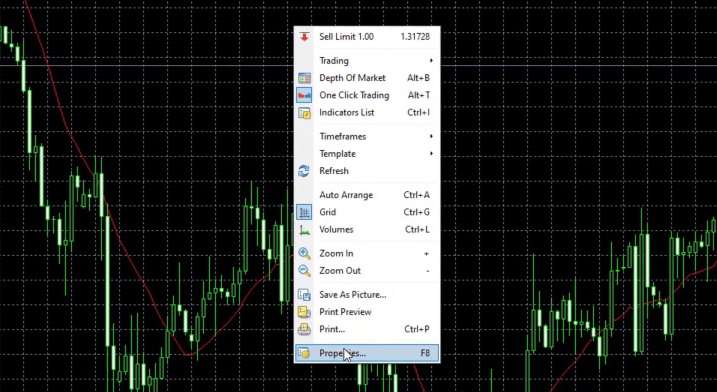
and from Common I can uncheck Show grid as well.
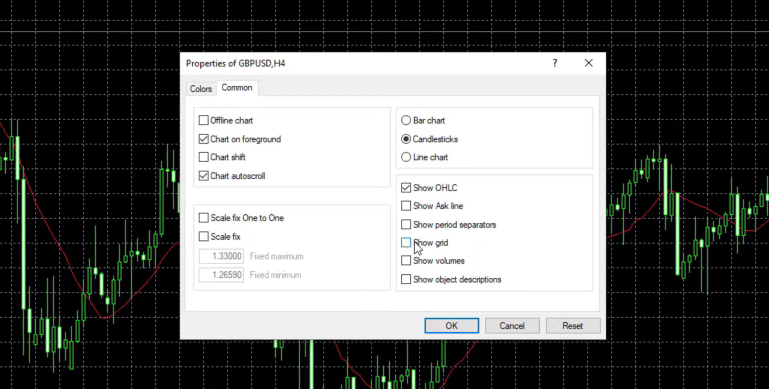
I can change the colors of the candlesticks or I can leave them the way they are.
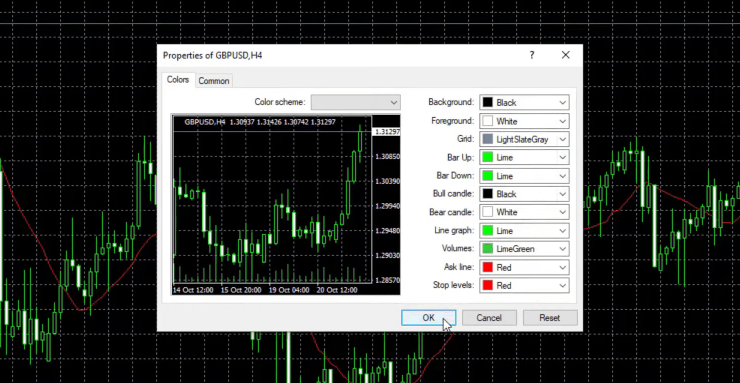
It doesn’t really matter for algorithmic trading.
One more time in this MetaTrader 4 tutorial for beginners, I will go to Indicator’s List because I didn’t remove the Moving Average.
The last thing, I will uncheck One-Click trading because I don’t need it. This is the default chart and I can actually save it as a template. I will right-click over the chart, go to Templates, Save Template,
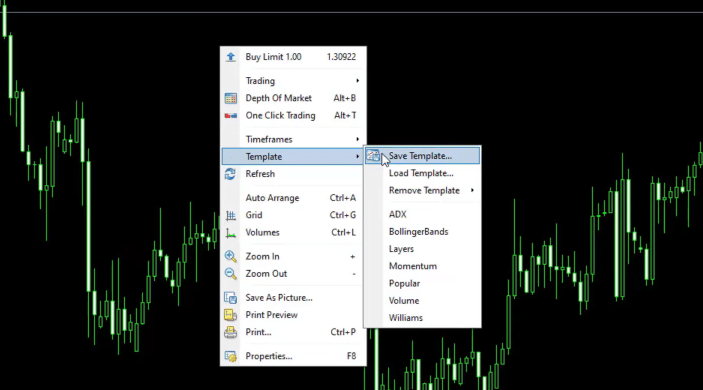
and I will save it as Empty template.
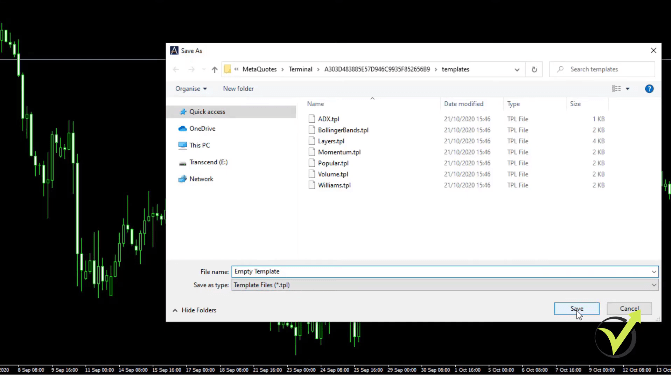
This way, I know that whenever I want to have an empty template, I can easily do that.
The 4 Candlestick Values
You can modify your MetaTrader trading platform any way that you want. For instance, you can switch to a bar chart or to a line chart, which is the very same thing.
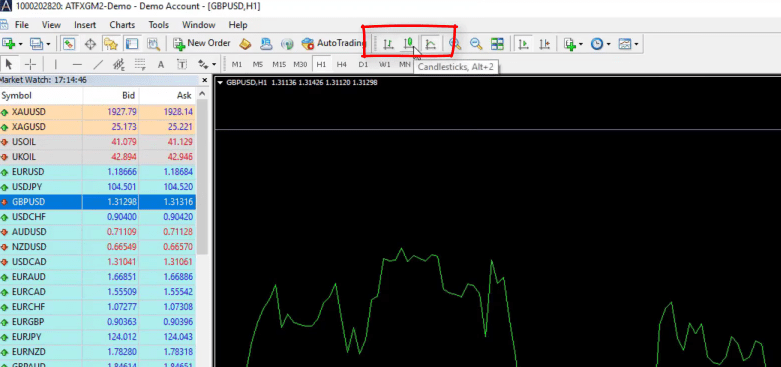
But with candlesticks, we have a more visual representation of the price by having the candlesticks colored according to whether they were bullish or whether they were bearish.
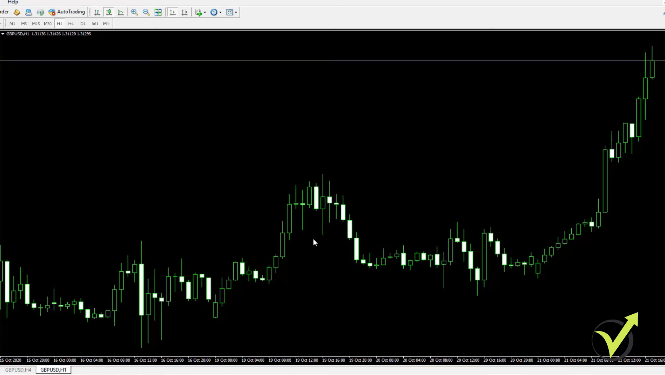
In other words, if they were positive or if they were negative. And if I put my mouse on the closing of any of the candlesticks, you will see that I have 4 values: High, Low, Close, and Volume.
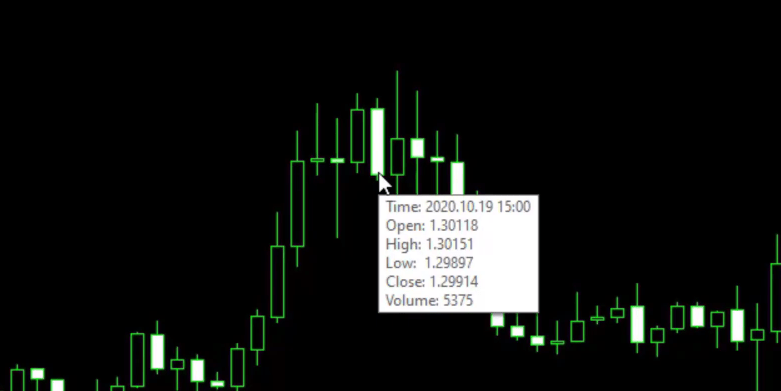
These 4 values are for the historical data which we are using in algorithmic trading to create Expert Advisors and to backtest Expert Advisors.
And the current price for GBPUSD is 1.3126 and all the rest that you see before that is called historical data.
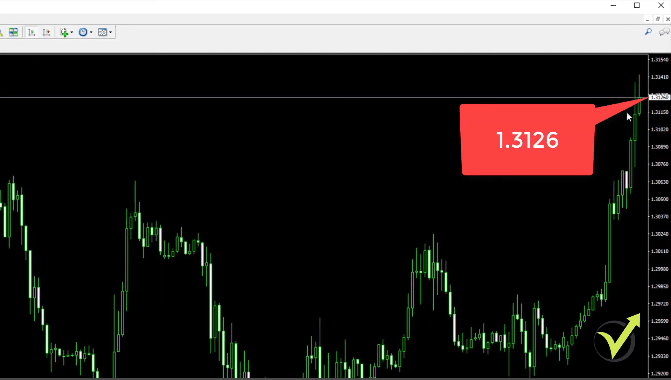
In another lecture, I will show you how we use this historical data to create strategies and Expert Advisors and to see how they performed until the moment. And along with the lecture, I will show you more about the MetaTrader platform, so you will feel comfortable with it.
This is about the MetaTrader platform tutorial for beginners. If you have any questions, let me know. By the end of the MetaTrader 4 course, you will know exactly what you need to do in order to test Expert Advisors and to see some profits into your account.
But if you just play around with the trading platform, you will see that it is very easy to use, and especially for algorithmic trading is just a few clicks to put the Expert Advisor on the MT4 chart and to make it start trading for you. Thanks for reading this MetaTrader tutorial for beginners. See you in the next lecture.

