Most people jump into MetaTrader 4 trading with the idea of using indicators as a primary tool but there are some concerns when using indicators, so stay with me and I will show you what I mean. Actually, the indicators on the different platforms are very similar, so no matter if you use MetaTrader 4 or another platform, you will encounter the same issues when using indicators over the charts. Later in this lecture, I will show you how to install indicators on the MT4 chart, and by the end of the lecture, you will have a better understanding of the indicators in MetaTrader 4.
Table of contents
- Why use MetaTrader 4 technical indicators
- Types of MetaTrader 4 indicators
- When to buy or sell based on indicators
- MetaTrader 4 indicators are repeating
- Default indicator parameters
- Combining different indicators
- How to install indicators on the MT4 chart
- MetaTrader 4 indicators properties
- Changing the visualizaion of indicators
Why use indicators in MetaTrader 4
For the purpose of this lecture, I have selected to use BlackBull Markets which is a trusted broker from our regulated brokers that we use in the Academy. You can check them out on our website if you have no idea which broker to use, so this will be useful for you if you have a hard time finding a broker.
So in front of me, I have the EURUSD chart for 1 hour which means that every candlestick represents 1 hour and this is a plain chart. We don’t have any indicators and if you are a beginner probably the chart doesn’t mean anything to you and you are frustrated. But even if you are advanced, even for me sometimes when I look at the charts, I don’t know is it a good time to buy or is it a good time to sell.
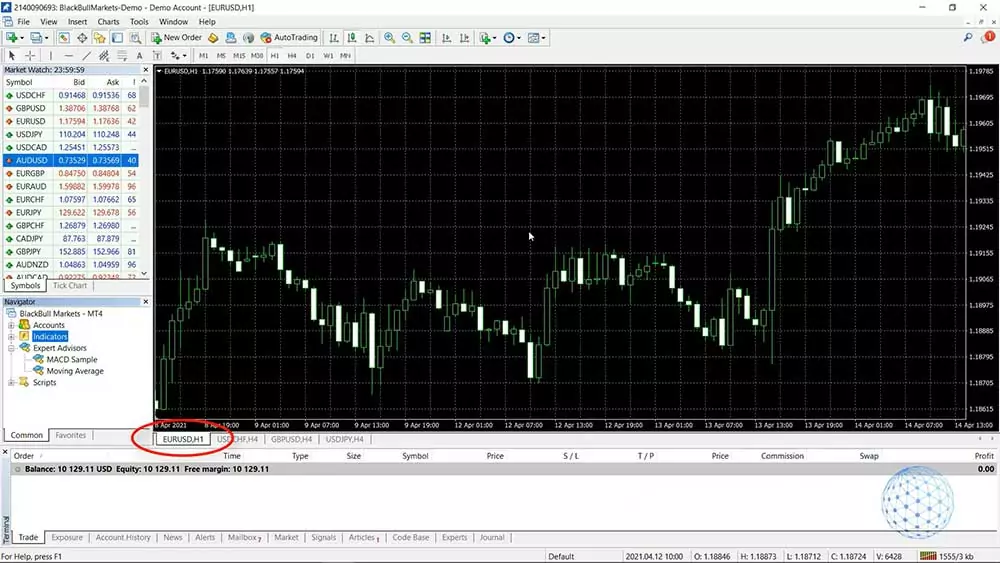
For example, if we look at one moment back in April the market just goes up and down, up and down, up and down and what is it now? Is it time to buy? Or is it time to sell? Without an indicator over the chart, it’s really hard to say where the market is going and even if I go to a lower time frame like M30, you will see the very same thing, even if I switch down to M15, it’s hard to say.
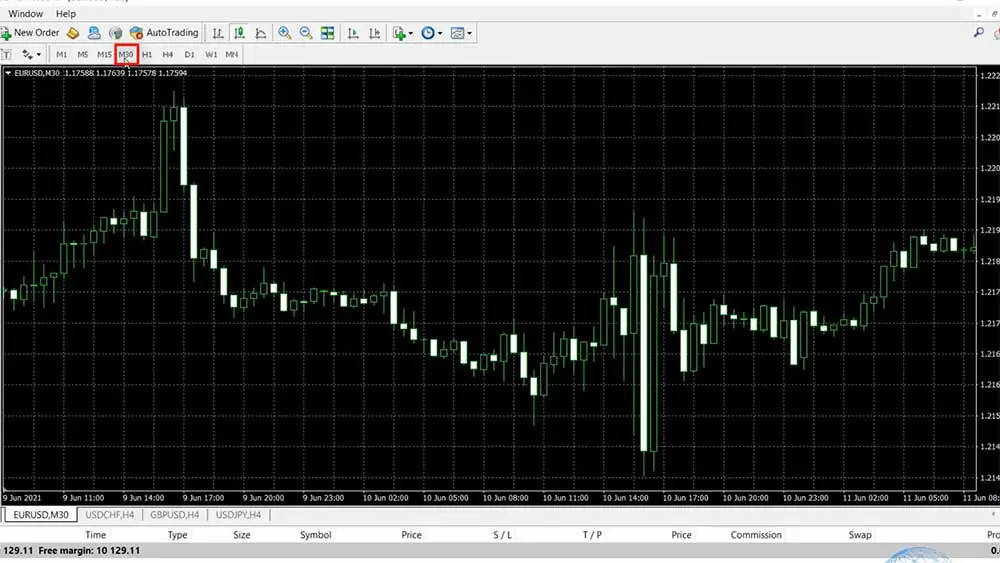
There are moments when the market goes in one direction and it’s easier to understand and to do some prediction but when the market is just going up and down and we see the chart without looking at the bigger picture on a daily chart, it’s really really hard to say where the market is going.
Types of MT4 indicators
Alright, so let me put now one indicator over the chart, I will click on Insert and this is where the MetaTrader 4 indicators are located. They are available as well in the Navigator but if I click on Insert and I go to Indicators, you will see that they are grouped in different categories. We have the Trend Indicators, we have the Oscillators, the Volumes, the Bill Williams and we have some Custom Indicators.
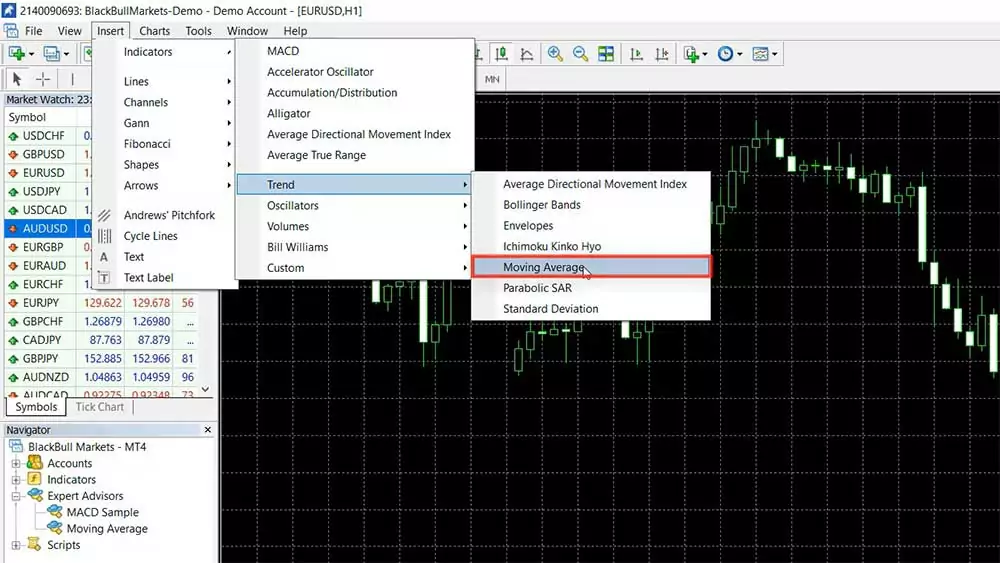
Now, the Trend indicators are probably the most popular ones and I will choose the Moving Average which is one of the first Indicators out there and for me one of the best indicators. Okay, now we have by default a period of 14 but I will select a period of 5, just to explain better what that is and to give you a better idea about how we use these indicators.
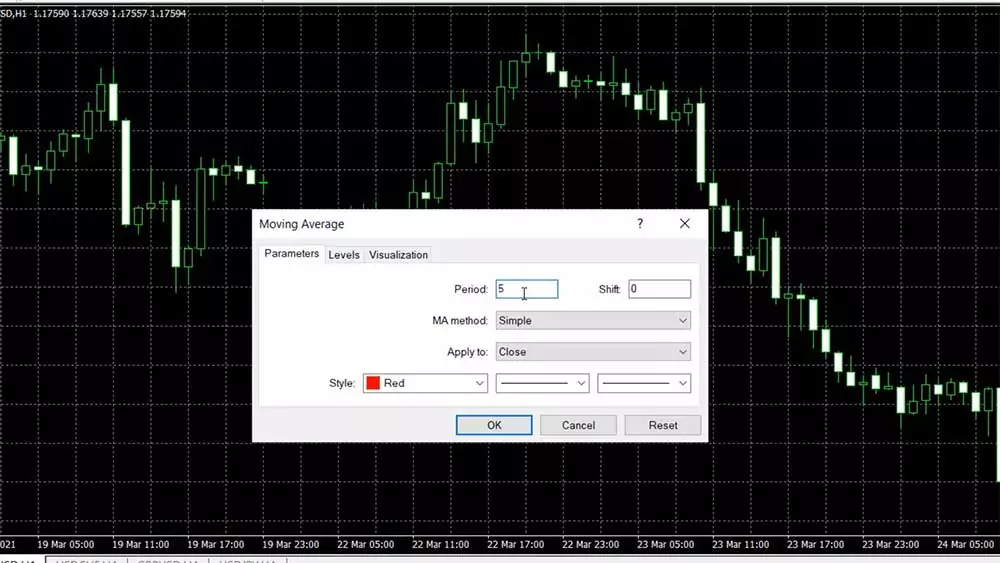
So after you click OK, you see a line over the chart that goes below the price when the market is bullish and it stays above the price when the market is negative.
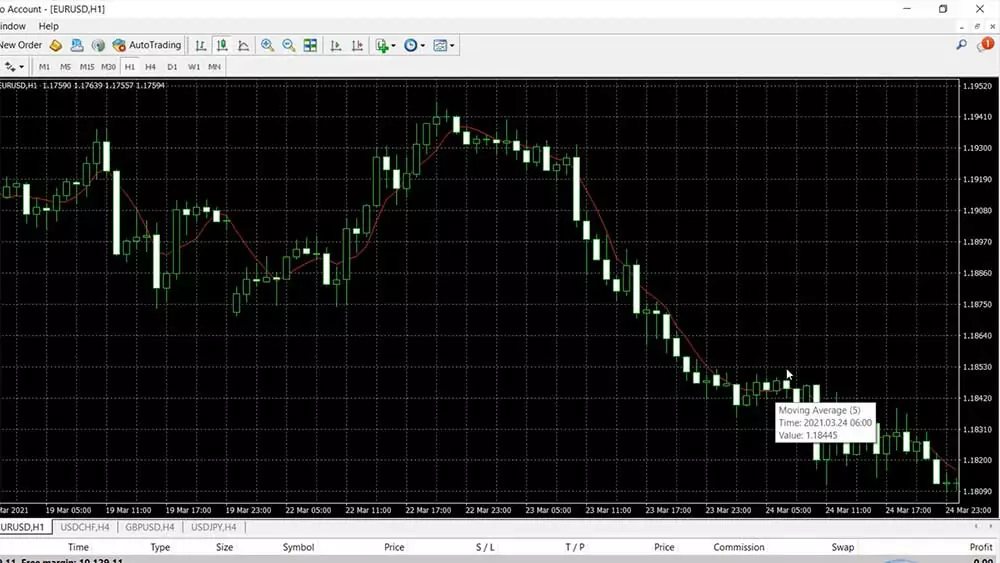
Okay, and if I scroll the chart, you will see that sometimes this Moving Average goes through the candlesticks. So how do we know when it’s a good idea to buy or to sell?
When to buy or sell based on indicators
Now, when using MetaTrader 4 indicators, there are a variety of strategies with each indicator, so with this Moving Average, I can give you a lot of trading strategies but I will give you an example of one right now. It is a decent trading strategy and I’m using this strategy a lot with Bitcoin actually.
Every time when the bar opens above the Moving Average actually for the Bitcoin, I’m using it on a daily chart but right now I just want to give you an idea of how I’m using the strategy. I will take a cross here to make it more visual, so every time we have a bar that opens above the Moving Average we have a buy signal.
For example, we have a candlestick that opened above the Moving Average so this is a buy signal at that moment. I can put one horizontal line and I can put a vertical line.
Here we go, at that moment we have the buy signal, and then when we have a bar that clearly opens below the Moving Average, we close the trade and we take the profit. On the chart below, you can see that this bar, or this day, this candlestick opened below the Moving Average so in this case, we would make a profit of over 200 pips, actually, if I have to be precise it is 205 pips on a daily chart.
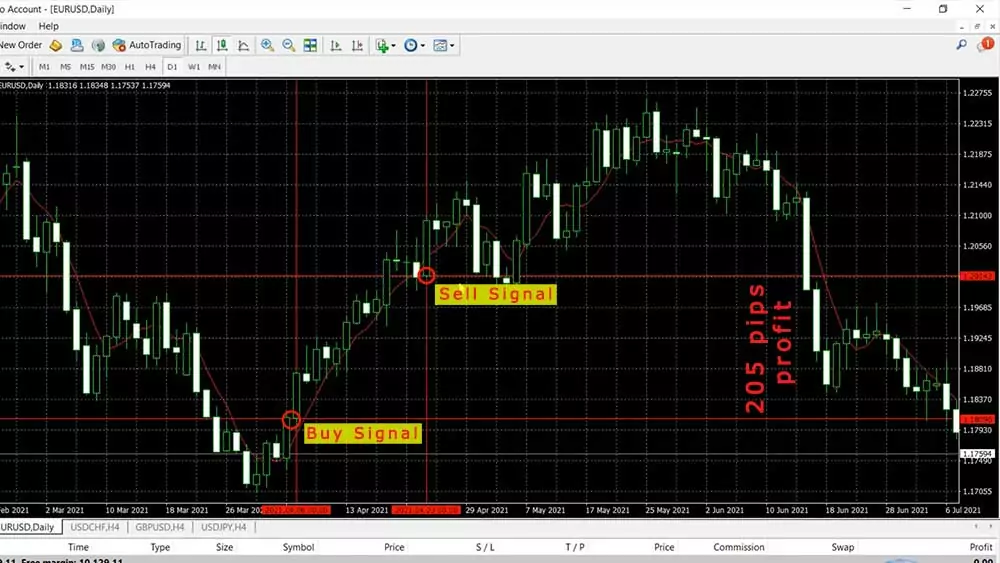
I have explained this trading strategy recently in one of my Bitcoin courses. It is called the Simplest Bitcoin Trading Strategy because it’s super simple indeed but I use one more Moving Average to confirm the direction. I’m not going into this strategy right now because I want to explain for beginners what are the MetaTrader 4 indicators, how useful they are, and at the same time what are the cons.
MetaTrader 4 indicators are repeating
Now if I zoom the chart over here with the example I picked it super randomly, one more time that’s not a strategy for EURUSD, it’s for Bitcoin and I’m showing it over the EURUSD just for demonstrational purposes, but I want to show you something. If we look back at the chart have a look at this candlestick.
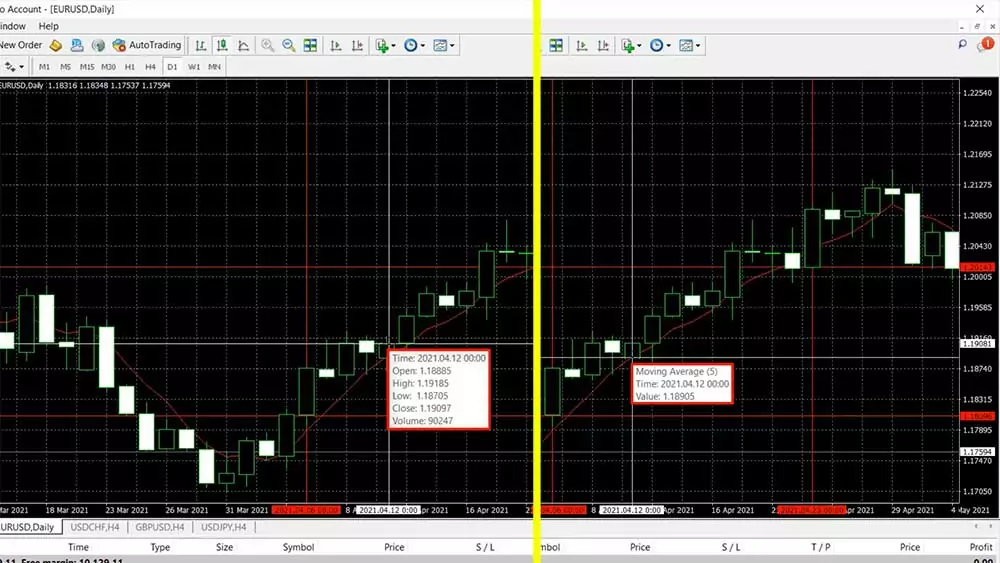
I said that when the candlestick opens below the Moving Average we should be closing the trade. Now I will ask you something – did this bar open below or above the Moving Average? It’s super hard to say because if I put the mouse on it we can see the 4 values that we have – the open, the high, the low, and the close prices. So the open price is at 1.1888 right but the Moving Average has the value of 1.1890, a little bit higher but pay attention to this.
If I right-click over the chart and I go to the indicators’ list, I will go to the settings of the Moving Average, I will click on edit and you will see that it applies to close which means that the value of the Moving Average is at the closing of the candlestick, not at the opening, so we don’t really know where the Moving Average was when the bar opened.
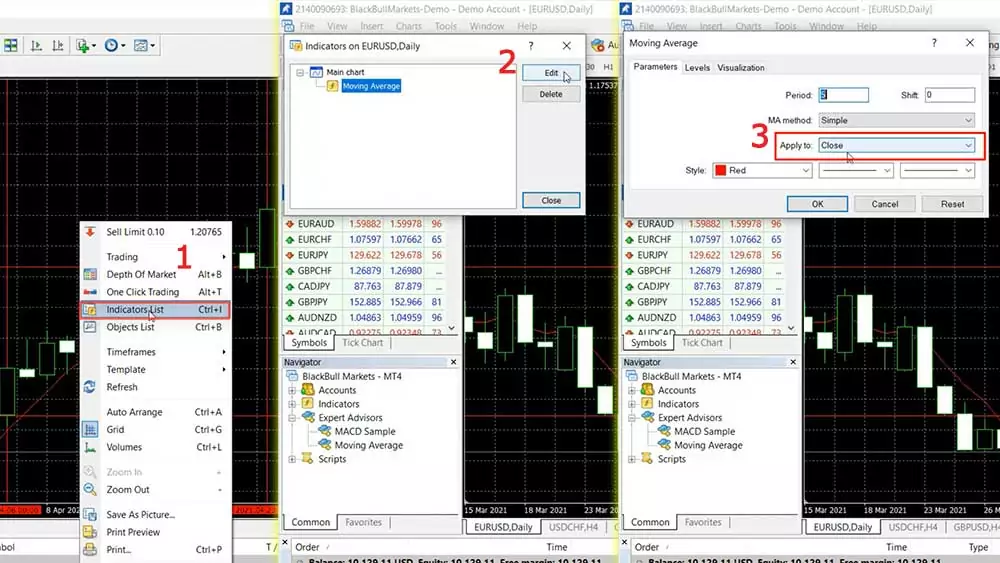
We can assume that it was the value from the previous bar because when the previous bar closed, there should be an opening, but because this is a daily candlestick there is a difference between the closing and the opening of the next bar. So just to summarize it, probably the Moving Average was lower than the opening at this candlestick, but we cannot say this with certainty. We don’t know this from the chart and a lot of traders and mentors build their strategies just by looking back on the chart but that is wrong.
What you need to know about the Moving Averages and about most of the MetaTrader 4 technical indicators is that they are repeating. So we don’t know what exactly happened at the opening of this bar. If I go to the end of the chart by pressing this button on the top which says scroll the chart to the end on tick incoming, you will see that the price is not moving simply because it is Saturday.
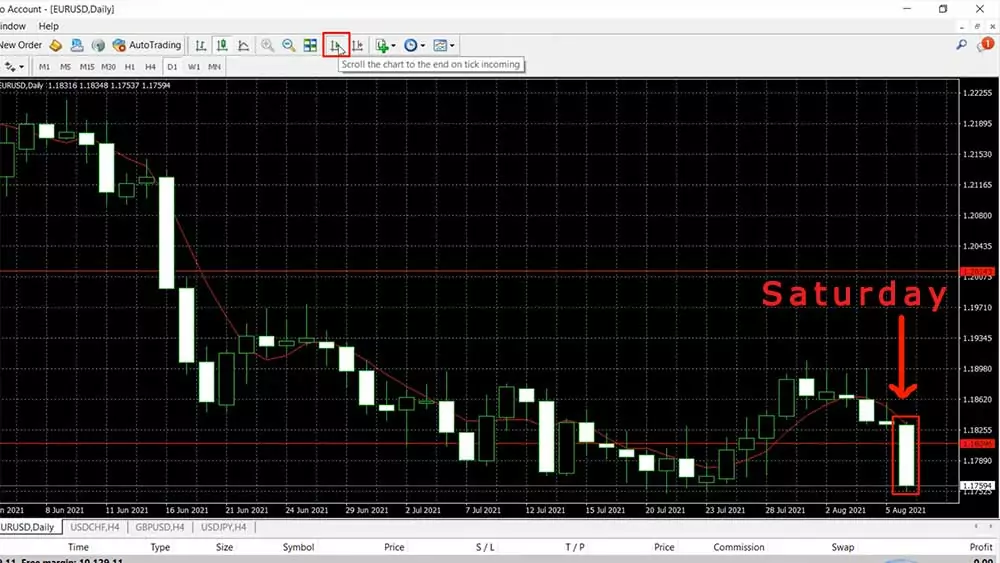
I’m preparing this lecture about MetaTrader 4 indicators on Saturday. I usually take my time during the weekends to record as many examples as I possibly can when I’m not trading and you will see that we have a current value for the Moving Average that sits at 1.18323, but this value was different at the opening of the bar and it’s totally different at the closing of the bar.
So during the day on Friday, this value of the Moving Average indicator was changing, and then on Monday when the market opens, we will have a fixed value of the Moving Average technical indicator in MetaTrader 4. Alright, so how the Moving Average is calculated? I wanted to bring out the first concern which is the major concern when we are using Moving Averages and other MetaTrader 4 indicators. But of course, there is a solution to this problem which I will mention just in a second.
So for you to understand me better I want to tell you how the Moving Averages are calculated. What actually the Moving Average does, it makes the chart smoother. I will increase the Moving Average right now, I will make it thicker, I will pick the thickest option, I will click on OK and here it is.
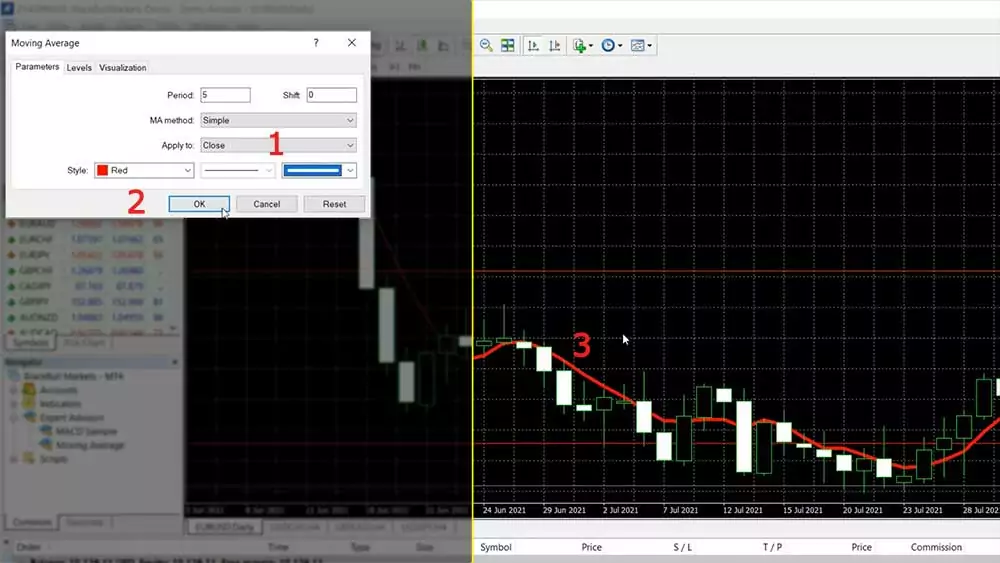
So if you try to ignore the candlesticks and just look at the line you will see that it makes the chart smoother. Right there the market goes down, after that it goes up and you see with our example we have positive candlestick, negative, positive, negative, positive, positive, positive, negative, positive, positive.
We have a kind of Gravestone Doji formation or something like that and here the market just goes sideways. But you see that the 5 Moving Average clearly shows that direction is upwards and the market continues until that moment. Then we have a drop, then the market continues higher.
Simply said, the Moving Average makes the chart more understandable, smoother and we have an idea of where the market is going. Is it going down, is it going up, is it staying just flat or it’s just sideways, right you can see that the Moving Average really shows the direction.
So the first concern is that it is repeating, it changes its value on the current bar and the first pro is that it makes the chart smoother so we can clearly see the direction.
Now how the Moving Average is calculated? The Simple Moving Average is calculated based on the closings of the candlesticks and because I selected a period of 5, it means that the last 5 days are summed and divided by 5. So it is the closing of that day, plus the closing of this day, plus the closing of this day, plus the closing of this day, plus the closing of this day, divided by 5, it’s that simple.
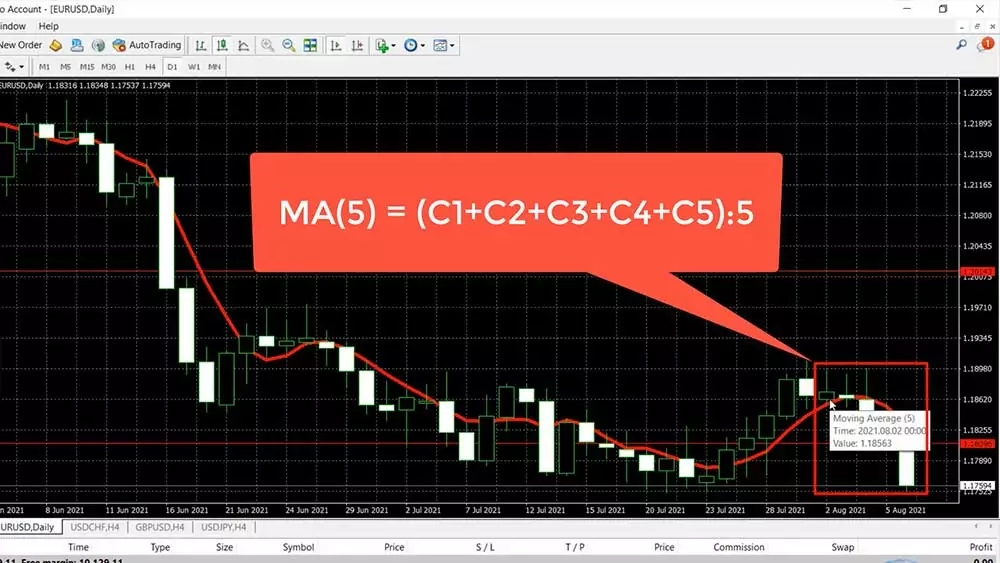
This is how the Moving Average is calculated, it’s super simple and that’s why it’s called a Simple Moving Average. We have a few different Moving Averages by the method they are calculated, so it could be a symbol, it could be exponential, it could be smoothed or it could be weighted but I’m not going into details on how they are calculated.
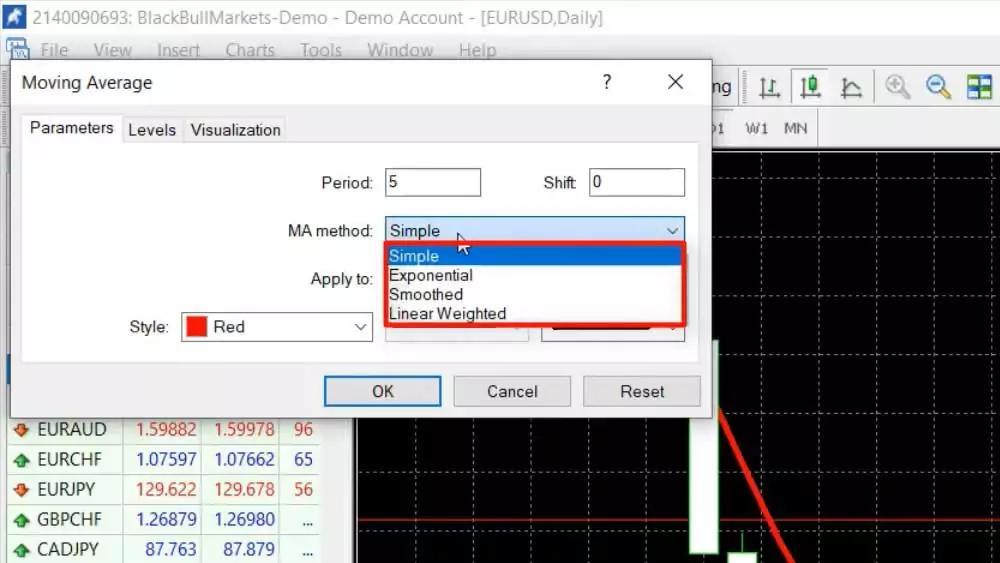
If I switch to exponential you will see no big difference, look at the chart here it is a very very small difference. It depends on what your strategy is and where are the entries, the exits, some strategies work with the Simple MA, some strategies work with the other methods. One more time, not a huge difference over the chart.
The default indicator parameters
Alright, so the different MetaTrader 4 indicators are calculated with different formulas. You don’t need to go into details about the indicators but the second concern that you need to know about the indicators is that the default parameters don’t really work.
So by default as you saw with the Moving Average, there was a period of 14 but these default parameters were created from the brokers and if you use the default parameters, probably you’re about to lose money. I don’t say certainly but I say probably.
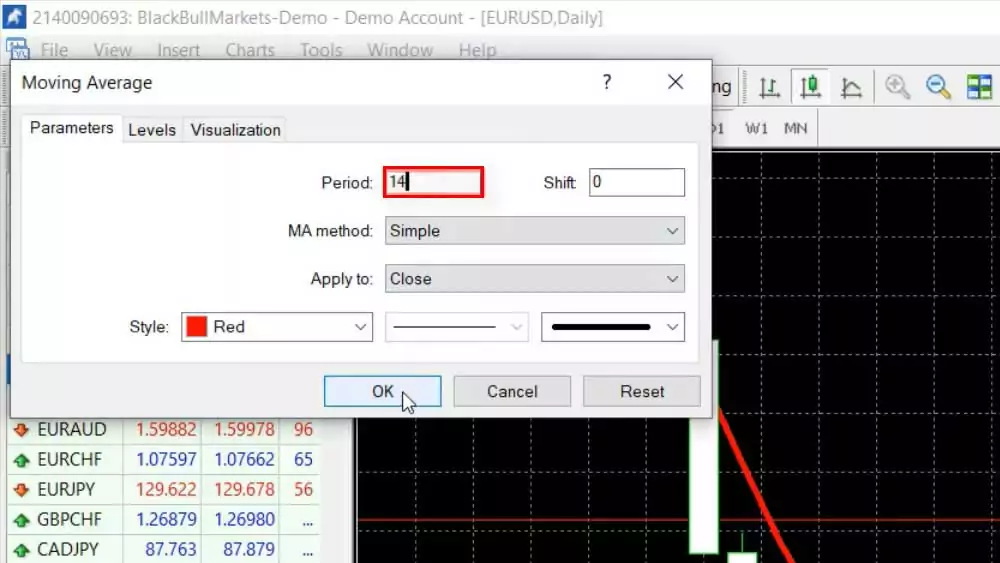
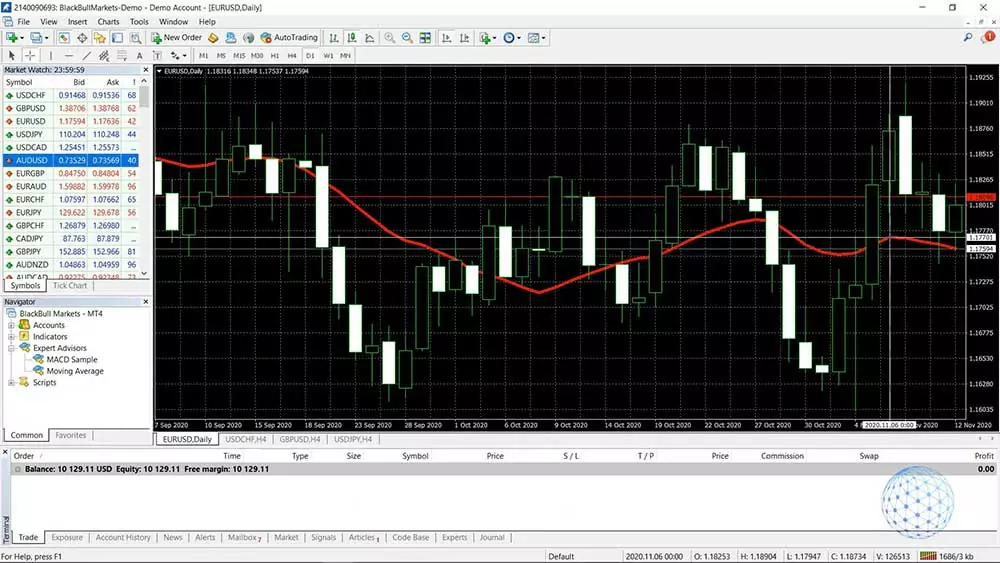
Look at that example with the default 14 – if you buy when the price goes above and you sell when the price goes below, you will be buying and selling a few times. Well, it’s hard to say right, depends on the strategy one more time but the default parameters doesn’t really work.
Combining different indicators
Now the second pro I want to give you is that you can combine different indicators. For example, I will add a Moving Average of 50 and I will click on OK. We’ll make it thicker again, let’s change the color to green and I will click on OK.
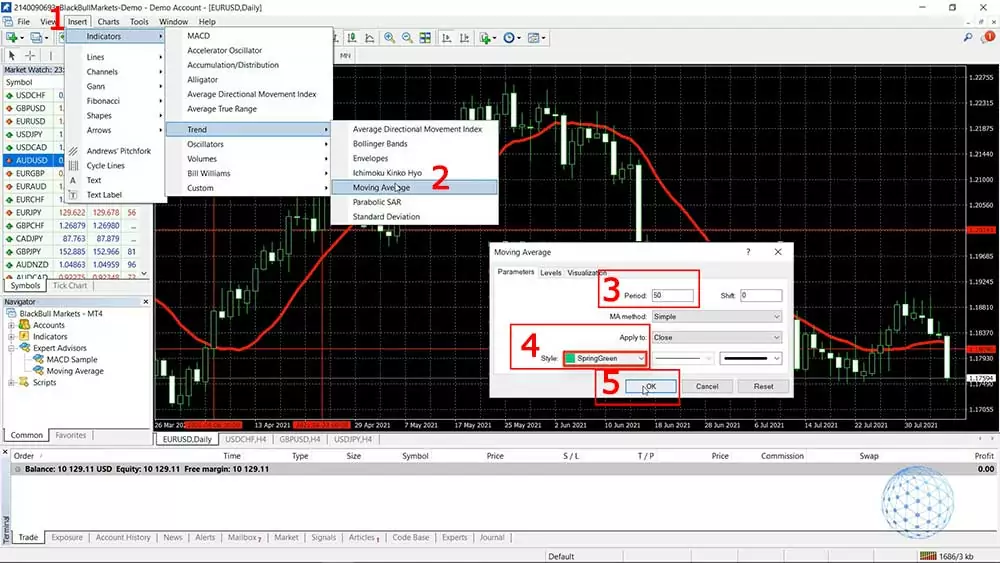
When we have 2 Moving Averages it’s one of the first methods to build a trading strategy. We can use the cross so when the Slow Moving Average crosses the long one it’s a decent buy entry and then when they cross we can sell but I would prefer to do the following. When they cross I would buy and when the fast or the 5 Moving Average turns downwards I would sell.
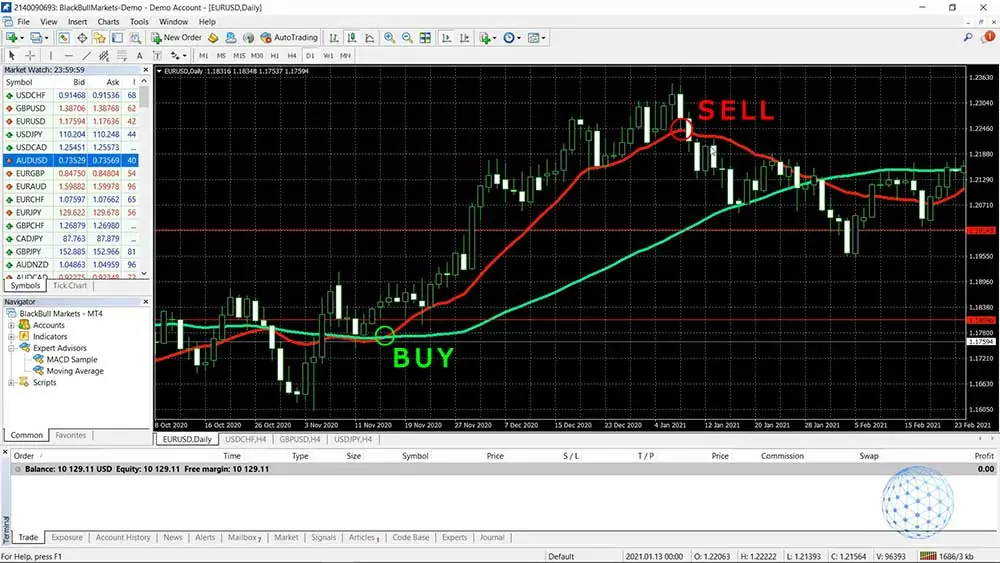
So for example with this one, it would be an entry at about 1.1858 and it would be an exit at 1.2213. But one more time that’s not a precise trading strategy, I’m just giving you an example of how the MetaTrader 4 technical indicators could be used and there are a variety of strategies. So when we have two or more indicators over the chart we eliminate the false entries and we build trading strategies.
Using indicators in EA Studio
In upcoming lectures, I will be talking about building a strategy, how we know exactly where the entries are and where are the exits. I personally use a professional strategy builder called Expert Advisor Studio and you can find it on our website. You can test it and build strategies during the free 15 days trial which is super useful. So in EA Studio, I have the 5 Moving Average and you can see the 50.
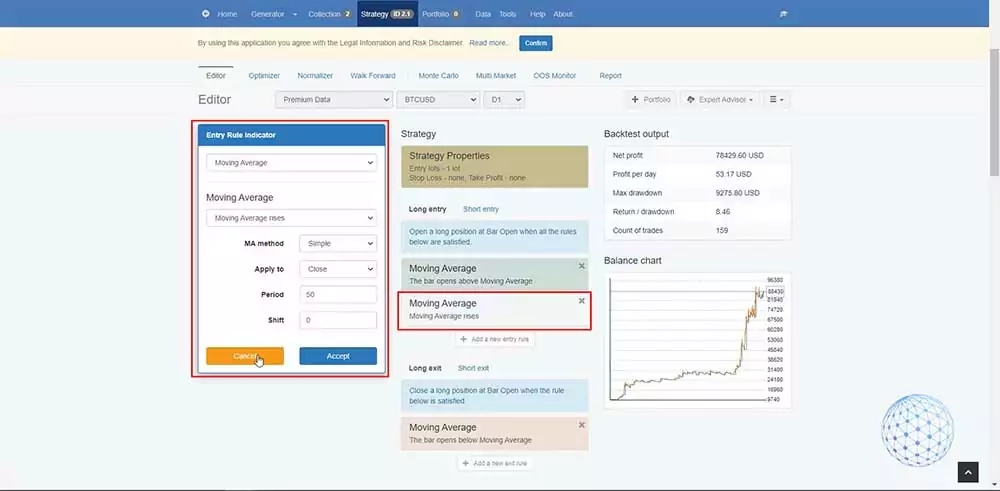
This strategy applies to Bitcoin and you can see the backtest so we can see clearly what is the performance, we can see clearly all of the trades that open and closed. This saves a lot of time because we can build the strategies and we can even automate it as an Expert Advisor and trade it automatically on MetaTrader 4 but without that, I wouldn’t know what are the right parameters for the strategy.
If I switch for example to EURUSD, you will see that this strategy doesn’t really work that well, it’s just going up and down and up and down, not as good as with Bitcoin. So again I wouldn’t know that without a strategy builder.
How to install indicators on MT4 chart
Now, I will show you how to install MetaTrader 4 indicators over the chart. I will give you some tips when using indicators. In front of me, I have the MetaTrader 4 installed using the BlackBull Markets which is a regulated broker from our trusted Broker’s page, so if you’re ready because I am. Let’s go for it.
So, the MetaTrader indicators are available in two places on the platform. One is you can insert them from the top menu, just on the first pop are the Indicators and we have a few that are probably the most common for the Broker, and then we have the Trend Indicators, the Oscillators, Volumes, Bill Williams, and Custom. With the different brokers, you can notice a small difference but this is the common MetaTrader 4 indicators list.
It’s super easy to install MetaTrader 4 indicators, all you need to do is click over one. For example, I will select Bollinger Bands, and here comes the menu.
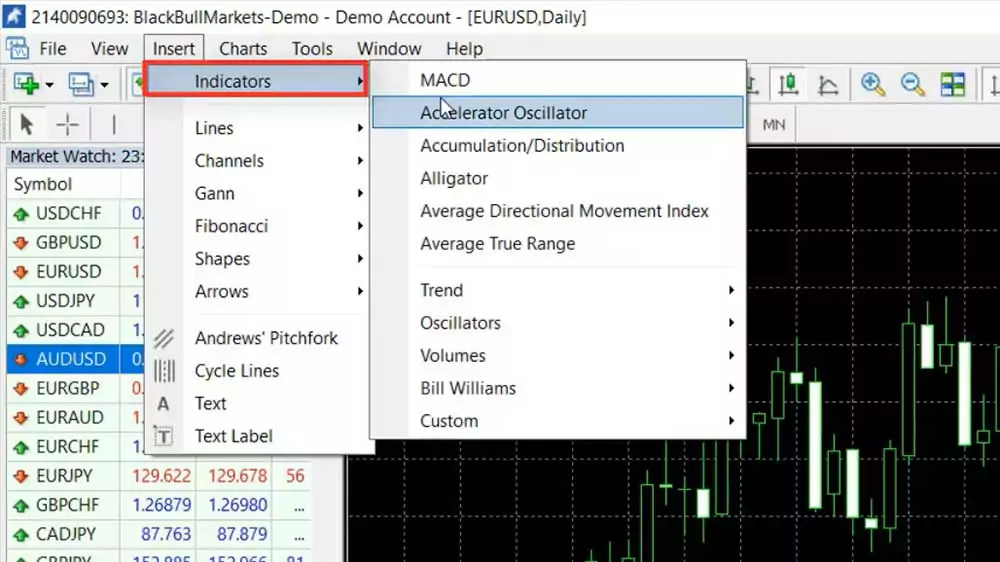
I will close it for a second and I will show you the second option we have in the Navigator. You will see under the Accounts, we have Indicators and here we have them grouped in the very same way. All you have to do to install the MT4 indicator is to double-click on it or you can drag and drop it over the chart.

So with the different indicators in MetaTrader 4, we have different inputs and periods, different deviations. It depends on what the indicator is all about and depends if it is a part of your strategy.
MetaTrader 4 indicators properties
Now, the Bollinger Bands is one of my favorite indicators, a very useful one and it has two parameters, Period and Deviations.
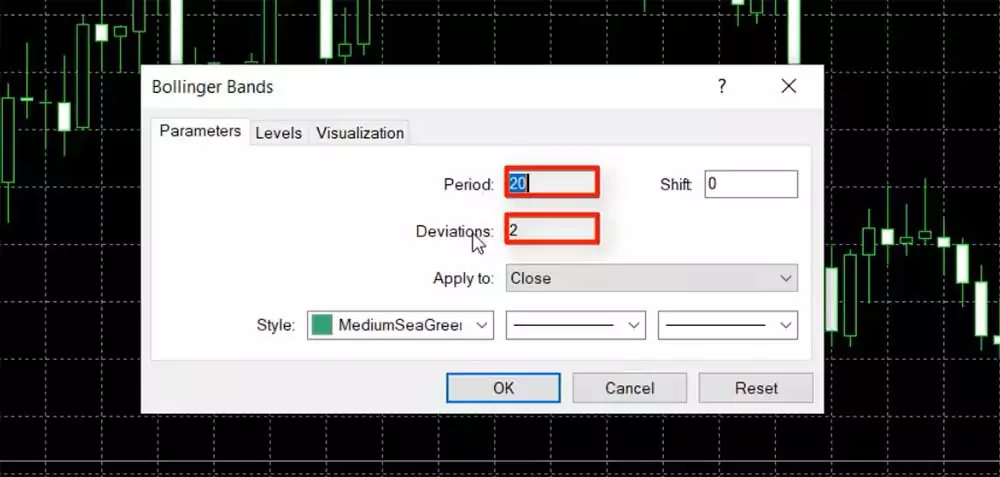
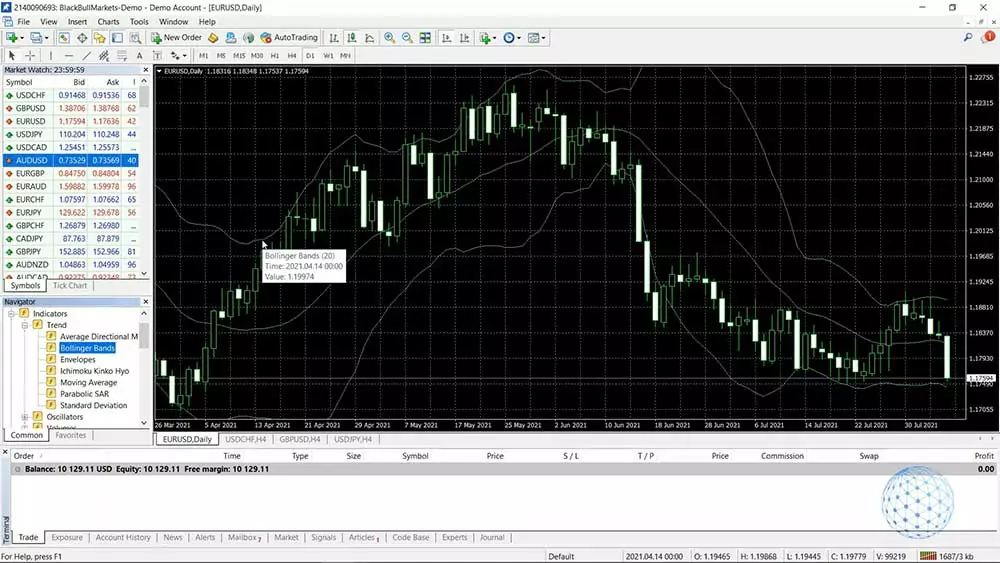
I will leave it by default and I will click on OK and you will see how it looks like. Basically, we have those Bands that are above and below and we have this kind of Moving Average, going up and down around the price.
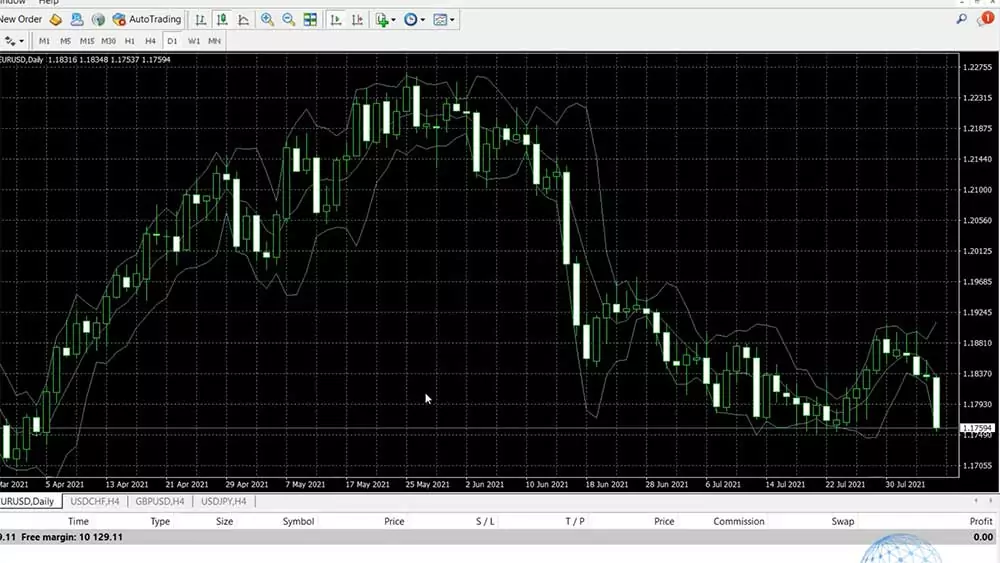
So if I click one more time on the Indicator Properties and for example, if I decrease the period, let’s say I will leave it to 5 and I will click on OK, you will see that it gets much closer to the price. The Moving Average is faster so the Bands are getting closer to the price.
Now, let me change the Deviations, instead of 2, I will increase it to 5 and I will click on OK. So what you have noticed is that the Moving Average didn’t change but just the Bands went further from the price.
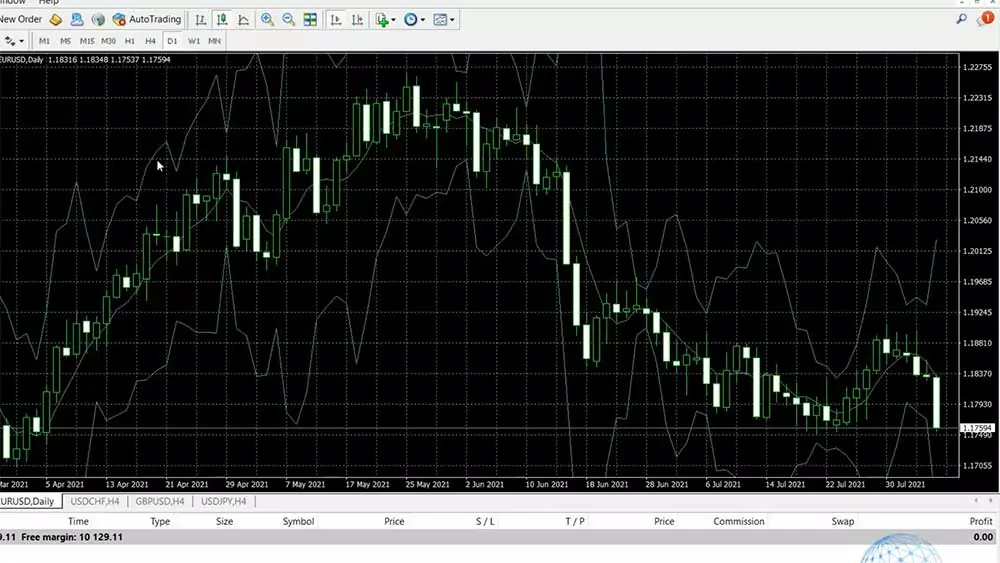
Okay, so, it really depends on the properties and the parameters that you will be using for each MT4 indicator. The visualization over the chart will be different and this depends, again I say, on the strategy that you will be using.
If I increase the deviation to 0.5, for example, I’ll click on OK, you will see how small the Bollinger Bands become and it’s really just going over the chart. So if I go back to 5, you will see that I can give you a variety of strategies that you can apply but what is interesting about that indicator is that we don’t use much of the Moving Average going through the price but when the price touches the Bands.
For example, when the market is just going sideways, if the price touches one of the upper Bands, it could be a decent sales signal and when it touches the other Band, we can close the trade and take the profit.
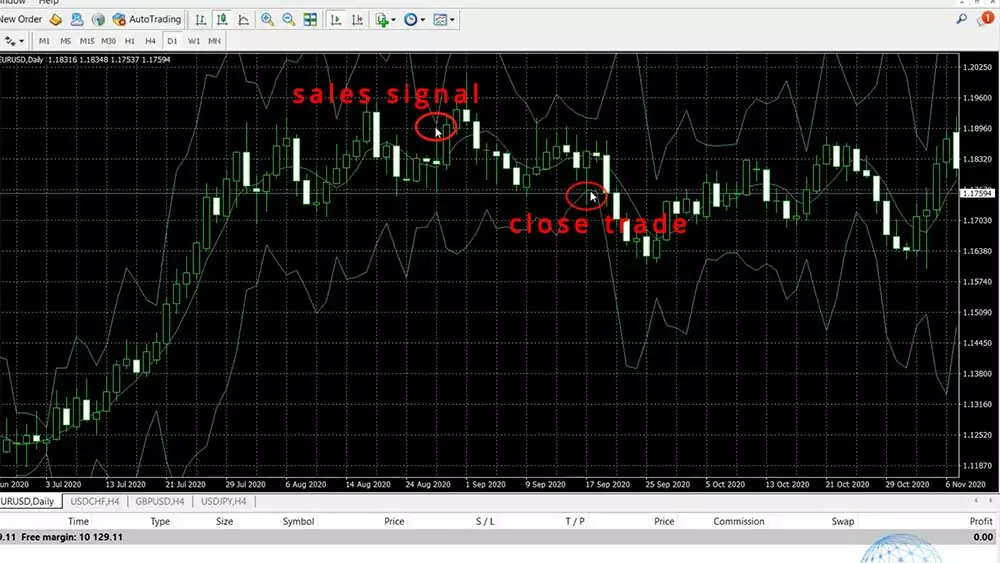
What you can notice as well is that, when the price is going sideways, the Bands are getting closer to the price and when we have an impulsive move, they open and get away from the price.
So this is about Bollinger Band which I took as a random example for the purpose of this lecture where I wanted to show you how to install trading indicators over the MT4 chart. Let me remove it and I will add another Indicator called MACD.
So, the MACD is again a super popular indicator but what I want to show you is that, when we install it on MetaTrader 4, it displays below the chart. It’s not over the chart like the Moving Averages in the Bollinger Bands, it’s below the chart in a separate box with a histogram.
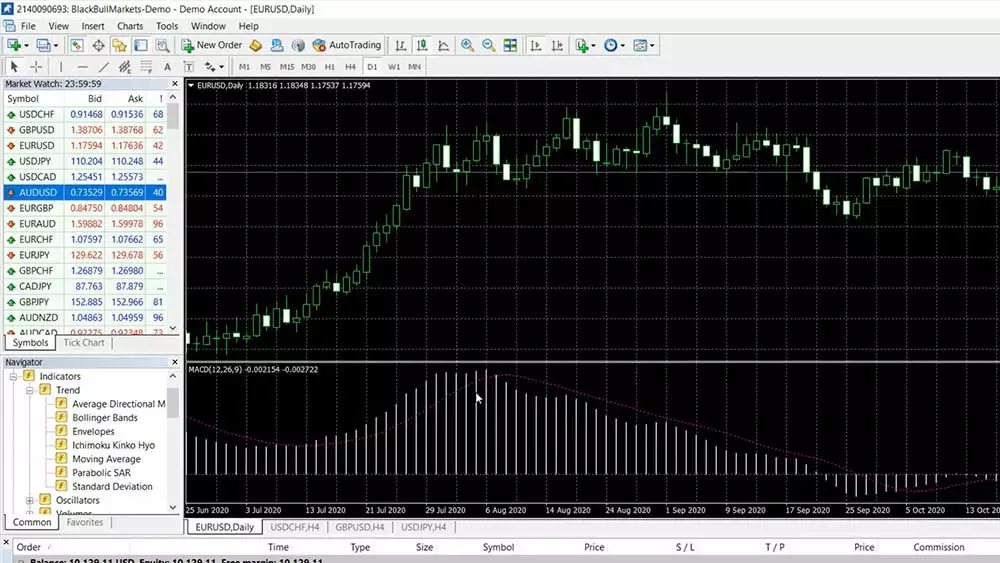
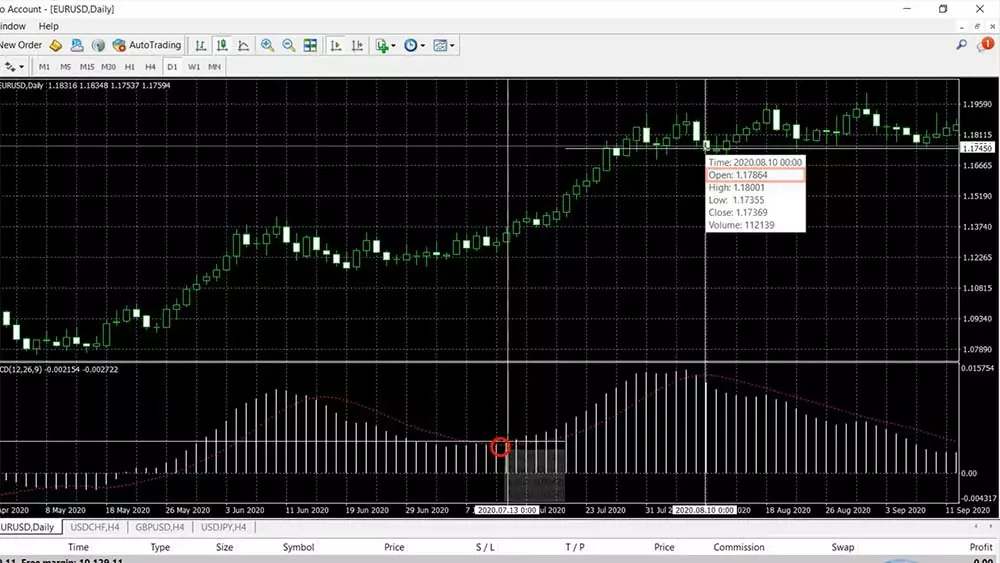
We have three things here, one is this red signal line that goes up and down, then we have the MACD which on MetaTrader 4 is displayed by bars and if you imagine connecting those bars, you will see that there is a line that crosses the signal line downwards, then it crosses the signal line upwards and it gives signals that way.
For example, right over here you, see that the MACD or the bars get above the signal line and they give us a Buy signal right over here. Then when the MACD gets below the signal line, we can close the trade and take profit of over 400 pips in our example.
How to change indicators visualisation
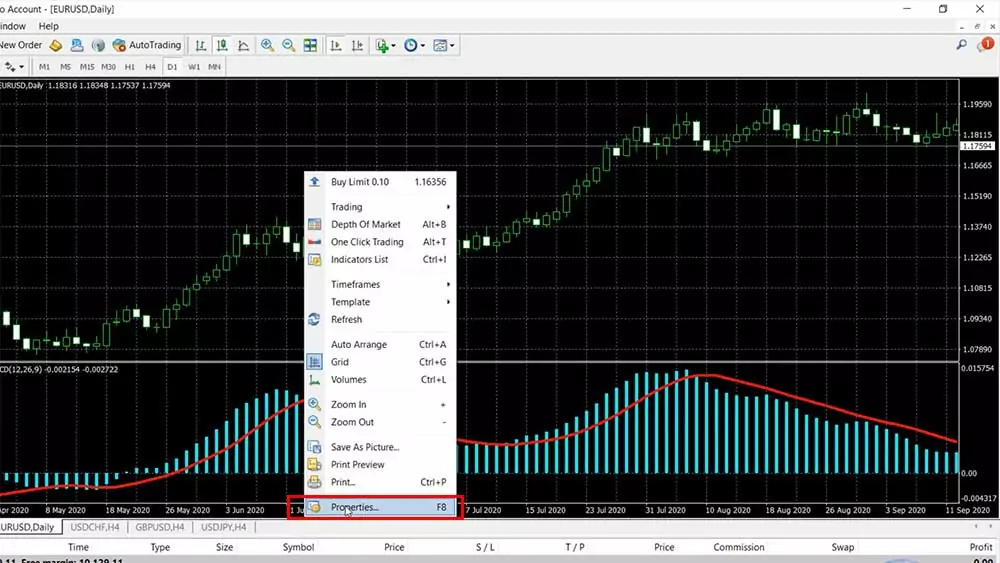
Now, if you want to make it more visual, you can always modify the indicators. You can do it while you install them on MetaTrader 4 platform or you can do that later from the inputs and then click on OK and you will see the difference.
So, how to install MetaTrader 4 indicators to see clearly where the crosses are or where the signal is? Well, that is up to you, it’s a personal choice how you will manage the colors over the chart.
It’s not only the indicators that you can change. If I right-click and go to Properties, I have the option to change the background, I can change the candlesticks, I can remove the grid from behind. Actually, I like to do that so the chart is clearer and I can put more indicators and I see them better.
So do not hesitate to change the colors on the indicators to make them more visual when you install them but be careful not to place too many indicators over the MetaTrader 4 charts because if you put too many, you will see so many lines and indicators over the charts and you’ll be basically hiding the price.
For example, if I put Bollinger Bands and I make them thicker, and then if I insert, let’s say, the Alligator because it has a lot of lines and I want to show it to you, and then if I put, for example, the Envelopes and again I make it thicker and I change the color, for example, to red and if I keep doing that, and if I click on Colors and I change the thickness and I click on OK, you will see more lines over the chart.
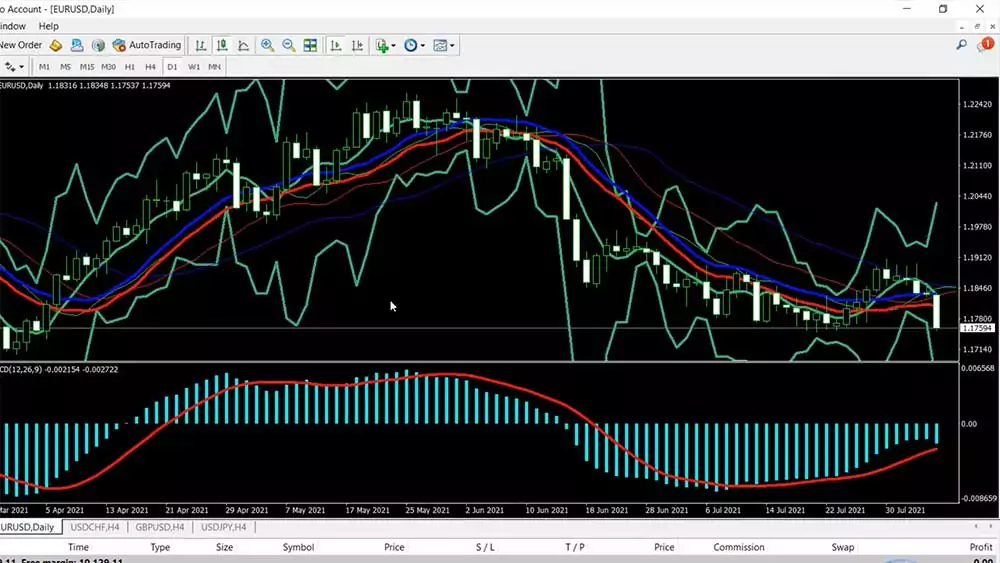
A lot of traders do the mistake to overload their charts with so many indicators and at the end of the day, don’t see the price and from my trading experience, I can tell you that the price is what matters the most.
So when I’m building strategies for Forex trading, I try to keep the rule for 2 entry indicators that confirm each other and 1 exit indicator. No more. Sometimes, I go to 3 and maximum 4 entry Indicators and maximum 2 exit Indicators, but with the time I saw that 2 entry indicators or 2 indicators that confirm each other for me to open a trade and 1 indicator to use as a take profit or as a point where I’m closing the trade work best for me.
So don’t install too many indicators on MetaTrader 4 because it will be harder for you to follow. You can read a lot about all the indicators out there, you will find so many strategies over the internet, so if you want to put them all in one chart probably, you will mess up. Just a few Indicators for a strategy works best and don’t make it too complicated.
Conclusion
So, this is how you can install and use trading indicators on MetaTrader 4 platform. Remember to make it simple, not complicated, it will be easier for you to trade with a few indicators on the chart. If you have any questions about how to install MetaTrader 4 indicators let me know in the comments below. I’ll be super happy to answer you.

