In today’s lecture, I’ll be talking about the coin BitTorrent and what is the realistic price prediction that I’m looking at after investing a small amount into BitTorrent buying it from Binance. And I’ve bought nearly 12,000 coins and I will share with you what is my plan to add some more to improve my average price and what are the realistic targets I’m looking at.
BitTorrent Price Prediction
BitTorrent, the coin that many of us associate with the torrent company and the websites from where we are able to download favorite movies, is quite an interesting coin. If I go to the BTT CoinGecko page, navigate to website, and open the BitTorrent.com BTT website and you will see that it actually is applicable to the speed.
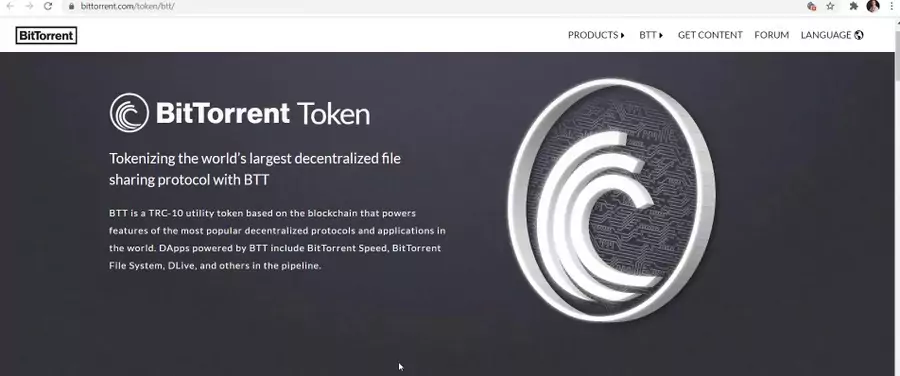
And if I scroll just a little bit lower you will see that with BitTorrent Speed enabled, downloaders will have the option of providing tokens to uploaders in exchange for faster download speed.
And indeed BitTorrent speed is available as a feature of BitTorrent and uTorrent web as well as uTorrent classic and much more. You can read about the BitTorrent coin itself. As well if we look at the community, they have a pretty decent community on Reddit and Twitter. So in the Subreddit BitTorrent, we have just about 6,000 members. And on Twitter, we have nearly half a million followers which is a huge number.
Improving Average BTT price
Half-million followers for a cheap coin that sits at the moment at $0.0027 is a huge number of followers. However, in this lecture, I want to focus on the BTT price prediction and I will tell you what are my realistic targets and where I’m looking to buy some more from the BitTorrent crypto coin.
The first time I have bought BTT, and I will show you my crypto portfolio spreadsheet, is at $0.0088 and I will tell you why I have bought it there. And now I’m looking to buy it a little bit cheaper, so I’ll improve my average price.
So at the moment, I’m looking at the Trading View feature in CoinGecko which is a great option to draw lines, do some price predictions. Now BitTorrent like many others did a great move at the end of May 2021.
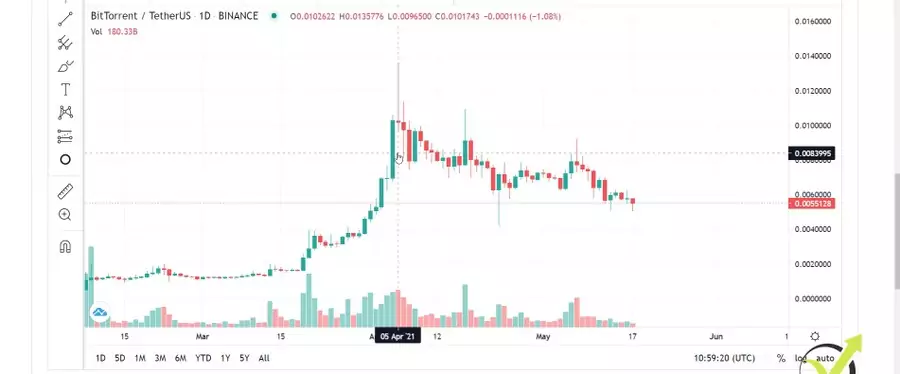
And on the 5th of April, it formed this nearly a doji, or I can say nearly a gravestone doji candlestick which is a reversal pattern.
And it showed that this is it for this month and it went on the negative side and after it did that I started to look for buying opportunities. So I always avoid buying cryptocurrencies that are just going up because we don’t know where the top is. And buying it somewhere on such impulsive candlesticks could be really risky because we might hit just the ad.
Using Fibonacci for the BitTorrent Price Prediction
So what I personally prefer to use are the Fibonaccis, the support, and resistance levels, and the counter-trendlines which I will explain in this lecture. And you will see what are the realistic BTT price predictions that I’m looking at and what are the levels where I’ll be happy to buy some more BitTorrent coins for my crypto portfolio.
If you want to follow all the investments that I currently have you should check out my Patreon page where I have been sharing all of my investments. Every time I buy or sell an asset I send an alert to my followers and you will get as well access to the spreadsheet.
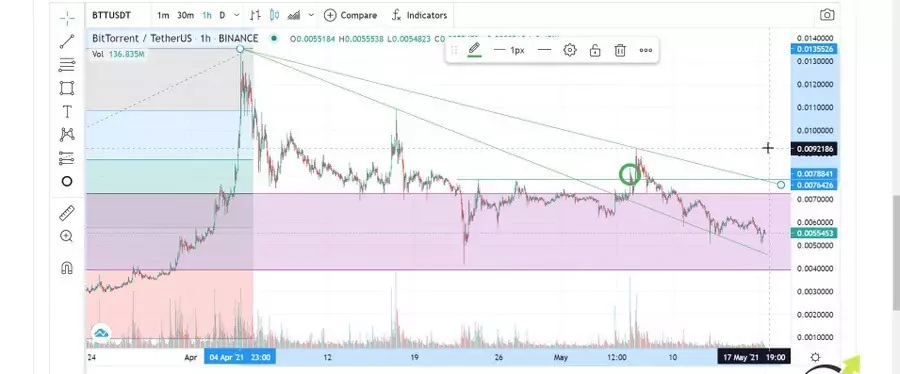
So now going back to the chart I will start a little bit earlier from the beginning of this year. Or if I have to be precise I will start in February 2021 when we had this first impulsive move from BitTorrent in 2 days.
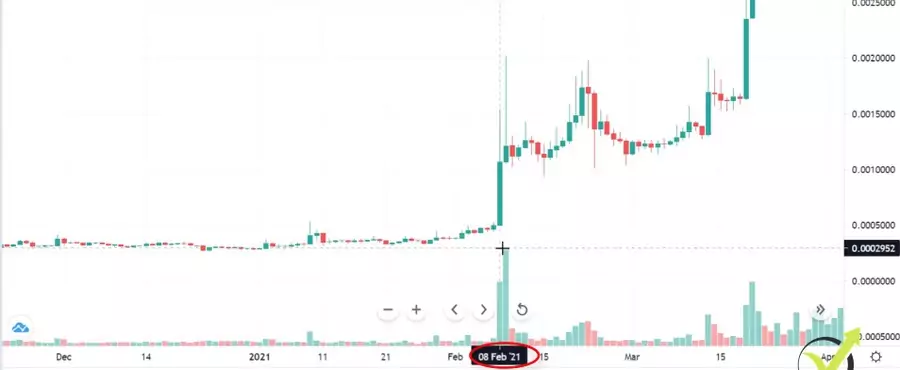
It was on the 8th of February and the 9th of February. So what I usually do, I take a Fibonacci retracement and this is a popular indicator that you might be familiar with, if not, nothing hard. We just draw from 1 point to another. So now I’m taking this impulsive move that we have at the beginning of February 2021 and I’m drawing it from the top to the bottom.
Retracement levels
So it started at this point and this is the top. Now what you see is that there are levels, these are retracement levels which we use to buy the dips. And now here you can see that the BTT price did a retracement just below the 38.2 which is not bad. At this moment the price lost over 50%, actually over 75% of its value and that would be a great opportunity to buy it when the price touched 38.2.
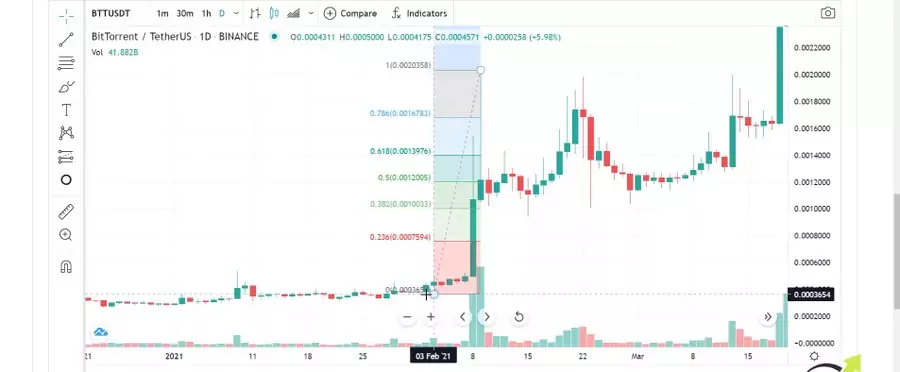
So that’s one move and then we have this retracement zone where we can buy at a cheaper price and after that, chase the targets. So on the top with the Fibonacci we have automatic targets, we have 4 targets and usually, I use the second one of 2.618. And in this case, this target was reached a little bit later at the end of March or at the beginning of April to be precise, yes just on the 1st of April 2021.
And then the price did this awesome move, it reached the top of $0.0135. Now after the price reaches the second target of the Fibonacci, what I do is I take another Fibonacci and I draw it from the top going to the lowest point of the retracement.
I will need to zoom in to see exactly where it was. So right over here is the lowest point after the previous Fibonacci and I will just zoom it and put it exactly where it should be right over here and that’s it.
Counter-trendlines
As well on the top, I will do it precisely so we can see a realistic BitTorrent price prediction after that with the next targets, here it is. I will just zoom and boom, here it is. So now I have the new Fibonacci which shows the recent move which is drawn from the recent move. And you can see that I have new retracement levels. So if I take one rectangle, for example, you will see that before the 50 levels we can have a box locked between 23.6 and the 50 levels.
And that box simply said shows us the levels at which I’ll be happy to buy.
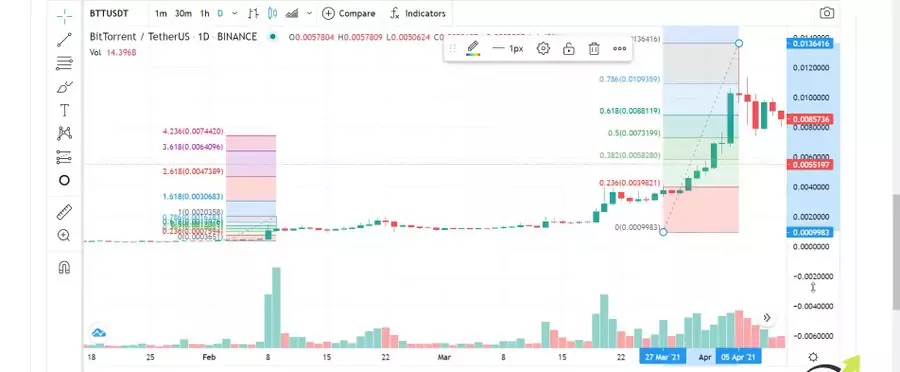
I’m just trying to do it really precisely, here it is. So the price one more time did an amazing move and then it pulled back. So this is called as well retracement and these are the retracement levels at which I’ll be happy to buy anywhere in this box, works great for me. And as I said I bought it at $0.008 and I will tell you why.
I have used the counter-trendline right over there and when the price broke the counter-trendline I started to look for buying opportunities.
So you see that the break was in the box which was a double confirmation for me. But I will go to the hourly chart. I always do this when I want to purchase because I want to see in detail what’s going on inside the day or what’s going on actually on the lower timeframe.
The hourly chart
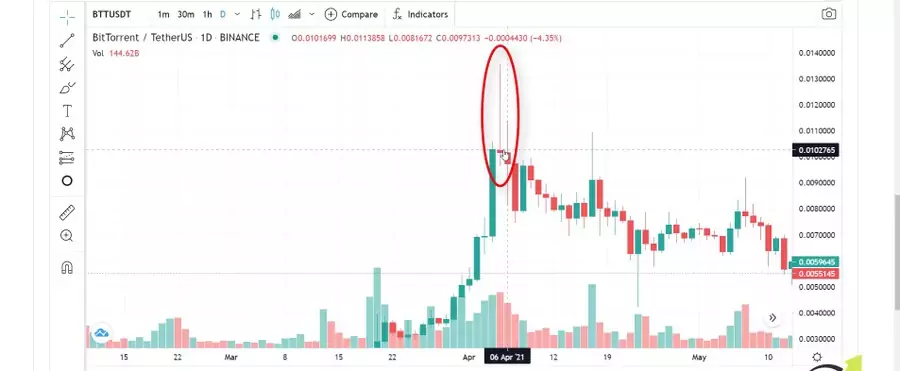
And you see that there was a break inside the box but I wanted to see these 2 highs broken as well.
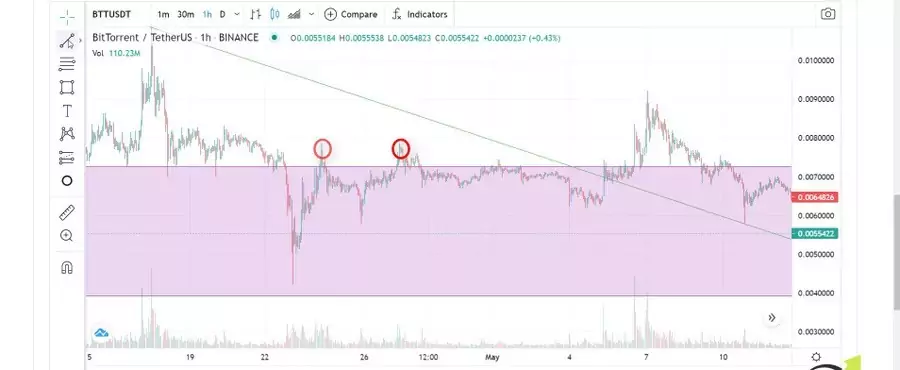
This level for some reason plays an important role because right there the price stopped, it pulled back, then it stopped for the second time. This means that this level which is somewhere at $0.0078 is an important level for the sellers. And in these 2 points, they didn’t want to allow the price to go higher.
So what I wanted to see is the break of this level and I’ve bought right over there. After the price I will put one circle. I’ve bought it right over there the price reached $0.008. I have announced it on my Patreon’s page and as well I have placed it on my cryptocurrency portfolio sheet.
Now after that, the price reached $0.0092 and it continued lower. So now what I’m looking at is to buy it at a cheaper price so I can improve my average price.
And I will just draw the counter-trendline precisely through the top. And after that, we have the new top over there and we can draw another counter-trendline and I will do it right away starting from the top going through this top.
Now you see that I will need to increase a little bit the box and I will increase as well the counter-trendline. So now if the price reaches somewhere to this zone over here and it breaks the counter-trendline this will be great.
Multiple entries
I always aim to buy a second time at a cheaper price than where I bought the first time. So if I go back to my cryptocurrency spreadsheet you will see that some of the assets that I have currently. So these are all the assets that I currently have.
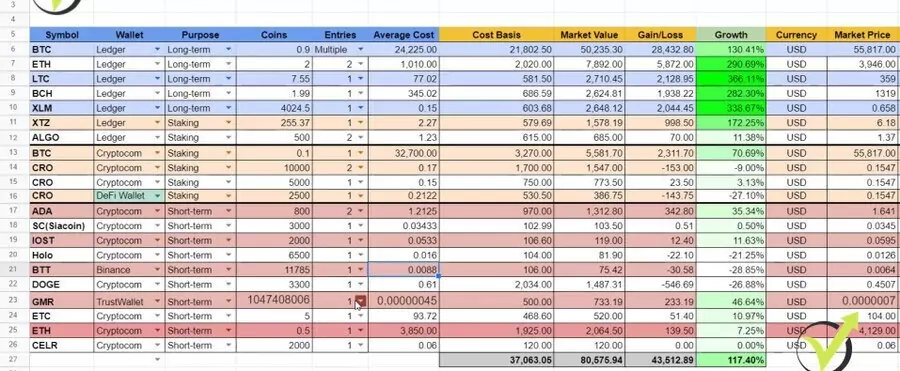
And I have sold many, I have been trading many and on the spreadsheet, I keep only the assets that I am currently holding.
And if you’ve been following my courses, my videos, or my Patreon page you will know that I never sell at a loss. So when I purchase an asset I always aim to take profits or if the price goes against me, like what it did with BitTorrent, I’m looking to buy at a cheaper level so I will improve my average price.
So when the price breaks above I will have more profits compared to if I have bought all, so this is the idea of averaging the price. And this is why on some of my investments you will see 2-3 or even multiple entries.
Aggressive Counter Trendline
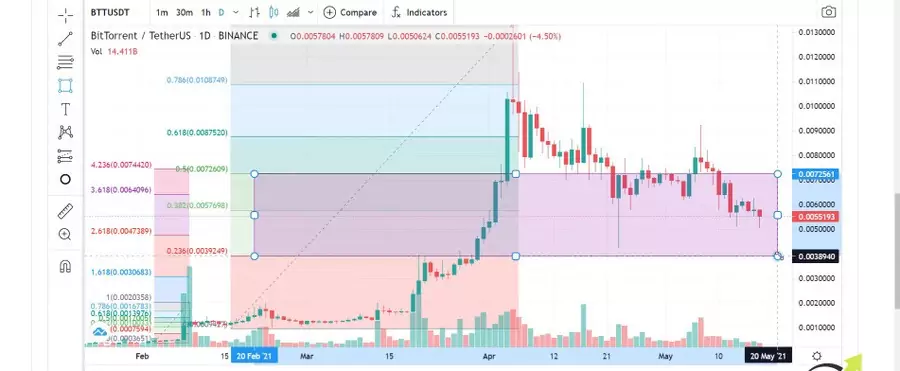
And one more thing I want to show you is the aggressive counter-trendline. This I draw from the recent high using a lower high like that one. So this is for the more aggressive players which prefer to buy the dips.
But now I’m really looking at this aggressive counter-trendline to add some more BitTorrents into my portfolio. Because you can see that the price stopped twice at this support level which I will put precisely right over here at the level of point $0.0050.
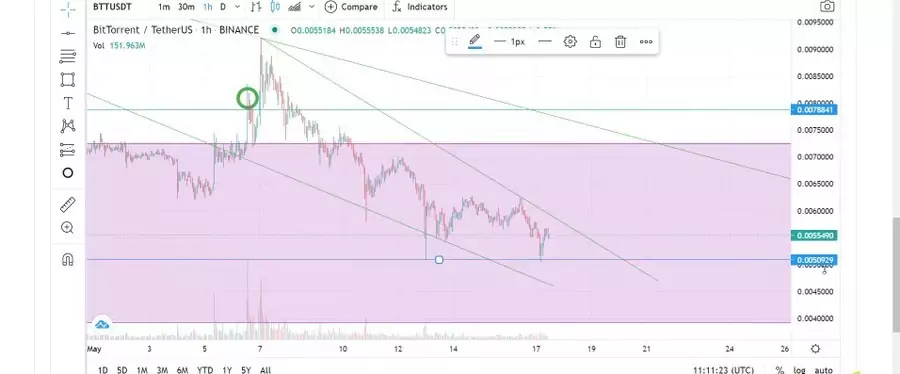
Probably it’s accepted as a round number in Trading View. So always remember that the 5, the 10 is accepted as a round number. So the buyers didn’t allow 2 times the price to drop below $0.0050 or this is half of a cent.
And previously on this dip over there, if I zoom it, you will see that the candlestick failed to close below that level. After that with this candlestick, it bounced again and now 2 times the price fails to go below that level which makes it important. And now if the price breaks the counter-trendline I might add to my portfolio some more BitTorrents which will give me a price of about $0.006.
So if the price does something like that in the next hours or days I’ll be happy buying it somewhere at $0.0060. And I will have an average price of about $0.007, of course, if I buy the same quantity.
So this is how I’m usually using the counter-trendlines combined with the Fibonacci, so I will put this green circle in here. And one more time I’ll be happy buying some more BitTorrents and these levels if the price breaks the aggressive counter-trendline.
My Prediction for BitTorrent Price
Now I use the Fibonacci to give me the retracement levels and the zone where I’m comfortable purchasing. But as well what is important is that the Fibonacci gives us targets or realistic price at which I’m super happy selling my coins. So if I zoom out the chart you will see that with the last Fibonacci I have 4 targets. One sits at 0.00213, the next one sits at 0.00340, the third target is at 0.00466 and the last one is at 0.0544.
And what I usually use the most is the second target of 2.618. So 2.618 is the value from Fibonacci which is calculated based on the move the price did. And for me with my experience, the most realistic target is the second one, which in this case sits at $0.0340. This would be my realistic price prediction for BitTorrent crypto coin. And why do I say realistic? Because with my experience I saw that the second target works best in most of the cases.
For example, Ethereum Classic recently did a great move and reached nearly the fourth target but this was rare. Most of the time the second target is reached easier and what I do after that simply when the price reaches the second target I draw a new Fibonacci. And then I’m looking for the new retracements, I’m buying it cheaper, selling it higher and this way I always buy the dips and I sell the record highs.
Conclusion
And this is what brought me a lot of profits in 2020 and 2021. Hopefully, the market will continue to be bullish in the next months. Even if Elon Musk keeps posting now negatively about Bitcoin and the crypto world, even he was so positive in the last months. But I will not go into there. In this lecture, I wanted to show you my realistic price prediction for the BitTorrent crypto coin and where I’m looking to buy some more.
One more time, I’m looking to buy at the level of $0.006 and I’m looking to sell it at $0.0340.
Of course, if this happens in the near future, if not I’ll be patient and I will be looking for buying opportunities if the price drops lower so I can have a better average price. And if you don’t want to miss my crypto signals check out my Patreon’s page, this is where you will get access as well to my cryptocurrency portfolio spreadsheet.
And if you have any questions let me know in the comments below. I will be super happy to see what is your price prediction for BitTorrent in the comments below. Take care, bye.