
Siacoin price prediction
Today I will have a look at Siacoin and I will do a realistic price prediction based on technical analysis and what we’ve seen so far in 2021 with that altcoin.
So Siacoin did a fantastic move and for the past year, it did more than 2100%.

But if I put the mouse at the beginning of this year, on the 2nd of January, you will see that the lowest price was $0.0032. And if I put the mouse on the 17th of April, which was about a few weeks ago, you will see that the highest price is $0.064.
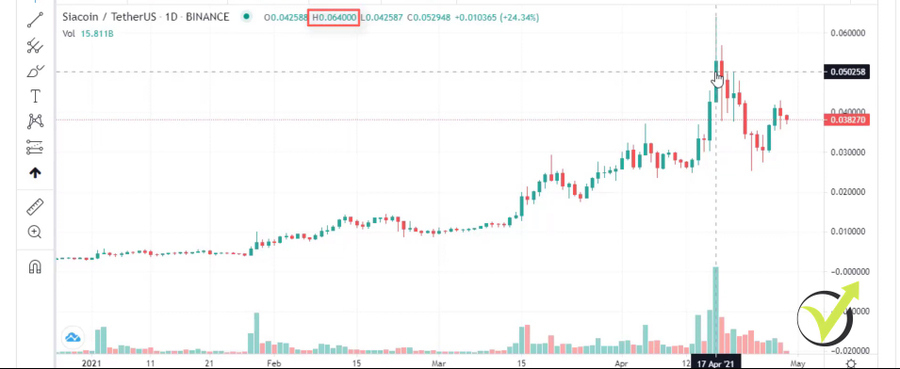
This means that for less than 4 months, the Siacoin did already 2000%. And that’s quite a good investment. If you have invested $1,000 at the beginning of the year, on the 17th, this $1,000 would be $20,000.
However, after that, the price made a significant drop down to $0.025 and this is one of my main concerns. However, I did my first investment using that pullback but before continuing with the technical analysis that I will show you in this lecture, I would like to give you a brief idea about Siacoin and what’s the idea.
What is Siacoin
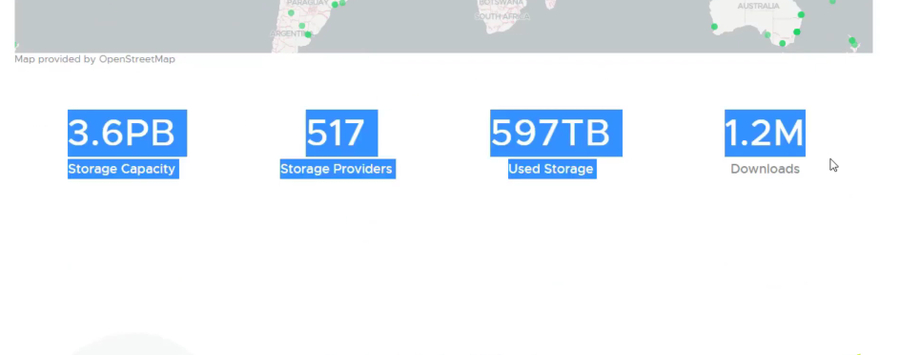
Actually, I love the idea because as you know, storage nowadays becomes a problem, and exactly Sia aims at creating a data storage marketplace.

It’s a leading decentralized cloud storage platform that uses no servers, no trusted third parties. It uses blockchain technology to offer more affordable storage than the traditional cloud storage providers. And on the official website at Sia.tech, you can see where they are at the moment.
And if more people and companies find Sia as a solution, for example, even me as having thousands of videos already in online courses, in YouTube, I have to store all of that and I’m paying Microsoft or Google to use cloud storage that is relatively expensive. And if we have a better and a cheaper option, obviously, I’ll take advantage of that at one moment.
The retracement
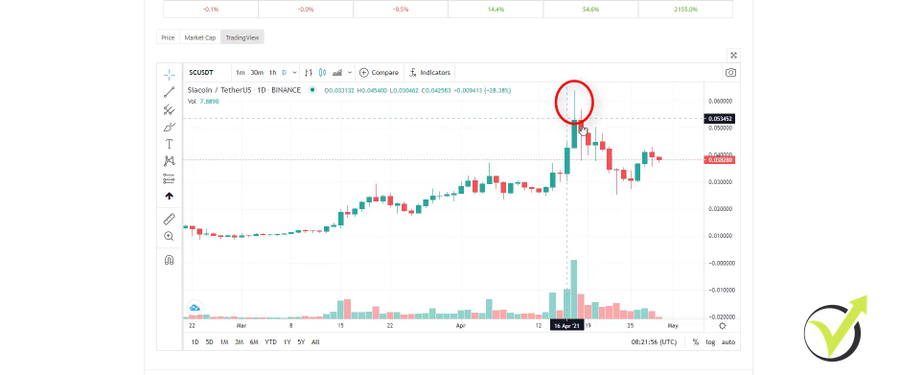
Now, going back to the chart, what I want to show you and what I used to buy my first Siacoins is exactly that retracement. Now, why did I say that this is my concern? Because the price right here was at $0.0635 and it dropped to $0.025. So basically, it lost over 100% of its value.
And if you compare it with Bitcoin, the drop in April was a huge one. Somewhere at $64,000 down to, if we take the lowest point, $47,000. But it’s not 100%.
So when an asset drops with 100%, usually the investors are a bit skeptical because they don’t want to risk especially if they have bought over here.
Another thing is when there is such a huge sell-off, it means that most of the coins are controlled by the whales. And when they take profits, it affects the Siacoin price quite significantly and makes prediction harder.
Now, I would never buy on the top. As you know from my other lectures, if you have watched some of my Cryptocurrency Investment Courses, you know that I’m using counter-trendlines. And this is exactly what I was using in this case as well.

Sia technical analysis
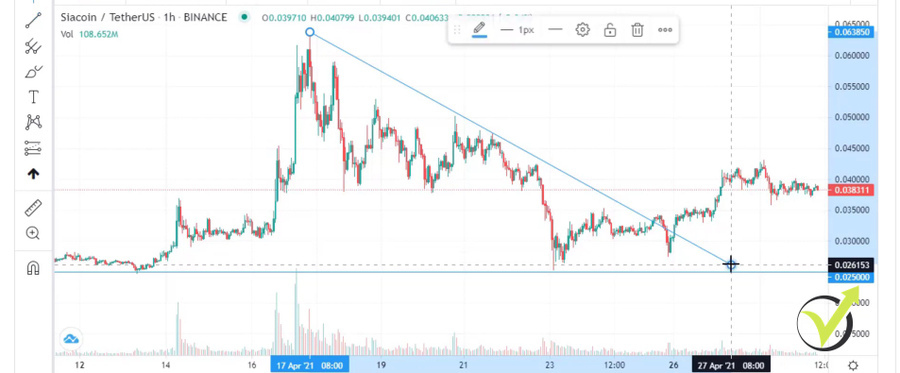
So let me switch to the hourly chart and I will show you where was my entry and what I was looking for when making my Siacoin price prediction. Now, actually, before that, I want to place one line which is the support line we have.
So definitely we have strong support right here where the price stopped. And I will go to the hourly chart to make it actually precisely, it is at $0.025. I’ll just make it precise on that level, here we go.
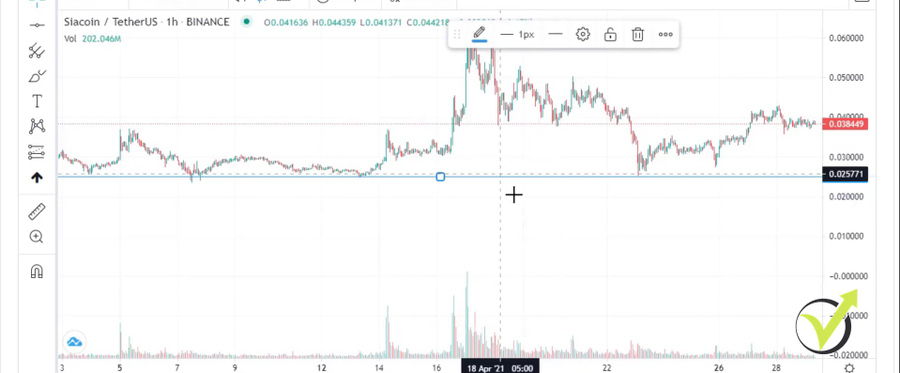
So you see that this level was quite a good support right over here. First on the 3rd of April, then on the 7th, then on the 13th, and then when the Sia price dropped and the second half of April, it stopped again at $0.250.
The support level
So at that moment, I started looking for buying opportunities because I knew that this level is already strong enough.
So the support level, guys, for the beginners, is a level where the buyers get stronger than the sellers and they don’t allow the price to drop below it.
Now, what else I used is a counter-trendline. Why do I call it a counter-trendline? Because I draw it against the main trend and this is how it looks like, here it is.
So probably I should have mentioned that we are still in an uptrend. If we look at the daily chart, even if we had this huge drop, but we still have series of higher highs and higher lows. This high is higher than the previous one, then we have another higher high and then we have another higher high.
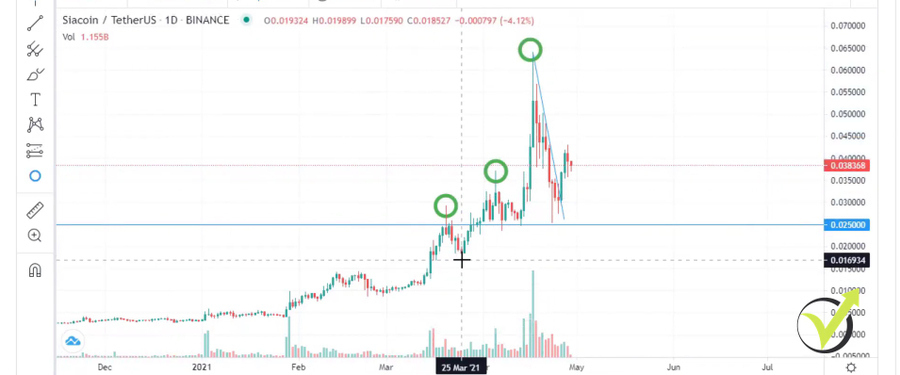
And then we have higher lows, so this low is higher than that one.
As well, this low is higher than that one and again this low is higher than that one. And why is this level of $0.025 important? Because it didn’t form a lower low. Basically, it kept the uptrend because this is higher than that one. And this means that we are still on an uptrend.
The counter-trendline
Now, let me switch back to the hourly chart, now these circles won’t be in the exact place.
Basically, what I wanted to show is that we are in an uptrend and we are in such an uptrend because the next low is slightly higher than the previous one.
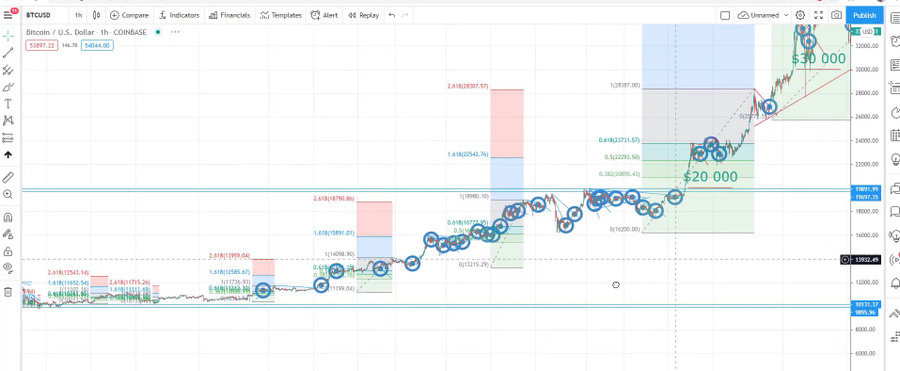
Now, the counter-trendline allows me to find good entry points. And if I switch back to the Bitcoin chart, you will see many points that I have used along the way to purchase, not just Bitcoin but many other coins.
But of course, I’m always looking at the Bitcoin first. Is it bullish? Is it bearish?
And the counter-trendlines simply made my profit last year and this year as well. So going back to the Siacoin price prediction, my counter-trendline looked like that. What we had here, this was the break but after that, we had a significant drop and then the price recovered.
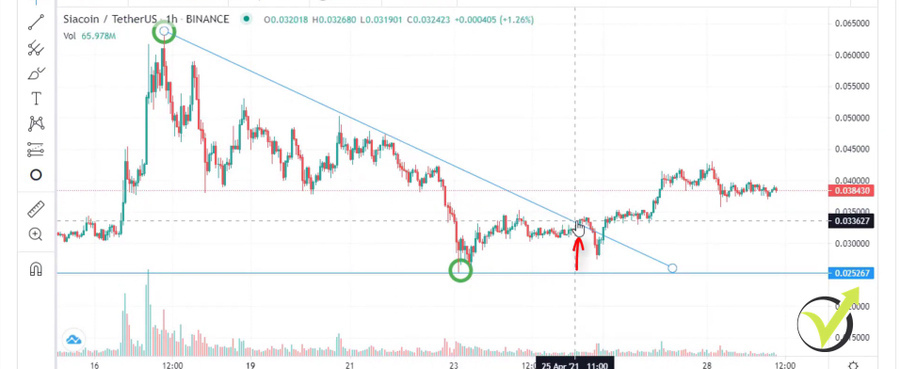
Now, at that moment, I will just zoom it in and I want to show you why I didn’t buy here. I waited for this high to be reached.
On the hourly chart, I want to see a new uptrend forming. So we have this low and we have a new high, which is lower than the previous highs. But then the price formed another higher low and I was waiting for my prediction for the Siacoin price to break this high over here. And it did it just at this candle, not an impulsive break but it was a break and already I had a new uptrend on the hourly chart.
Check out my Patreon’s page for my Cryptocurrency portfolio spreadsheet
But the very same candlestick pulled back and I took the trade somewhere below. Just I used the retracement and I was waiting for this aggressive move. So my price, if I show you my cryptocurrency portfolio for the Siacoin is $0.03433, that one over here.
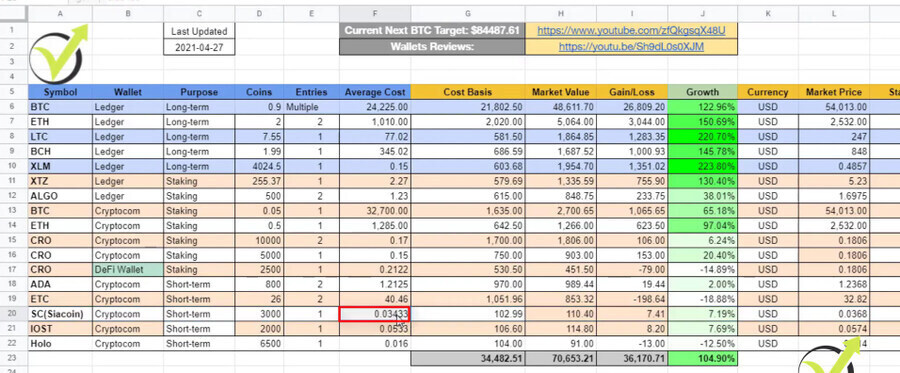
And this is my cryptocurrency portfolio spreadsheet that you can find available on my Patreon’s page. If you want to have a look at it, I will put a link here. And as well, there I give the signals when I’m buying and selling cryptocurrencies.
So, yes my price was somewhere right over here at these candlesticks. After that, we had an impulsive break upwards. Now, the price is just going sideways but you see that it retested this level so already that’s another important level that we have here at about $0.0355.
Now, I have bought here, and if you paid attention to my spreadsheet you will see that I have bought just 3,000 Siacoins. 3,000 is a huge number but that was an investment of about just €100. Because first of all, that’s a new system that I’m implementing in my portfolio, buying cheap coins for about €100 and I have nice money management that I will probably share in some of my next lectures.
The Siacoin price prediction
But as well, I keep in mind that there was a 100% drop and there is a huge potential for the price to drop even lower. So if it drops lower, I will be looking for new buying opportunities to average the price, so that’s why I have bought just $400.
Now, what is my Siacoin price prediction, guys? I know you’re waiting for that but I wanted to show you exactly what I’m looking at, how I’m analyzing the charts very simply so you can do it as well.
Now, for the Siacoin price prediction, because we don’t have anything else above that and as well for the coins that did great in 2017 I don’t consider these levels as important. Right after Bitcoin broke the $20,000, it shows us that what happened in 2017 stays in 2017. We have a new market now and we have new levels.
So what I am looking at right now are the new movements that we have from the coins and how I’m looking at the Siacoin price prediction as I’m using a Fibonacci. And this is the only way we can have potential targets based on what we have until the moment. So how do I do that? I will take the first move which is right over here. Actually, I said that the lowest point was that one, let me just grab it. From the beginning of January, here it is.
My second target was not reached
So what I do, I put a Fibonacci, drawing it from the top of the first move to the bottom of the first move.
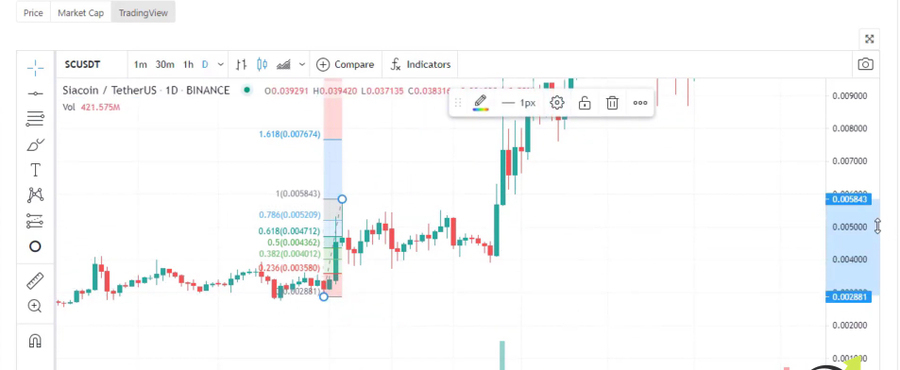
Now, I’m not going to talk about Fibonacci in detail but it has retracements that work very well. But at the same time, it has target. It has like 4 targets at 1.618, then 2.618, 3.618, 4.236. But I’m using the second target, 2.618.
So whenever the Sia price reaches the second target, I take another Fibonacci and I start from the new top after the price reached the second target. So it reached that moment and then I’m taking this high and then I’m drawing it to the lowest retracement, which is right over here in this case. And then we have new targets, the second target right over here.
This means that I have to take a new Fibonacci starting from this top over here, going to the lowest retracement of that move. And then, stay with me here, my second target was not reached.
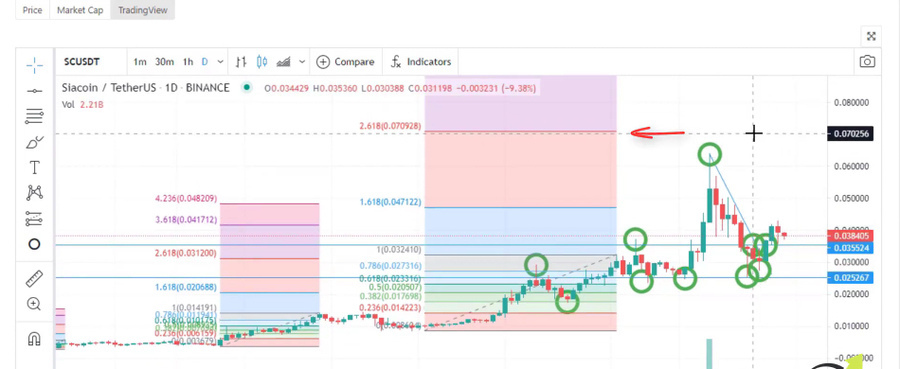
So still my potential target would be at 0.07, that’s my first target for the Siacoin. Now, what happens if the price reaches that level? Of course, it might go sideways, it might drop, it might go higher immediately.
If you want to learn more about technical analysis check out our Cryptocurrency Investment course and learn how to perform analysis by yourself.
But it will reach it eventually at one point, which means that at this time I will do another Fibonacci. Here it is starting from this top or the top that the price will form. And then I will draw it until the lowest retracement which is right over here, this bottom. Which will give me the new target which will be at 0.1480 or so.
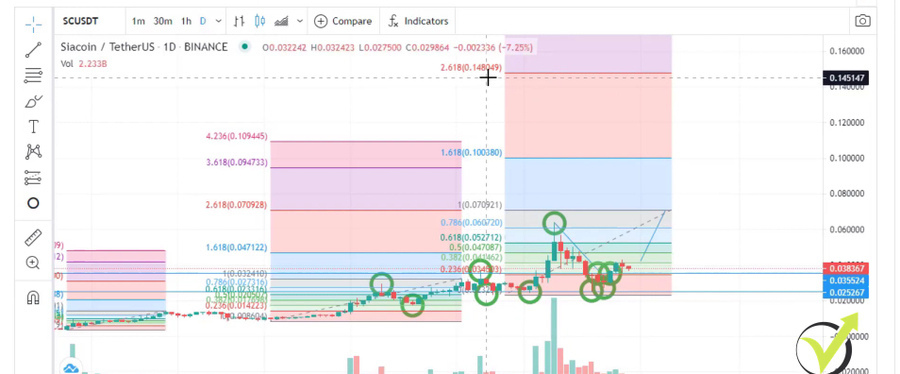
Depends where this top will be because it will change the price.
But it will be in the range of 0.13 to 0.15 or 0.16. So my first target is 0.07 and when the price reaches there, I might take profit. Or I might look for another counter-trendline and target the next one which sits at 0.14, 0.15, maybe 0.16. One more time, depending on where this top will be after breaking this level of 0.07.
Conclusion
Might sound too complicated if you have no experience with technical analysis, check out the Investment Cryptocurrency course where I explain the system in detail. It worked brilliantly for me, guys. I have doubled my portfolio a few times. These are the current assets that I’m holding at the moment with a total value above $70,000 and now I’m looking for the small coins as Sia, as hot to break on new record highs.
But one more time, that’s how I see it. I’ll really appreciate it if you share your realistic Siacoin price prediction in the comments below. I will see you guys in another lecture.