IOST, this is the coin that I’ll be looking at today and I will share with you what is my realistic price prediction and what was my investment with the IOST. And as well, what are the levels that I’m looking to buy some more and the targets where I’ll be happy to sell it.
IOST price prediction
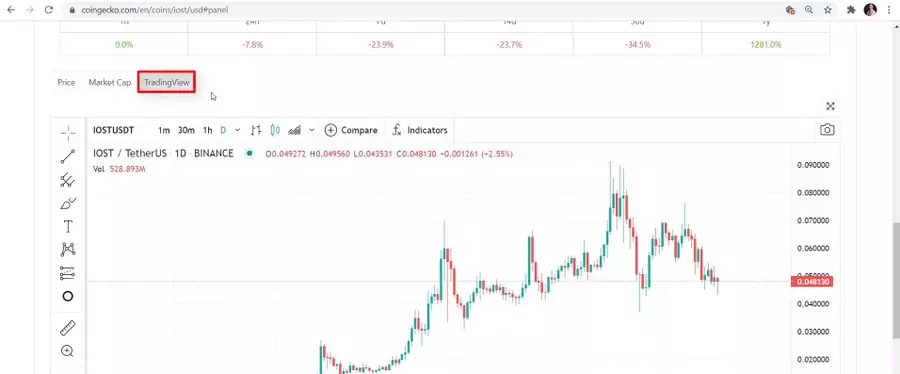
In today’s lecture, I’ll be focusing on IOST as one of the cheap cryptocurrencies that I have added recently to my cryptocurrency portfolio. So if I go to CoinGecko, one of the websites I’ve been using to analyze and choose new cryptocurrencies to invest in and as well they have the TradingView option which enables me to do an accurate price action analysis.
And I’ve been sharing many lectures on how I look at the charts, how I draw trendlines, counter-trendlines, support and resistance levels, Fibonaccis.
I will go through all of that in this lecture and at the end, I will share with you what is my realistic price prediction for the IOST and I will be super happy to hear your thoughts in the comments below.
IOST Community
So before I purchase a cheap cryptocurrency as IOST, I look at a couple of things. First of all, I look at the community. So IOST has a decent community on Reddit as well on Twitter, Facebook, and Telegram.
But, for example, on Reddit, they have over 50,000 followers. And on Twitter, they have nearly 250,000 followers by the time I’m creating this lecture. And if I go to the official website at iost.io, you will see that it’s really a professional website that says, “Unleashing the power of blockchain.”

The thing I liked about the IOST is that it is a next-generation crypto algorithm
that is based on Proof of Believability.
Impulsive move
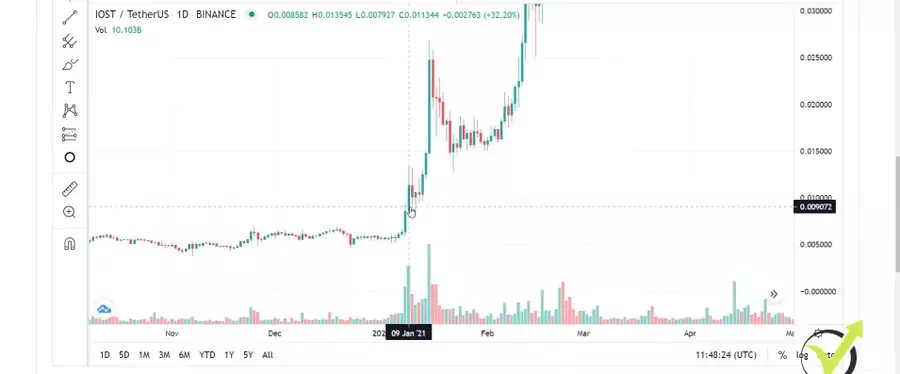
And I’m not going into details about the IOST, you can go around the website or you can go around the social network they already have and learn more about it. What I want to focus on is the IOST price prediction based on what we have seen since the beginning of 2021. This is when I have noticed IOST after this impulsive breaks that it did together with many other small coins. But we can see that the first impulsive move was this one over here, right at the beginning of January 2021.
So what I usually do to analyze the cryptocurrencies and see where they might reach, I go to one indicator called Fibonacci. I have shown how to draw it in many of my price prediction lectures. I will do it briefly in this lecture as well so if you are new you will learn how to use Fibonacci. At Trading Academy we aim to educate the people, not that much to speculate on the market and make profits from our lectures but we aim at pure education.
Retracement levels
So what I do, I draw a Fibonacci starting from the first impulsive move which was this one over here. I will take the top and I will draw Fibonacci to the lowest point.

So this was the first impulsive move if you look at the daily chart starting at the beginning of 2021. And then what you see is that we have some levels with Fibonacci, if you are a beginner you will see that there are retracement levels.
So this is the move, automatically it displays 5 levels and these are retracement levels. And you can see that after that the price did a retracement exactly to the 0.382 level which I use the most. So this way you can buy the dip after an impulsive move. What’s more with the Fibonacci is that we have 4 targets on the top and I usually use the second one which sits at 2.618, in this case, it is at 2 cents and 78.
And after the price reaches the level, what I do is I take another Fibonacci and I draw it down to the lowest retracement which in this case was this one over here.
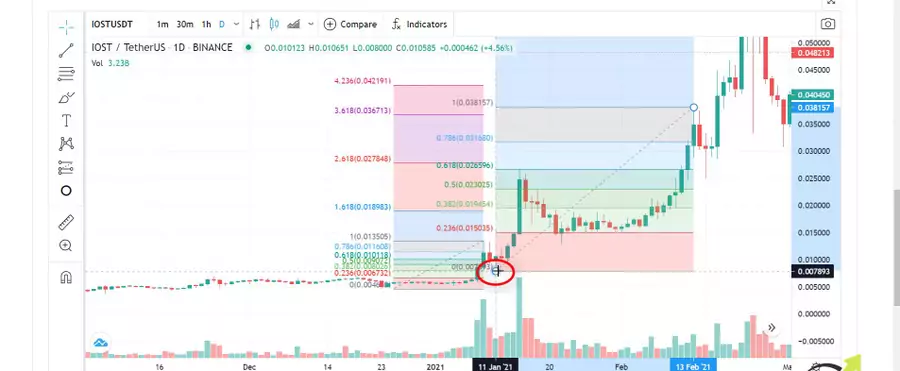
And then again I will have new retracement levels with new targets. And in this case, the price reached perfectly the second target.
The second target
And as I have mentioned in many of my lectures, I use the most the second target because with my experience I noticed that it is just super easy for the price to reach and this is how I usually take profits and then I’m looking for the retracements to buy the dips.
In this case, the IOST price reached this level, the second target of the Fibonacci and I take a new Fib and I draw it to the lowest point, which is this one over here, which is the bottom of this candlestick.
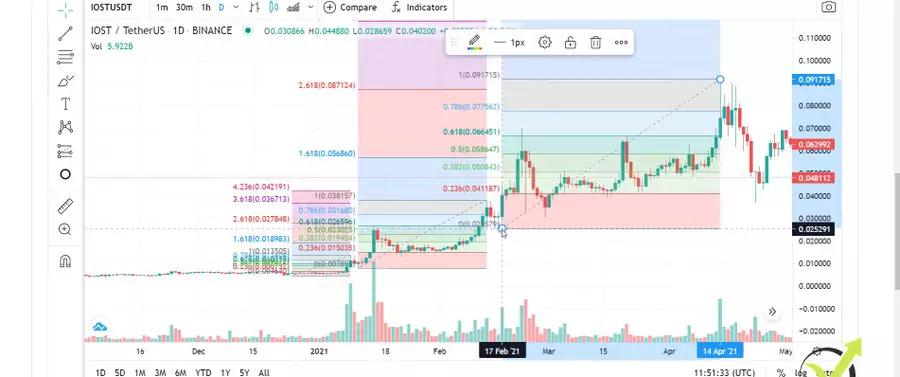
And then what I have is new retracement levels with new targets. And the new targets that I have. But let me just draw it precisely so I will give you an exact value for the new targets and that would be my IOST price prediction. And I say always this is our realistic price predictions, I don’t want to say in my lectures that this coin will reach $10 or $50 or $100 and it will be another clickbait lecture rather than give you a realistic idea of where the price can reach in the short term or eventually in the next months.
Depends on where the Bitcoin, of course, will go after some negative tweets from Elon Musk that forced many investors to sell their cryptocurrencies. However, I didn’t do that. I stick to my technical analysis and I’m not driven by emotions and by tweets that are super speculative. So my new targets with the IOST is $0.1982 or we can say $0.2 or this is 20 cents.
When ot buy IOST
So my next target is the 20 cents right over here and you can see where the third and the fourth target reaches to 30 cents.
But one more time, I prefer to use the second target and then when the price does another move, I usually do another Fibonacci from the new top.
Let’s say it will be right here and then I’m looking for the new retracement levels, I’m buying the dip and I’m looking for the new tops.
But this was a hypothetic Fibonacci that I would be looking at. Now I’m looking at the current Fibonacci which was formed based on the moves that we already had. And you can see on my cryptocurrency portfolio spreadsheet that I have bought the IOST at $0.0533.
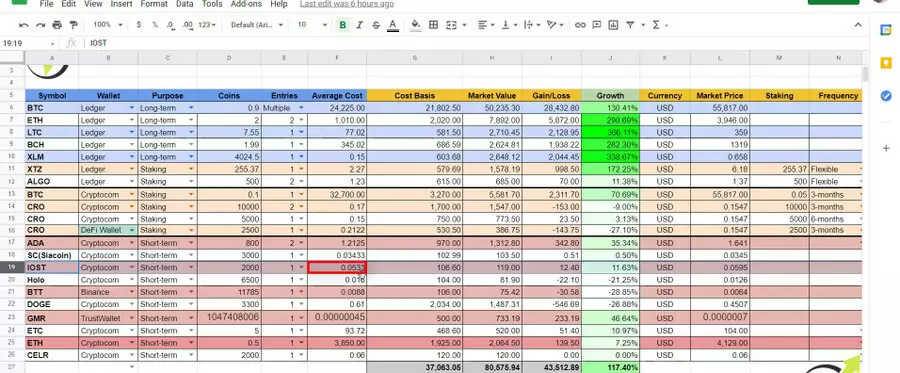
So on my spreadsheet that I share on my Patreon’s page, this is where as well I share my cryptocurrency investments, I give crypto buy and sell alerts. So you’ll see by the time if you are happy with my signals or not. And if I focus on the IOST investment, I have bought 2,000 small $100 investment.
Counter-trendlines
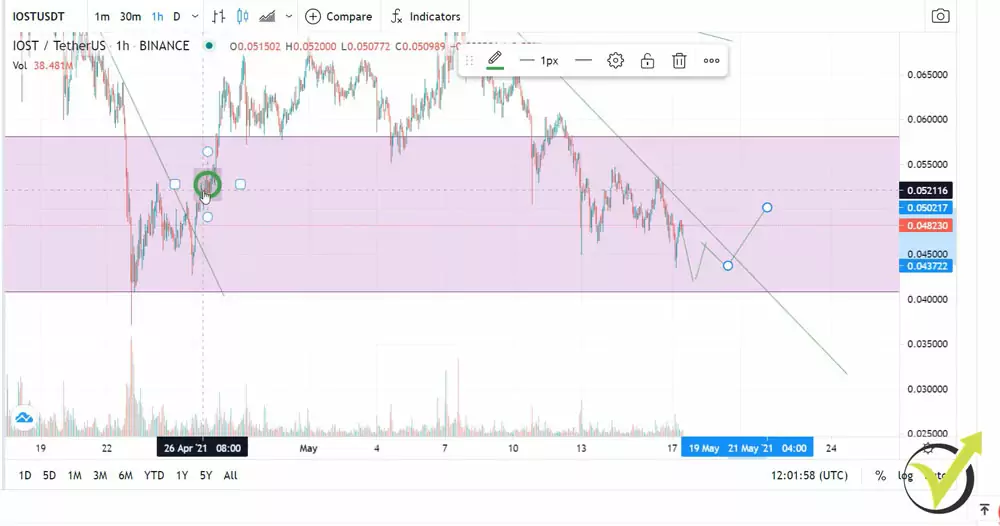
And my average price was at $0.0533 and I remember very clearly when I have bought it, it was right on the 26th of April. Let me confirm it. So go back to Patreon and yes, on the 26th of April I said that I have bought the IOST. And it was on this impulsive move over here. You can see that we had these 2 doji formations, and I will just go down to the hourly chart so I can see in details what happened in there.
Usually, I use the counter-trendlines. Let me fix the Fibonacci exactly on the top, so usually, I use counter-trendlines and more aggressive counter-trendlines for the IOST future price prediction. So here it is and then we had another one right over here.
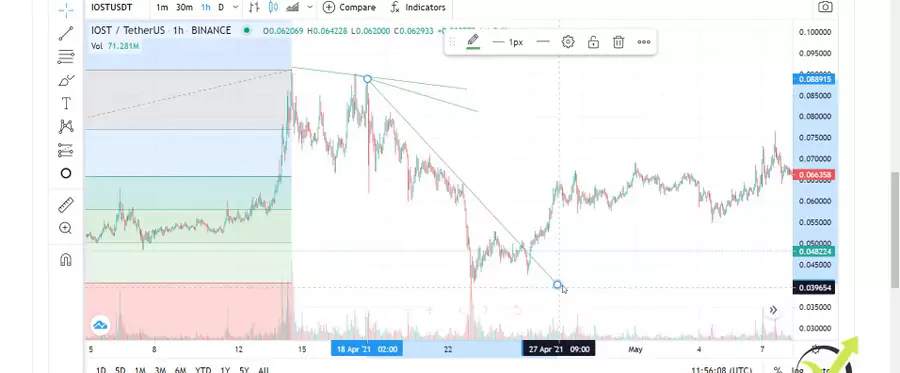
This is what I have used and usually, I’m looking for the break of the counter-trendline and I always want to see a break of the recent high.
So after the IOST price broke that high which is at $0.0533 and as I said my average price was at $0.0533, you can see it matches perfectly. This is when I enter into the trade. So right here I had three confirmations. I had these doji formations on the daily chart, let me find it quickly. So right over here we had that doji and then another negative one and then another doji.
Doji formations
So basically, 2 doji formations are quite significant and usually, they show a reversal. So the price drops and they show that there might be a reversal.
Then I went down to the hourly chart and I had my counter-trendline coming from the top and for the counter-trendlines, I explained the system in detail in my Cryptocurrency Investment Strategy course.
And then I was looking for this top to be broken because when the price broke it we had a new uptrend on the hourly chart. Because if you know what the uptrend is, its definition is a series of higher highs and higher lows.
So to see a new uptrend, we had to see a break of this level which is exactly at $0.0530 and I have bought it somewhere over here. After that, what happened is the price went a little bit higher it reached to $0.0764 and then it went downwards, it’s just below my price. Now, if I increase the counter-trendlines you will see that now I have the opportunity to draw another counter-trendline starting from that top and going through the recent highs on hourly chart.
New opportunity
So if the price breaks, I might add some more to my portfolio as well what I’m using are the retracement levels from the Fibonacci. So my last Fibonacci right over here as I said shows me the levels at which I’d be happy to buy. Usually, I draw a rectangle that is locked between the $0.50 and the $0.236.
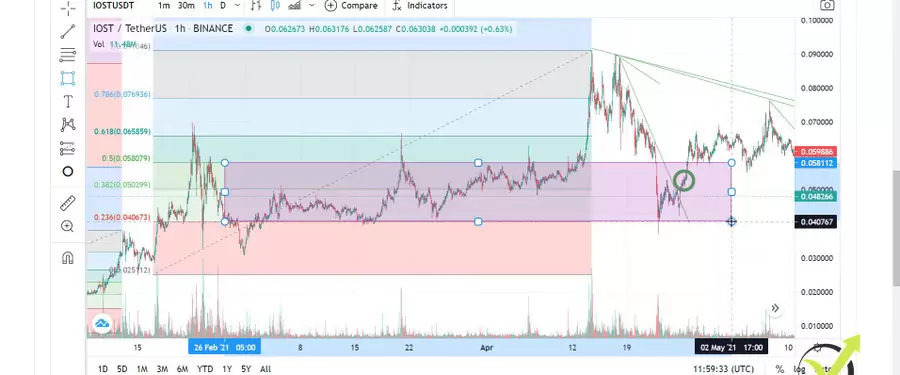
So these 2 levels usually form a zone at which I’m comfortable buying it. This Fibonacci, one more time for the beginners, it came after the impulsive move.
And after that, these levels are zones at which I am comfortable buying it so you see that the price retraced to that zone exactly. If I increase it, you will see that I have bought within the box and now gained the prices within the box. So usually, when the price goes above I’m not buying anything else. I don’t want to add to the position when I’m on profit.
I would only add to the position if I have the confirmations, if I have some reversal patterns, if I have a break from the counter-trendline and if the price is in this box, which one more time comes from the retracement levels of the Fibonacci. Hope that’s not too complicated.
If you’re keen to learn more about price action trading go ahead and check out the Cryptocurrency Investment Strategy course that I’ve mentioned above. Or just follow along our videos on YouTube, make sure to subscribe to the channel. And I often explain the system in the price prediction lectures for the different assets that I have in my cryptocurrency portfolio.
Counter-trendline break
And right now I have this counter-trendline, I will just draw it precisely, here it is.
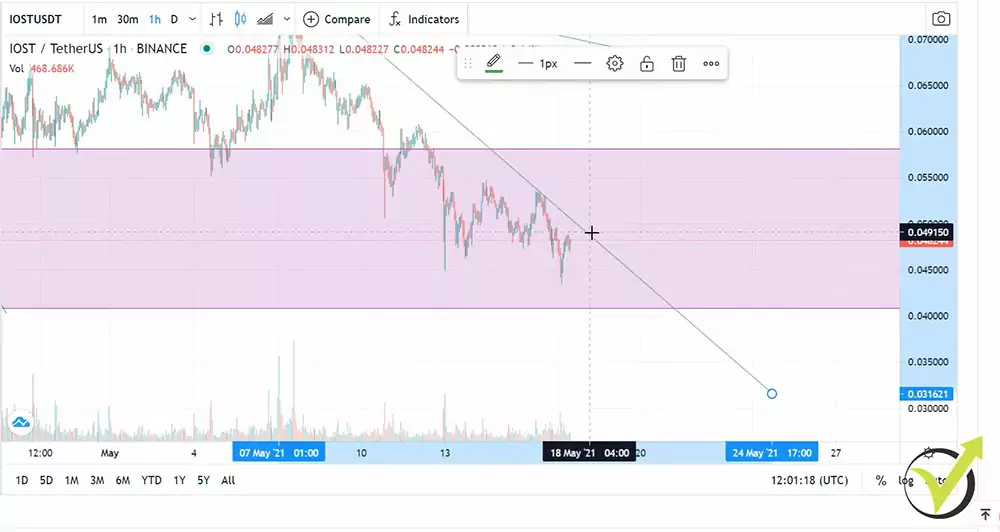
Why call it counter-trendline? Because it’s against the major trend which is still upwards and if the price breaks the counter-trendline within the box then I’m happy buying it. So ideally, I want to see the price going a little bit lower, then what I’m looking at is to form a higher low, right this way. And then I want to see the break.
So first, I will zoom it more. First, I want to see a higher low than the previous one. Just like what happened in April 2021.
You see that there was a higher low than that one. I’m in the box and I have the break of the counter-trendline. So right here I want to see as well a break of the counter-trendline in the box with a higher low than the previous one. Or if it happens in the next hours, it might look like that. I have already a low and if the price forms a new higher low than that one and it breaks the counter-trendline, I’ll be happy buying somewhere in this level.
And if I have a higher high than that one, so at the levels of $0.05, I’ll be happy adding some more IOST coins into my portfolio.
Look for multiple confirmations
So this is what I’m usually looking at, I’m looking for confirmations from a few things, not just one indicator or one line or one moving average. Depends what you’re using. If you are using a couple of things make sure they confirm each other before you are investing.
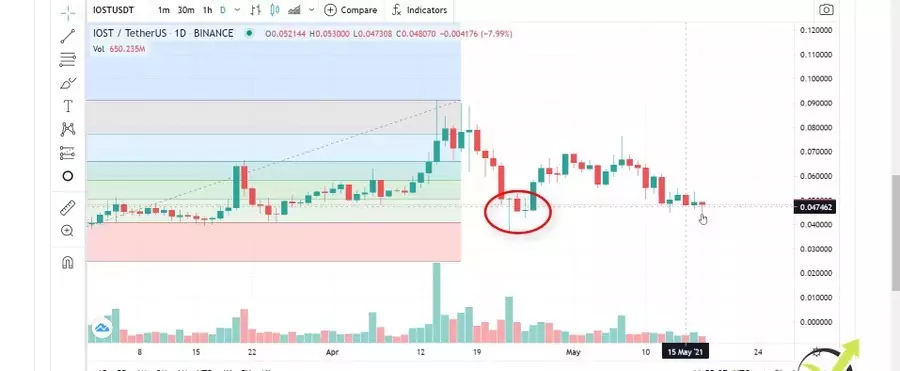
And of course, if the price drops lower then I’ll need to be patient and I’ll be looking for new buying opportunities at the lower level so I can improve my average price. But for the moment, until we are above that level of $0.0420, we are still in an uptrend. Now, if I switch to daily chart, you will see that if the price breaks this level and it goes below, we will be in a downtrend.
Just like what the Bitcoin is at the moment, it’s already in a downtrend after the recent negative tweets that we had from Elon Musk.
But for the IOST, if the price remains above that level over here, then we are still an uptrend and I’m looking to buy some more for my portfolio. If the price drops lower then I’ll just pause it, I will look for a new uptrend to be formed on a daily chart and then I’ll add to my portfolio.
Strategy
And one more time, the target or the price prediction that I have where I’ll be happy selling the IOST tokens is at $0.20. This is where I’ll be happy selling it and if the price does something like that, reaches the second level and then I’ll be looking for the new retracement, the new drops, I will have a new Fibonacci and I’ll be buying it cheap.
So this is my strategy. I always sell the new record highs with the Fibonacci targets and I’m looking for the retracements to buy the dips. And this is how I succeeded to achieve some great profits in 2020 and in 2021.
And one more time, in my portfolio spreadsheet you can find only the assets that I’m currently holding. So many of those I have sold and if you’ve been following me on Patreon, you know what exactly I have done. I’m super honest with my investments, I am very happy when my followers are making profits as well. I will do my best to keep it up.
So if you want to follow along, make sure to check out my Patreon’s page or subscribe to our YouTube channel so you’ll know what exactly are the levels I’m looking at and what are the realistic price predictions for the different assets. I’ll be happy to hear your thoughts in the comments below about the IOST price prediction in 2021, 2023, or even 2025, and as well what are the levels where you are comfortable buying it.
I will see you guys in the next lecture. Take care and enjoy investing on the cryptocurrency market.