-
General Questions
-
Robots
-
- What is the difference between EA Trading Academy's free and premium robots
- Which broker should I use to trade the Robots?
- Do I need a VPS to trade with Robots?
- Can I use Robots on cryptocurrency exchanges?
- How to trade with many EAs in the US? (FIFO solutions)
- I placed the EAs over the charts, but no trades are opening
- Is it possible to trade cryptocurrencies with Robots?
- Why do my trades not match on Demo and Live accounts with the same EAs?
- Why do some of the EAs in the courses not have SL and TP?
- Do the EAs have money management integrated?
- What returns should I expect from the robots
- Can I use Grid EA (like Waka Waka) on Prop Firms?
- Can you pass a challenge for me and manage my Funded account with the FTMO EA?
-
-
- Articles coming soon
-
- Articles coming soon
-
- Articles coming soon
-
- Articles coming soon
-
- Articles coming soon
-
- Articles coming soon
-
- Articles coming soon
-
-
- Articles coming soon
-
- Articles coming soon
-
- Articles coming soon
-
- Articles coming soon
-
-
-
- Articles coming soon
-
- Articles coming soon
-
-
Strategy Builders
- What are the main differences between EA Studio and FSB Pro?
- Is there a difference between the trial period and the license?
- Why is the backtest on EA Studio/FSB Pro different from the backtest in MetaTrader?
- Can I use Custom indicators on EA Studio or FSB Pro?
- What are the limitations of the EAs during the free trial?
-
-
- Articles coming soon
-
- Data Source Settings
- Fetch Settings
- Collection Settings
- Parameters and Settings
- Data Horizon
- Backtester Settings
- How to avoid overfitting?
-
- Articles coming soon
-
- Articles coming soon
-
- Articles coming soon
-
- Articles coming soon
-
- Articles coming soon
-
- Articles coming soon
-
- Articles coming soon
-
Courses
-
Indicators
Strategy Report
0 out of 5 stars
| 5 Stars | 0% | |
| 4 Stars | 0% | |
| 3 Stars | 0% | |
| 2 Stars | 0% | |
| 1 Stars | 0% |
Report Toolbar
When you load an Expert Advisor in the Editor section, the best way to get a deeper insight into its backtest statistics is by going to the Report page.

There you find four main tabs: Stats info, Indicator char, Balance chart, and Journal.
Stats Info

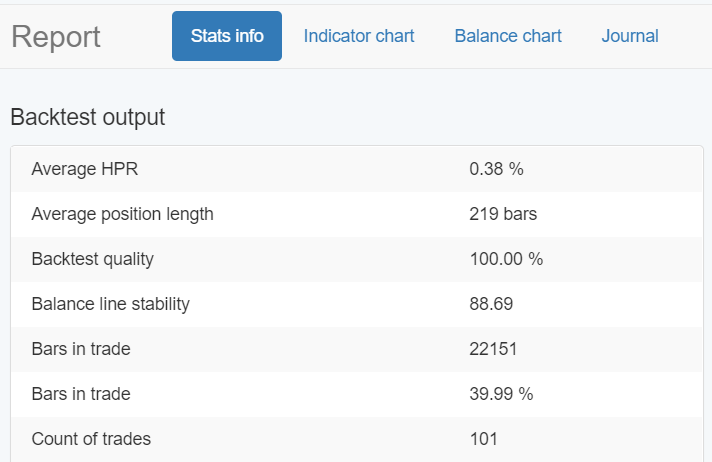
Backtest Output
The Backtest Output panel gives you the values of all the key parameters calculated during the strategy backtest.
- Net balance – this is the equity of the trading account. In other words, the current amount is shown in the account’s currency.
- Max drawdown – it shows you what percentage of your trading account has dropped after having a losing streak. Basically, it’s the difference between the peak and the trough.
For instance, if the balance of your account is $1000, and the amount drops to $900 before going back above $1000, then the drawdown is 10%. - Executed orders – the number of executed trades. You need to be aware that there is a separate count for the opened and the closed trades.
- Profit per day – this is the amount of money that your strategy gains for you.
- Win/loss ratio – you get this result when you divide the number of the winning trades by the total number of trades.
- Sharpe ratio – its role is to measure the risk-adjusted return. When its value is high this means that the Expert Advisor is very good.
- Average HPR – it represents the average return (in percentage) that you get when you hold an asset or a portfolio of assets over a period of time.
- Profit factor – you get the value of this parameter when you divide the gross profit by the gross loss.
- System Quality number – this is the Van Tharp’s SQN number. The higher the number, the better the Expert Advisor.
Indicator chart
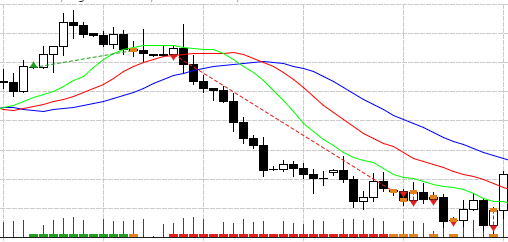
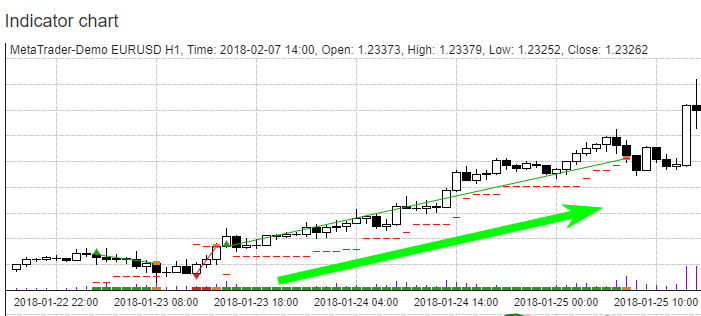
When you open the Indicator chart, it displays the price bars, the indicators used in the strategy, and the actual positions taken.

In case you set a Trailing Stop Loss for your strategy, it will appear on the Indicator Chart.

Balance Chart
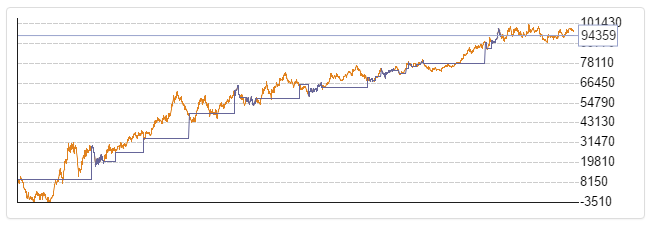
Here the program draws the balance and the equity lines as a result of the backtest.

Journal
The Journal panel displays all the trades that are part of the strategy’s backtest. You can look at the exact time and price of when the trades were opened or closed.

Then you can compare the information with a backtest of the same Expert Advisor, but this time in MetaTrader. The backtest results between the EA Studio and the Meta Trader platform should be almost equal.
If the two backtests do not match, this can be due to using different historical data, or not using the same time zone for this data. If this is the reason, then you should not use the Expert Advisor in a real account, but perform a proper backtesting.
0 out of 5 stars
| 5 Stars | 0% | |
| 4 Stars | 0% | |
| 3 Stars | 0% | |
| 2 Stars | 0% | |
| 1 Stars | 0% |
