Forex Fibonacci strategy – the way to enter the market at the right moment
Forex Fibonacci strategy is what I will demonstrate today that is suitable for all trading assets and different systems. Hello, dear traders, this is Petko Aleksandrov, and I am going to show you now the Forex Fibonacci strategy that I am using successfully. I will show you a method that I learned a long time ago in London from an old trader, I can say, who was using it very interestingly. And I was happy to be in that place at the time.
So he showed me his Forex Fibonacci strategy system, how he is drawing the Fibonacci.
I implemented this Forex Fibonacci strategy in my manual trading, and for over 5 years now I use successfully a price action trading strategy.
And I have shared it in one course.
The course is called Price action trading course. But now, I will focus just on the Fibonacci method.
So the Fibonacci on the platforms is right, where we have different drawing tools like the Pitchforks, the Gann tools, and different Fibonacci.
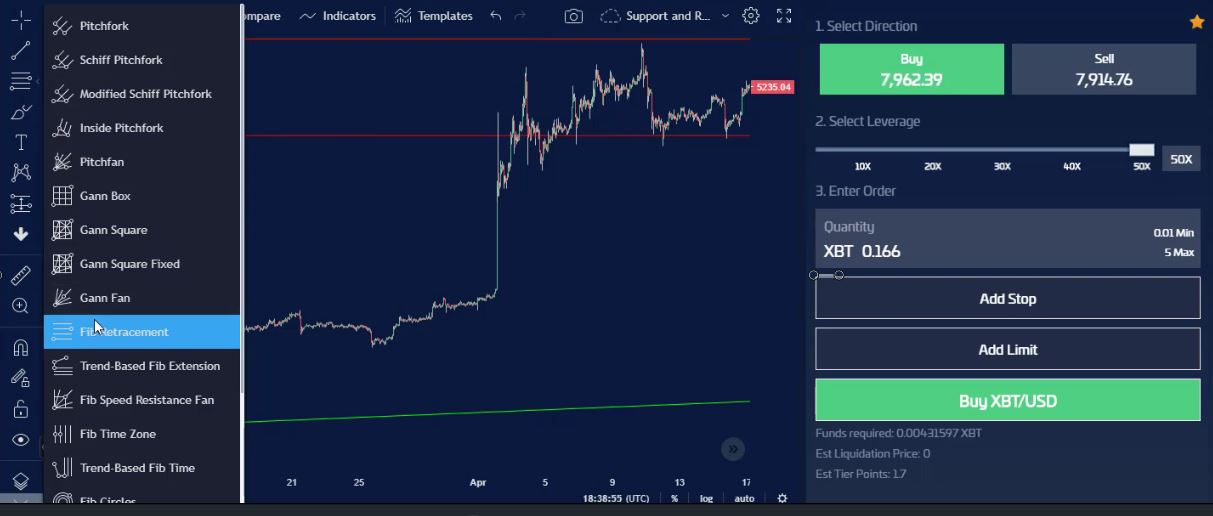
But I will use the normal Fibonacci retracement which you can find on any platform.
And I will not explain Fibonacci in detail because it’s a completely different system method. You can find a lot of information about it. I will show you how I am using it.
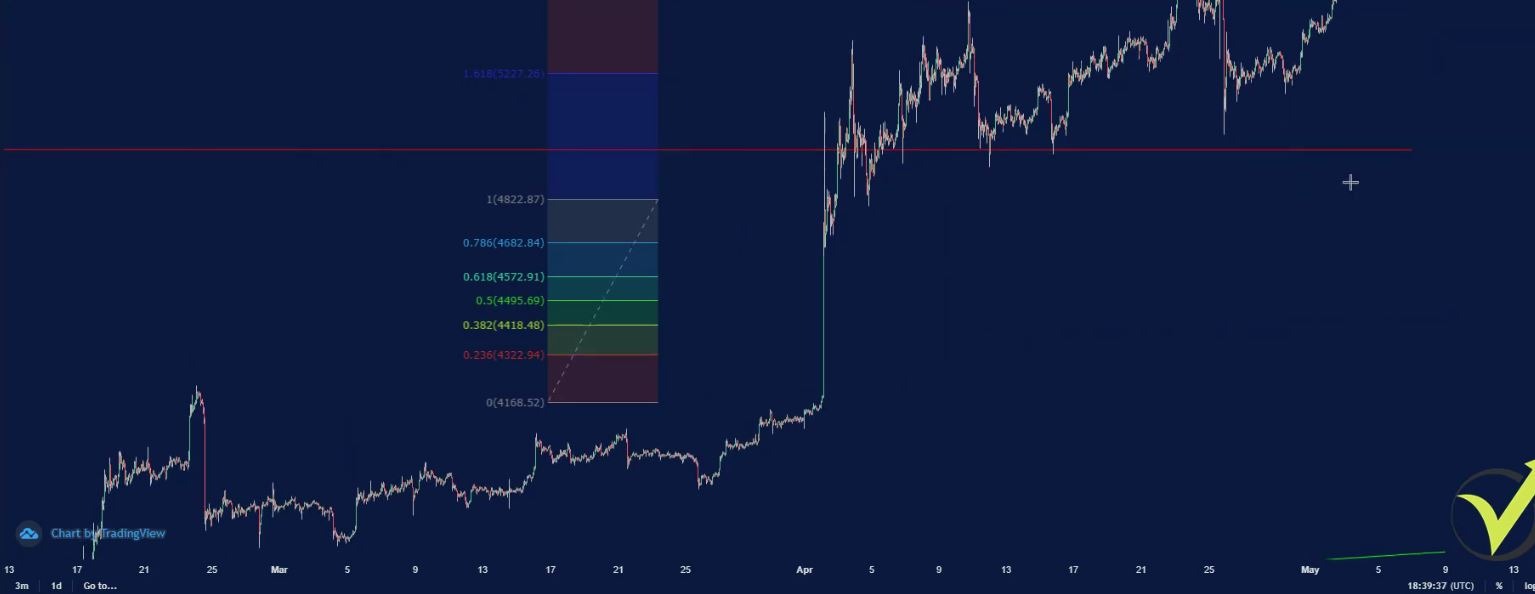
Fibonacci shows retracement levels
If I zoom in, you will see that there are these targets which you might be familiar with.
Change the colour in case of poor visibility.
But we usually measure a distance where we have a retracement, and we expect the price to get there, and then we have the different targets. So what we have with the platform are the different levels.
The Forex Fibonacci strategy uses the levels:
- 38.2%
- 50%
- 61.8%
- 1.272
- remove the 78.6%
- leave 1.618%
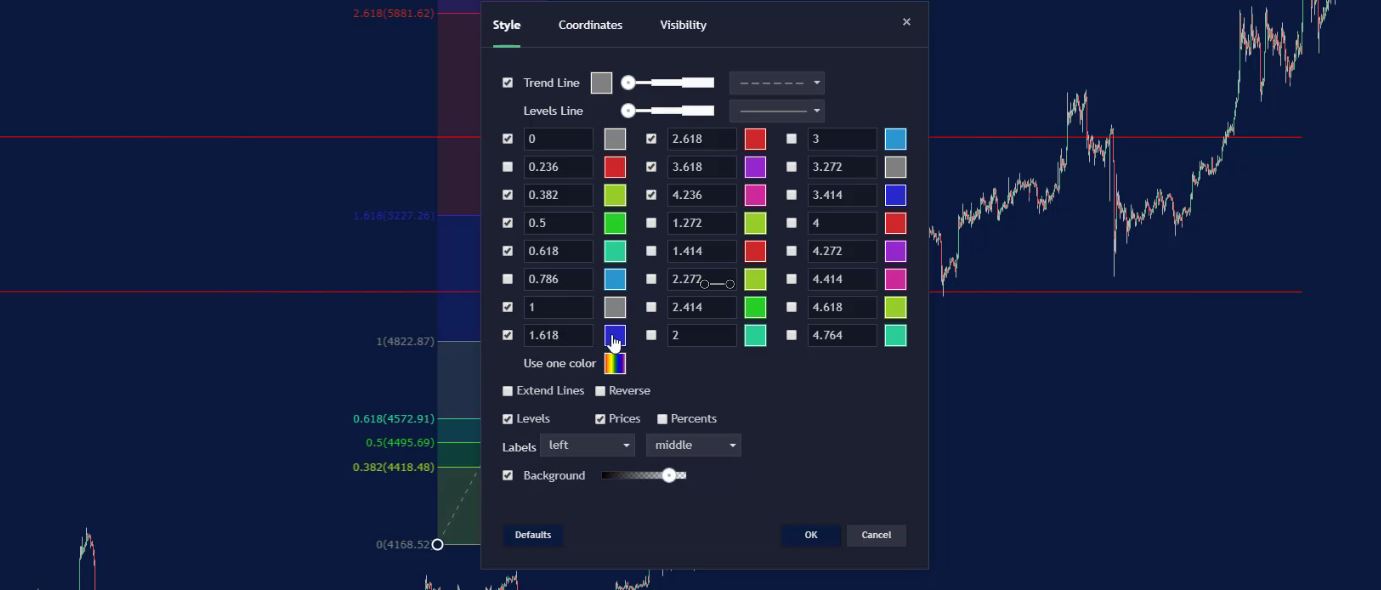
But I will change the colour so it will be more visual. So let’s make it green as well since it’s a target or even yellow, it will be just fine.
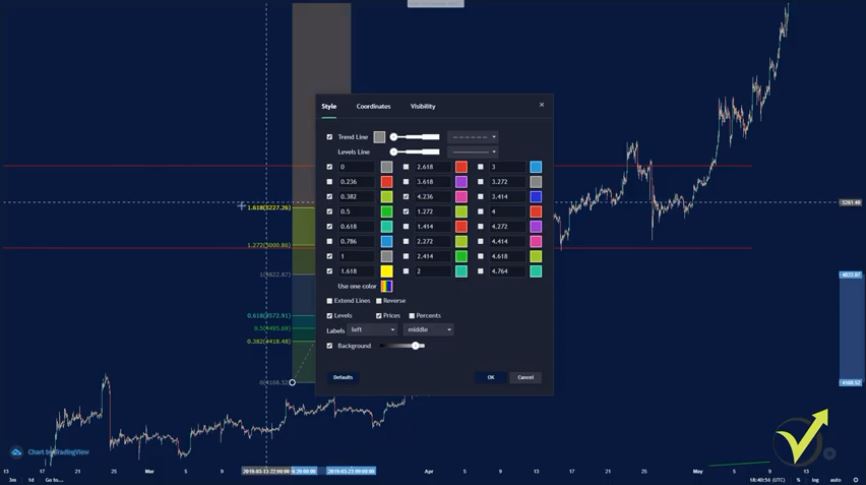
And I will add 1.272, this one over here, and I think the colour is just fine.

I will remove 3.618 and 2.618, so I will leave these two targets.
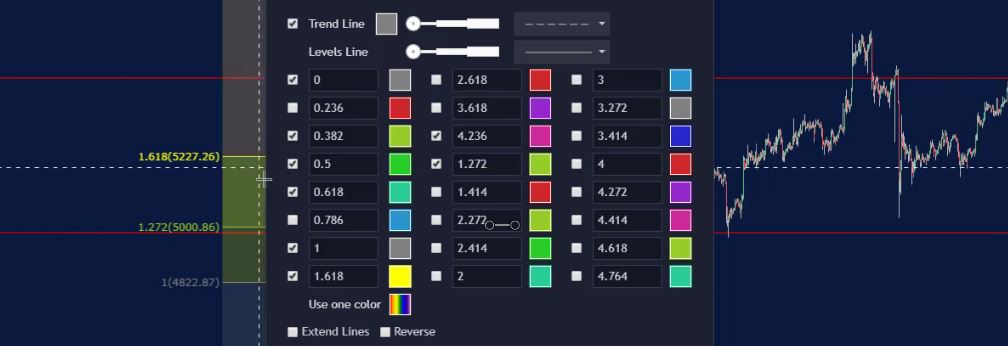
I will click on OK to save the changes.

And here the Forex Fibonacci strategy is ready as levels.
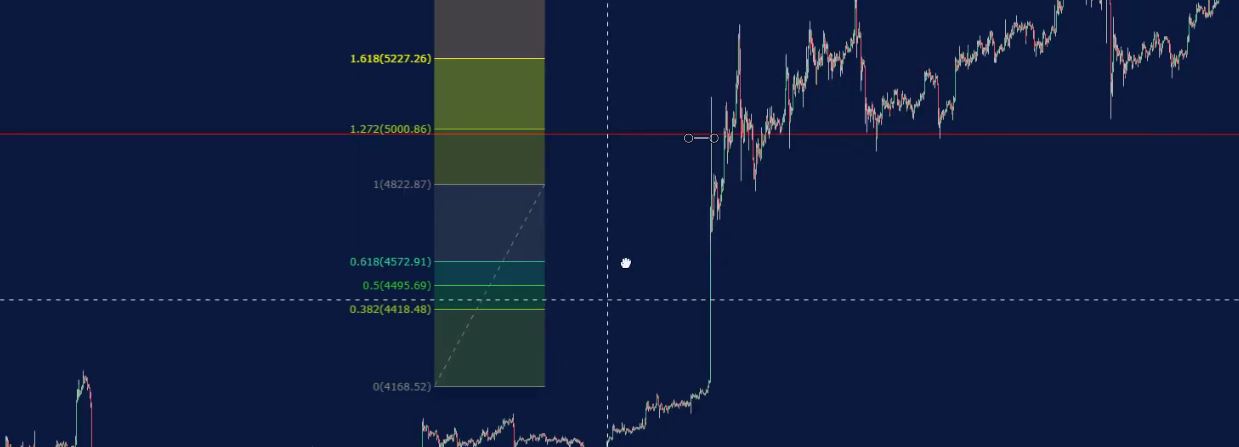
Now, how I use this Forex Fibonacci strategy, I will show you step by step.
I will start from the first low that we have in this uptrend or from where our trend line starts. This is the first low of the uptrend, and it is the last low from the downtrend. It’s the same moment.

The retracement zone of the Forex Fibonacci strategy.
The beginning is where the downtrend stopped, and from here the uptrend started.
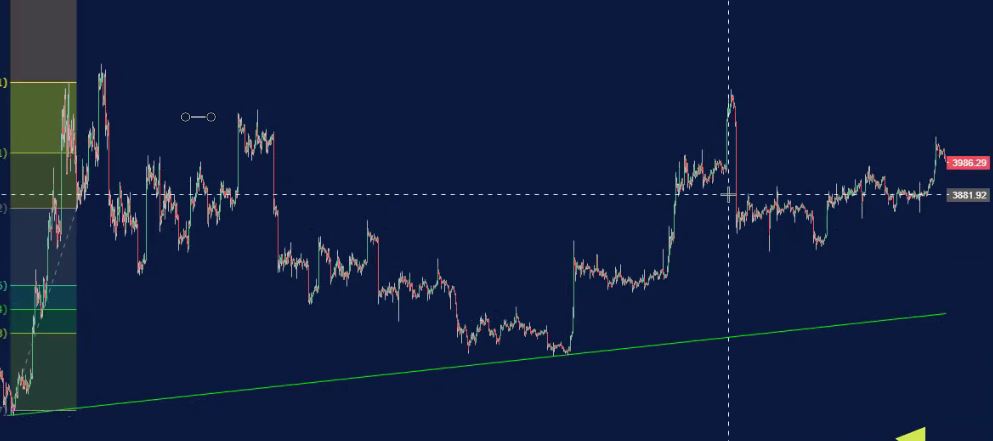
Let me zoom it, and I will show you how I’m using Forex Fibonacci. So I take the first low, and I connect it to the first high that the price made:
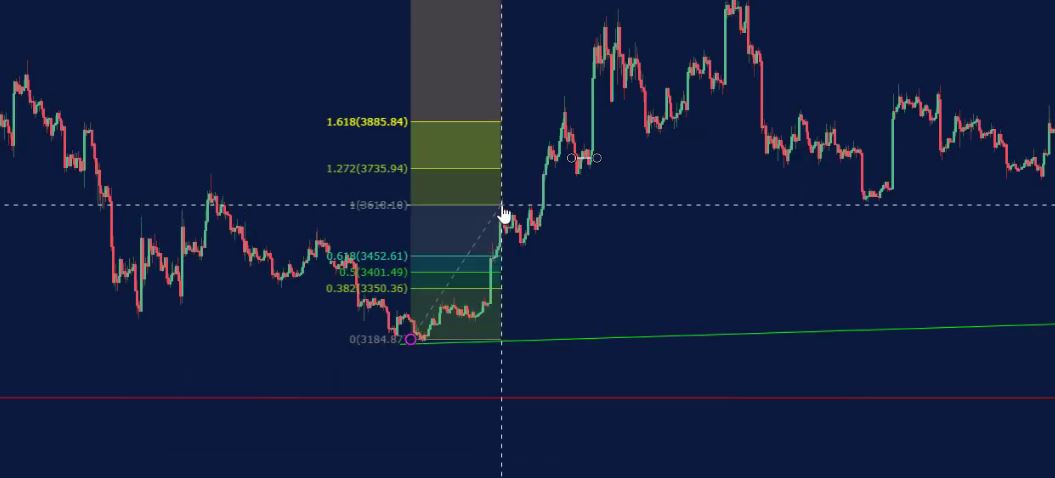
And we are looking for these highs that are visual.
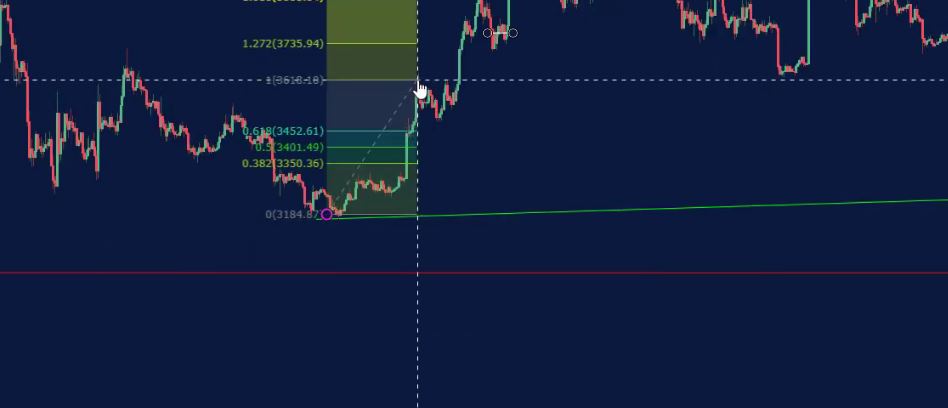
and we are not staring at the small highs like this one:
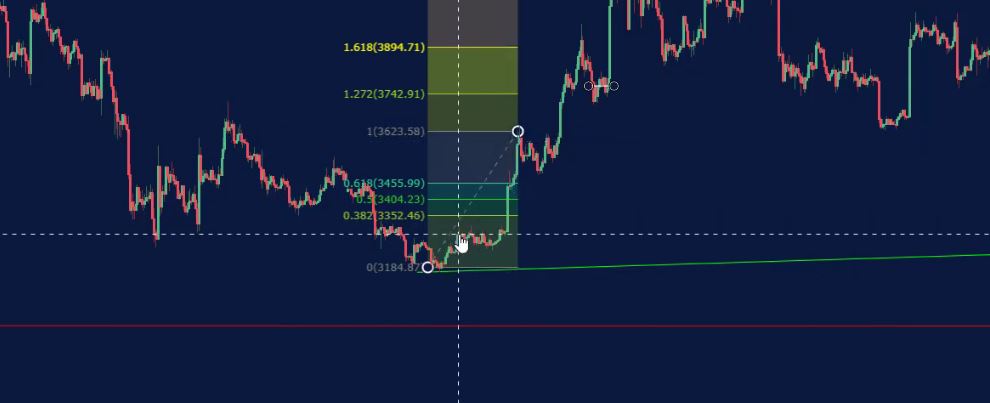
Now, the idea is that this is the first impulsive move that the price made. Now, here we have the zone for the Forex Fibonacci strategy or our retracement zone where we expect the price to get into and to continue the trend direction.
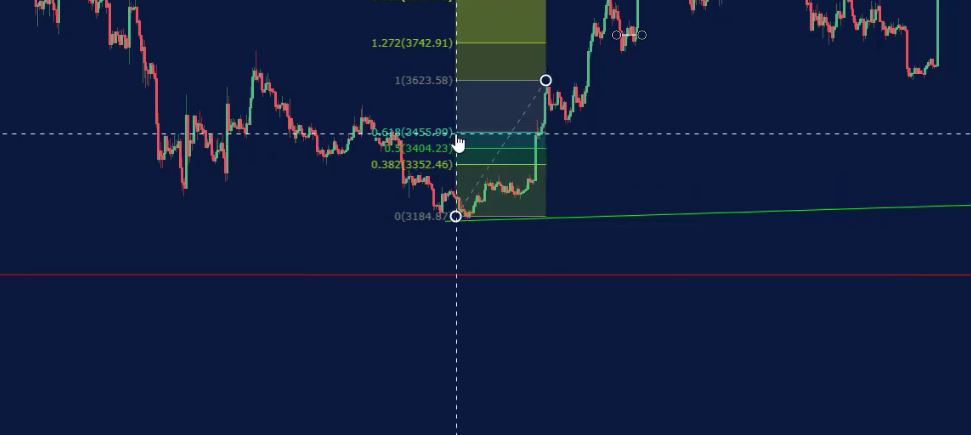
And we have the first target for the Fibs:
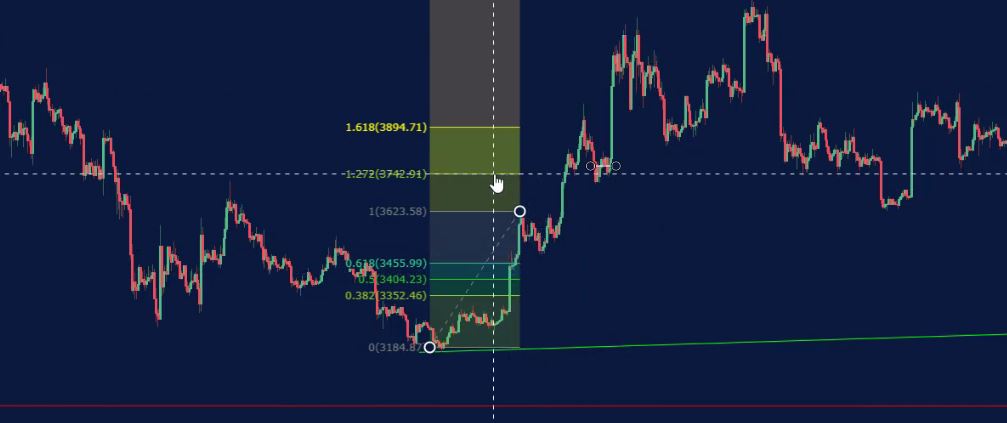
and we have the second target.
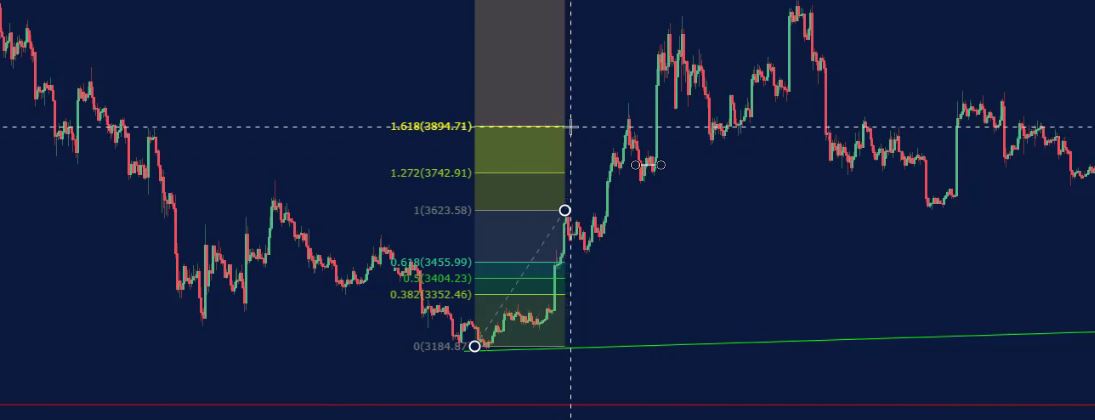
Now, when the price reaches the second target, I take the next high and I will draw another Fibonacci to the lowest point of the retracement.
So let me copy the Fibonacci and I have one over here.
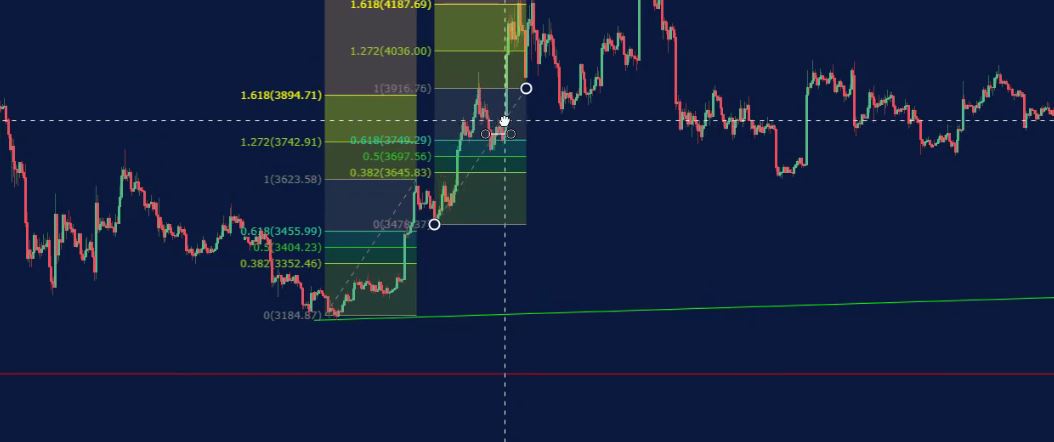
I will take it from this high over here
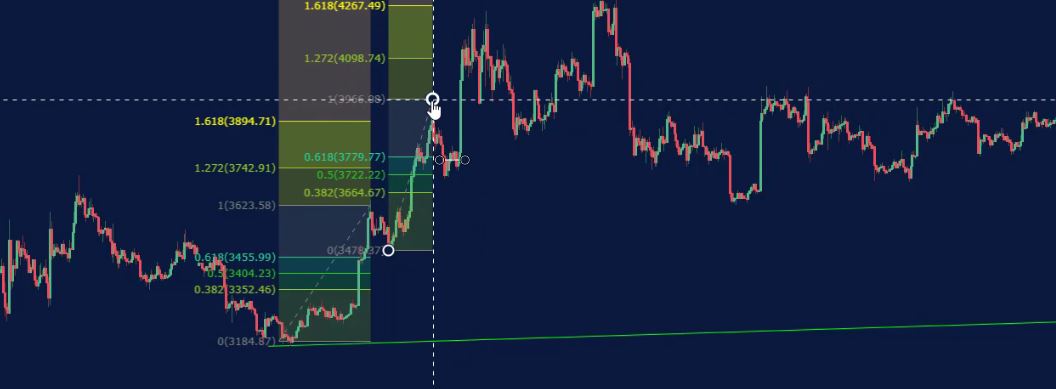
going down to the low.
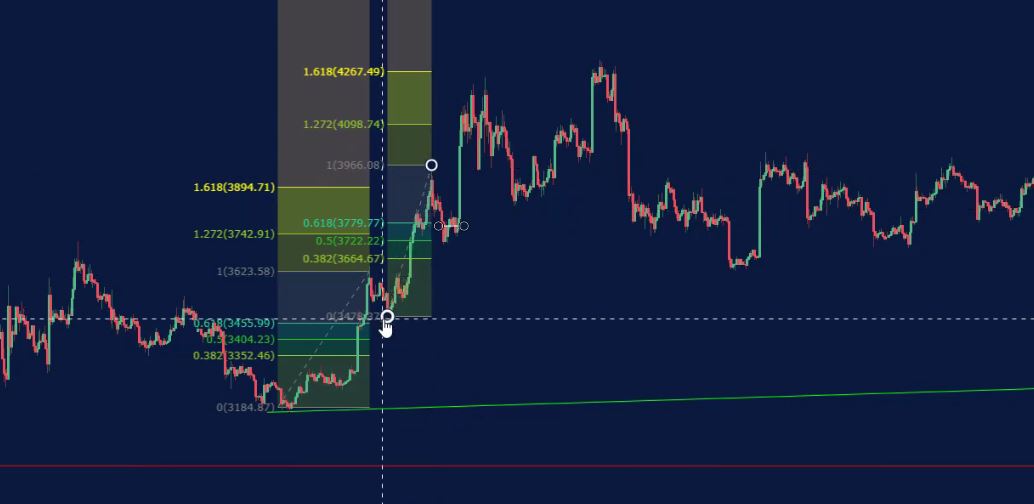
One more time, this is where the second target reached and the next high I am taking another Fib down to the low which is the lowest one as a retracement to this move.
Restarting the Fibonacci.
And now what we see here, this is another move and the target is right over here and you can see that price reached it at this level.
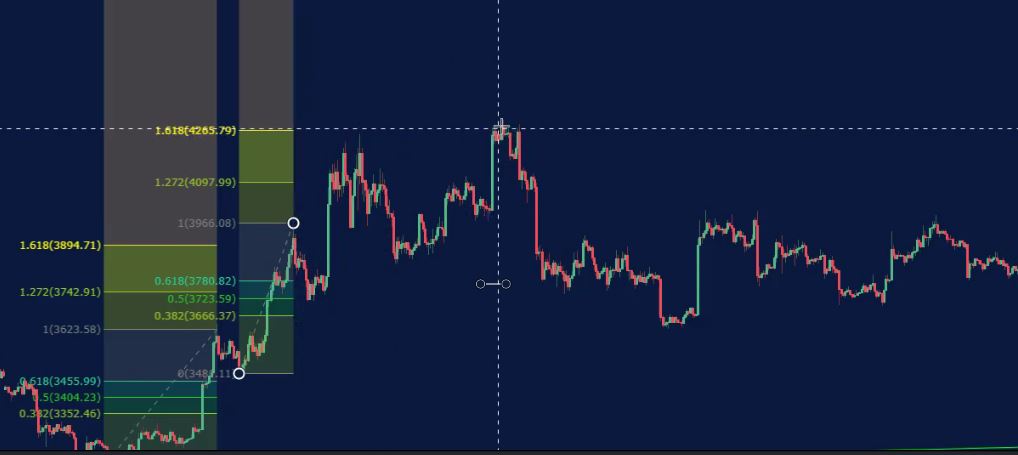
So I will take another Fib, let me make this one precisely, and I will start it from right over here, from this top
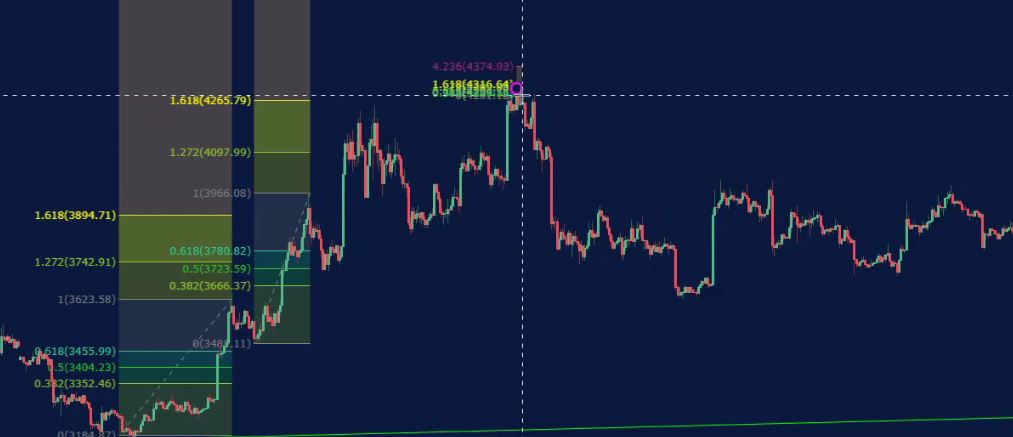
to the lowest point after the first one.
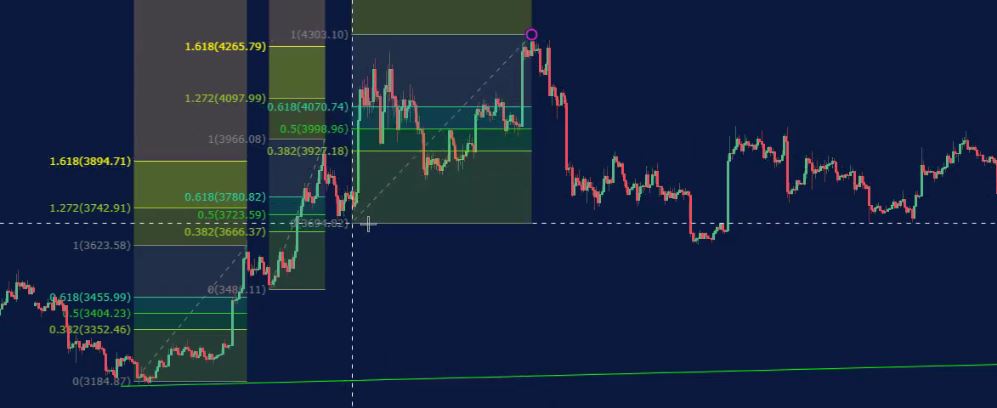
And I can draw it like this:
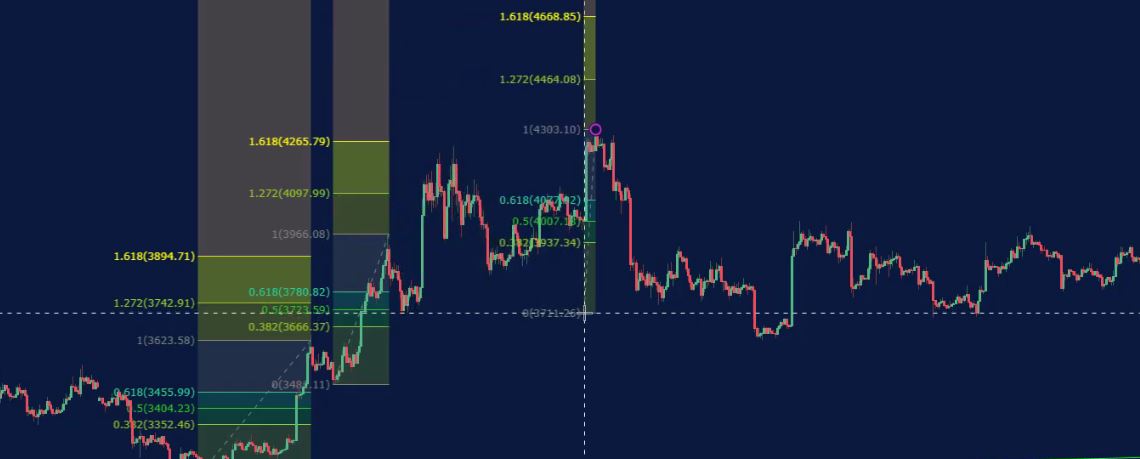
it’s one and the same thing. And normally I leave it at the middle. Now, you can see where is my second target – 4672.24.
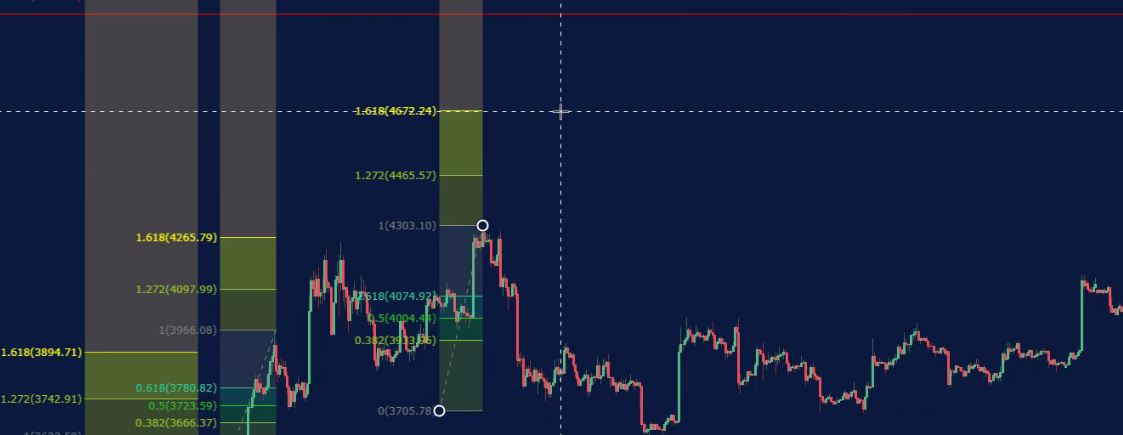
And what I need to do is I need to take the level where the price reached and take the next high.
But what you can notice is that the price went below the 0 line.
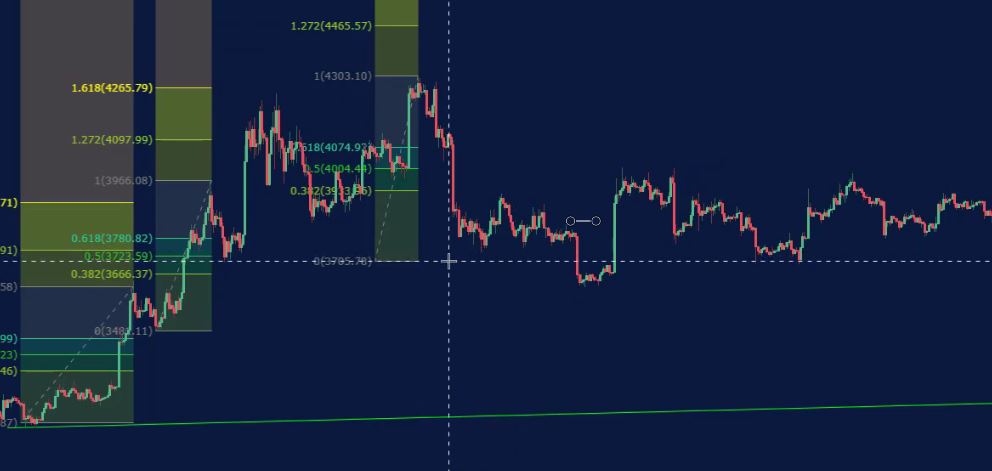
So this is the moment when I restart the Fibonacci. So if the price goes back to the lowest point, you might restart it a few times with this Forex Fibonacci strategy.
Copying another Fibonacci.
And here, if I start drawing it I will restart it over here again. I will make just a new one. And I will go to the next lowest point which I believe is the one over here.
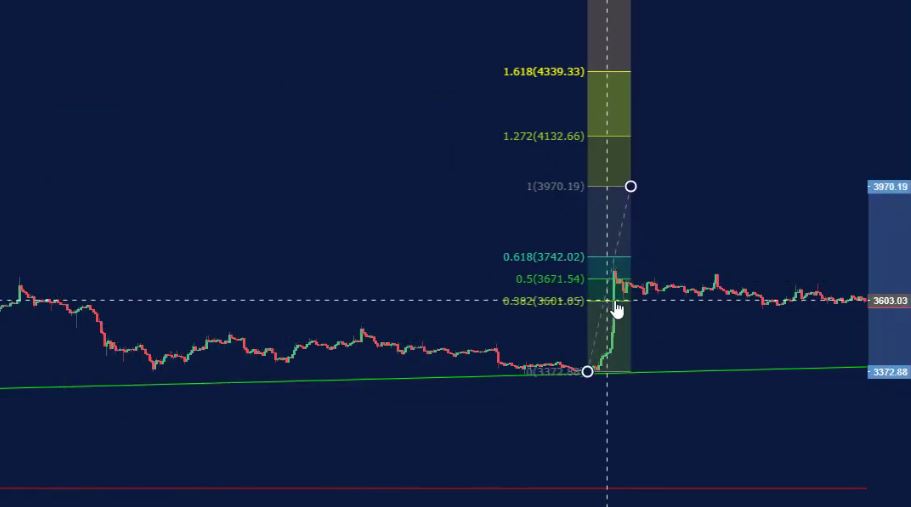
So here is the new Fib and the new targets of 3835.40 and 3963.69.
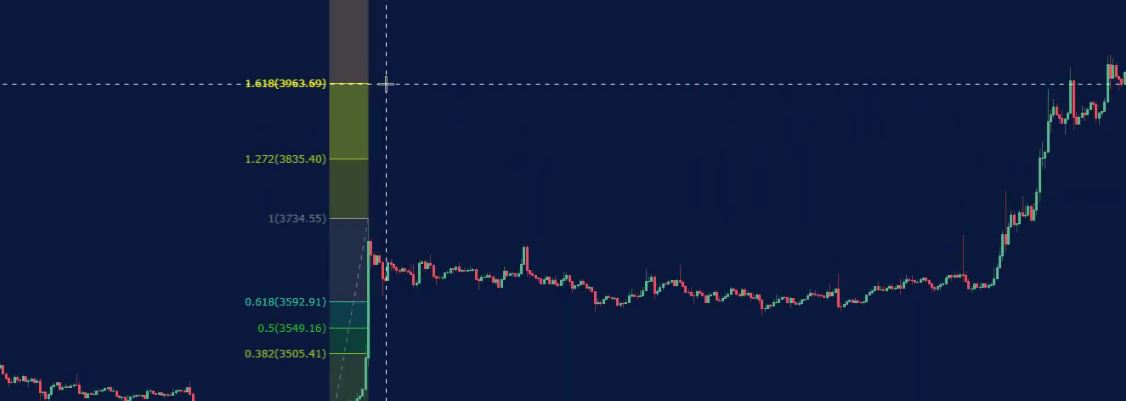
The target is reached right here from the price and I need to take it as a point for the new drawing.
Forex Fibonacci strategy is a consecutive drawing process.
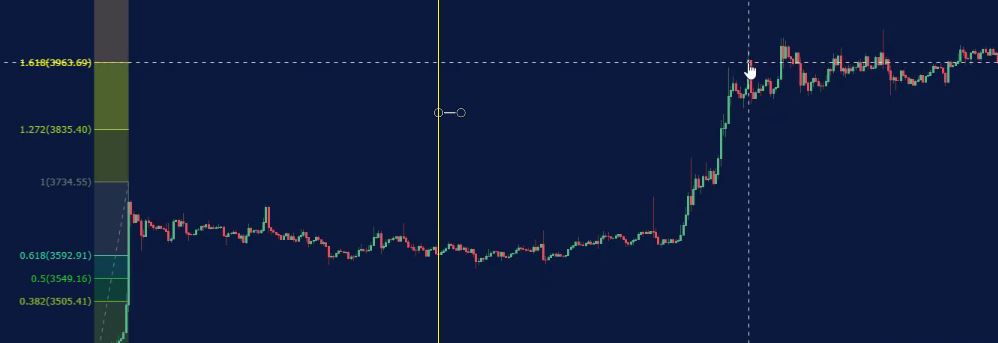
So I will just copy another Fibonacci, again Ctrl + C and Ctrl + V:
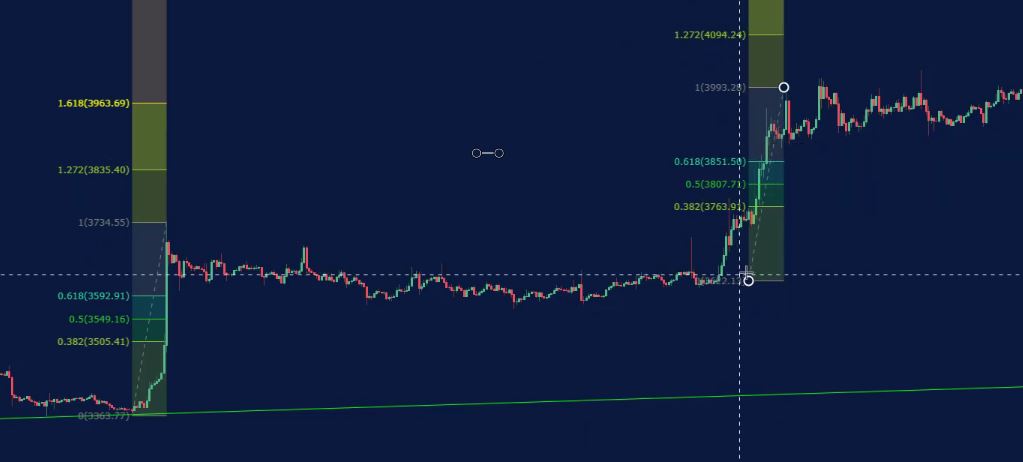
And I will leave it to the lowest point which is this one over here.
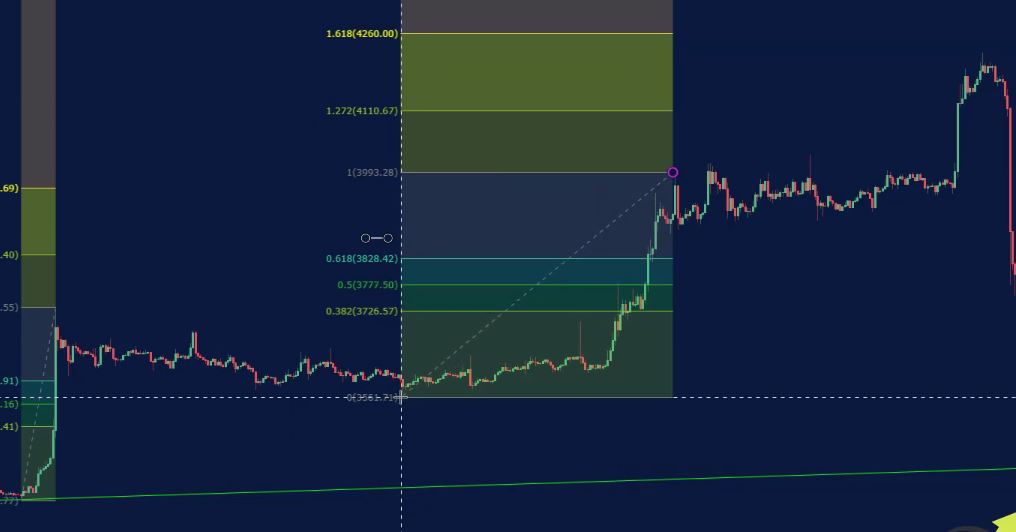
The lowest point after this extended move.
The price reached the second target, right over here. I take the first high after that
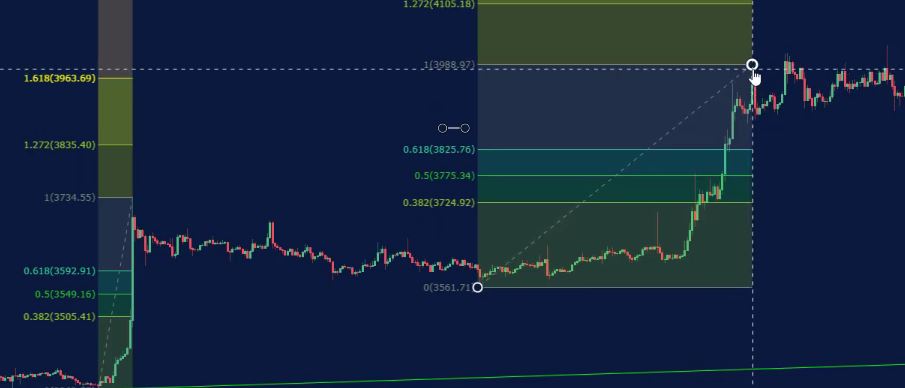
and I take it to the lowest point.
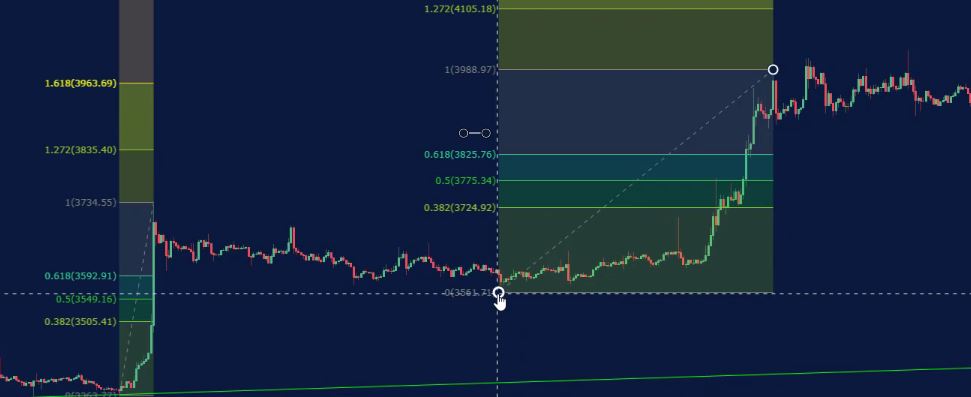
The second target is used in the Forex Fibonacci strategy system.
Now the price goes towards the second target but didn’t reach it. So I keep looking for the moment where the price reaches this second target. It’s right over here with this extended move.
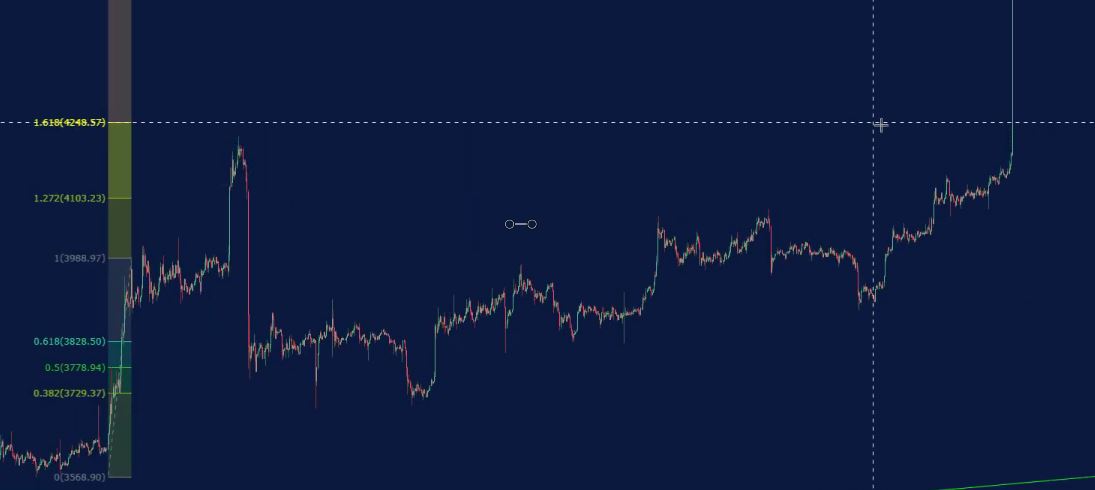
What I need to take now is the next high. And I will again copy the Fibonacci, and I will draw it from this top over here, going down to the lowest point.
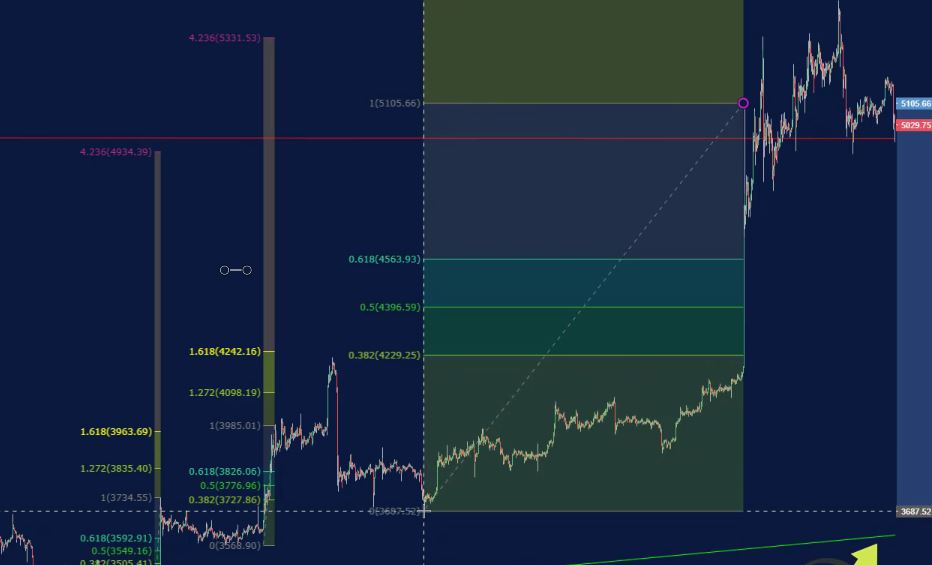
Let’s have a look where is the second target. It’s right at 5976.87 and the price reaches it:
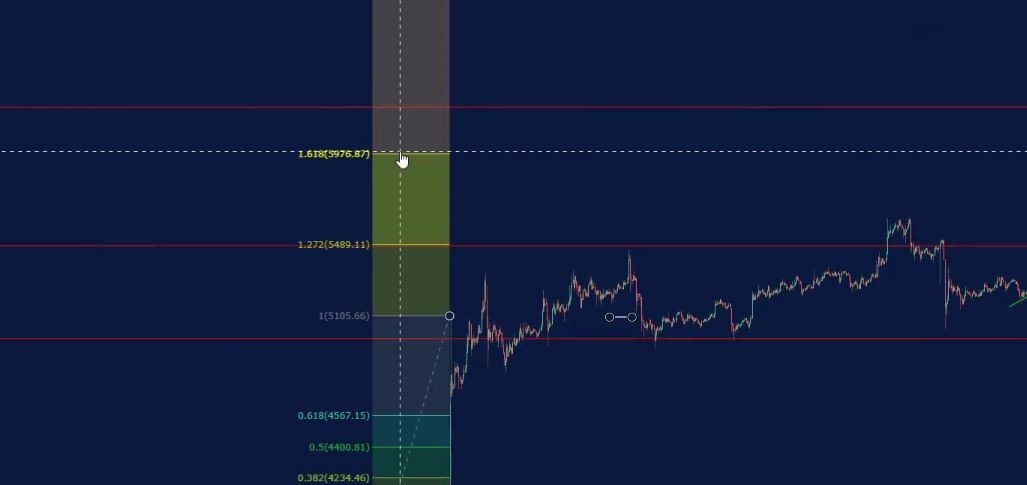
I will copy again a Fibonacci for the next drawing.
I am taking Fib from the next high where the price reached the second target. And this is actually from where the Fib starts, so I’m drawing it opposite the trend.
The second targetis what matters in this Forex Fibonacci strategy.
I’m starting from here
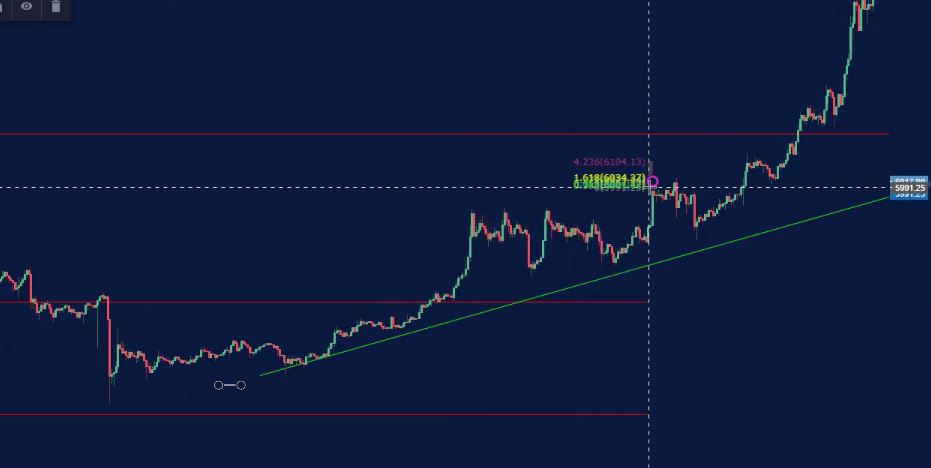
and I draw it to the lowest point after this Fibonacci. And in this case, it is right this level here.

So instead of drawing it like that,
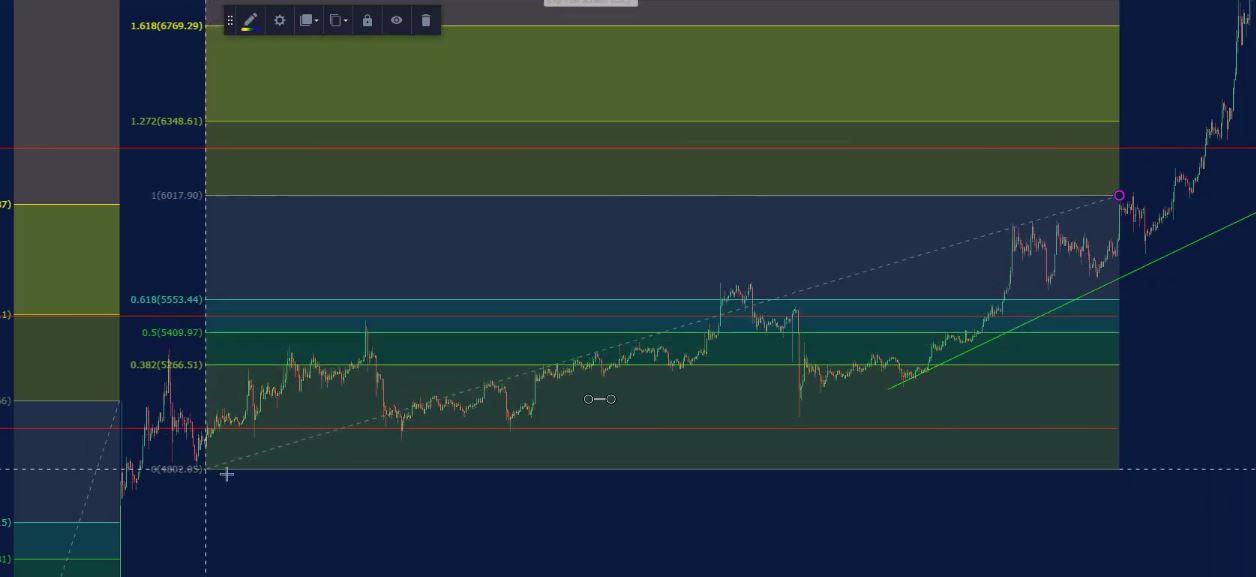
I will just draw it like that,
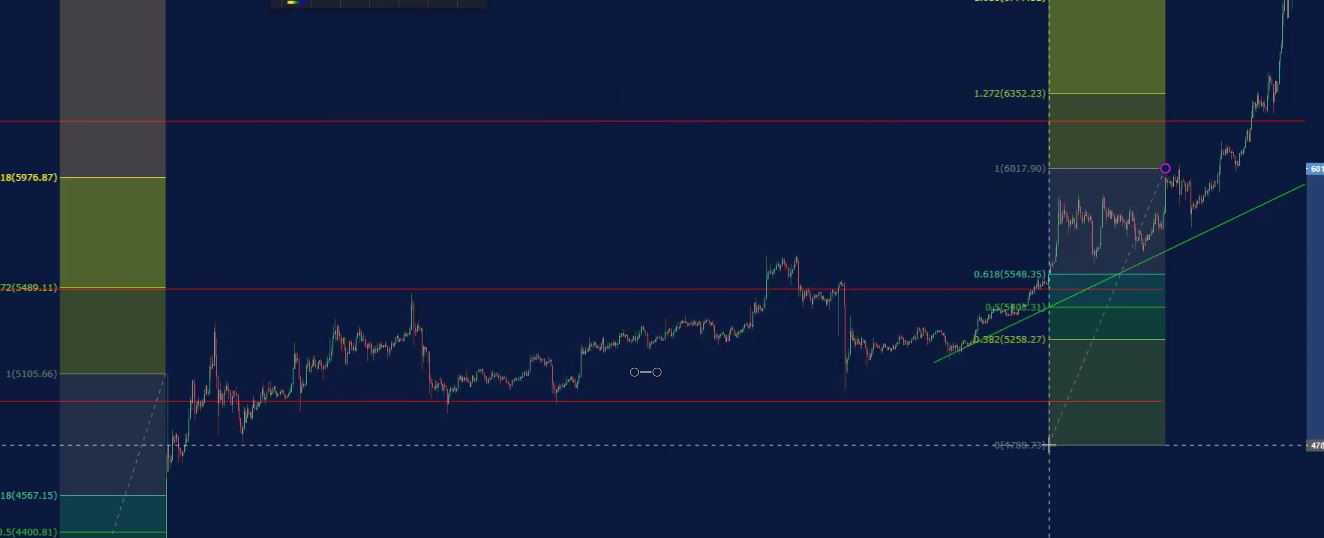
So this is my new Fibonacci, here is the retracement zone.
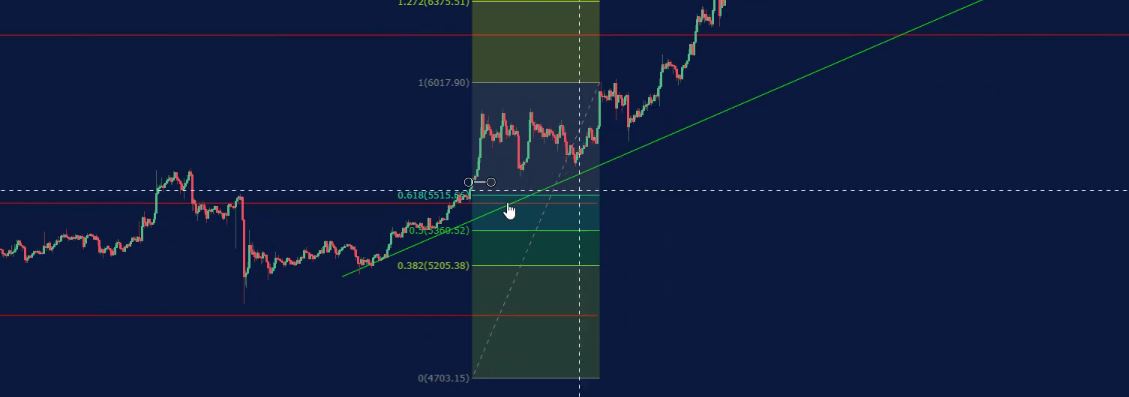
And let’s have a look now at the second target:
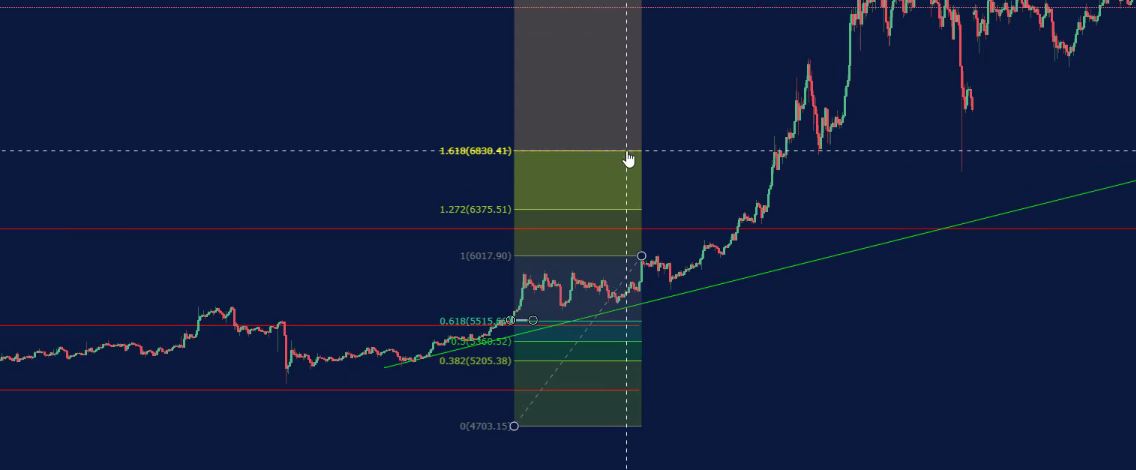
The price reaches it at this moment and forms a new high over here.
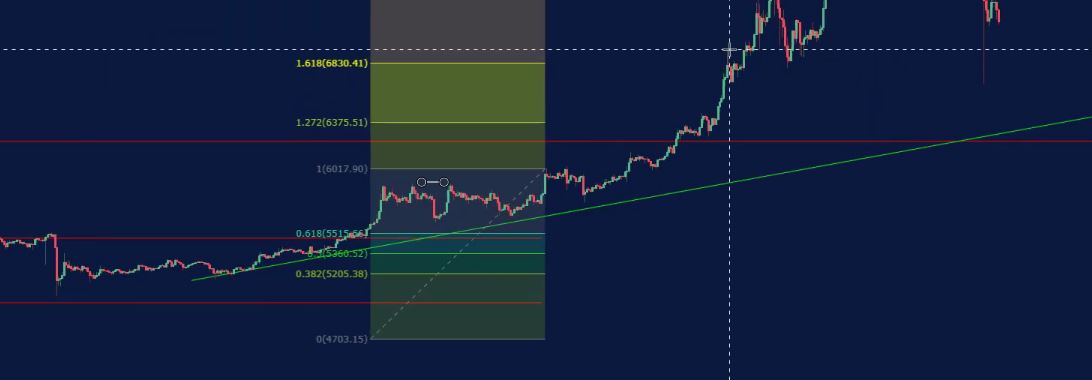
What do I do? The same thing, copy/paste and I will bring one more Fib from this high getting to the lowest point which is right over here.
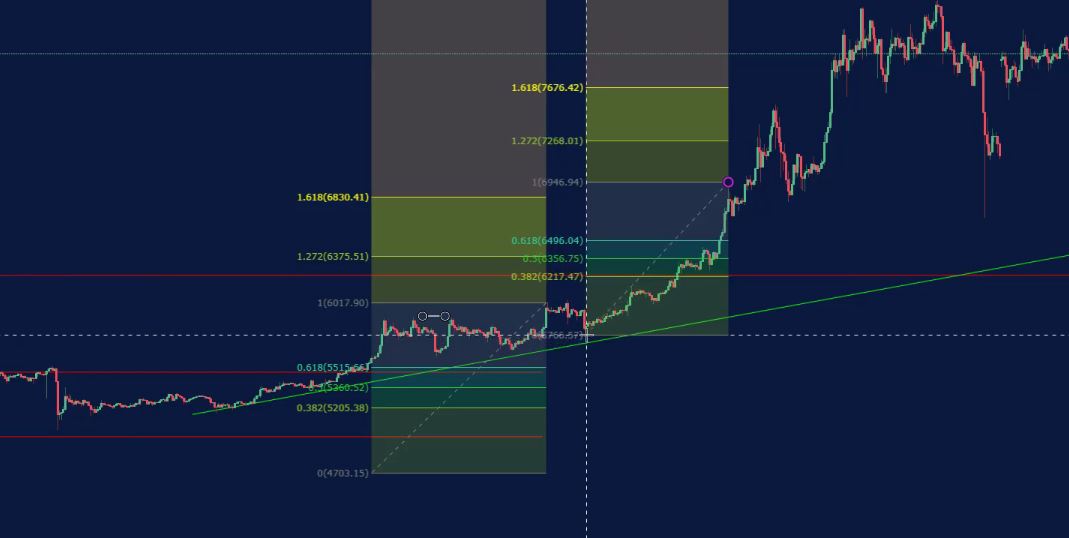
And then we have the second target hit. I will take another Fibonacci and I will bring it to the next high. So I prefer to draw the Fibonacci this way so they don’t cover each other.
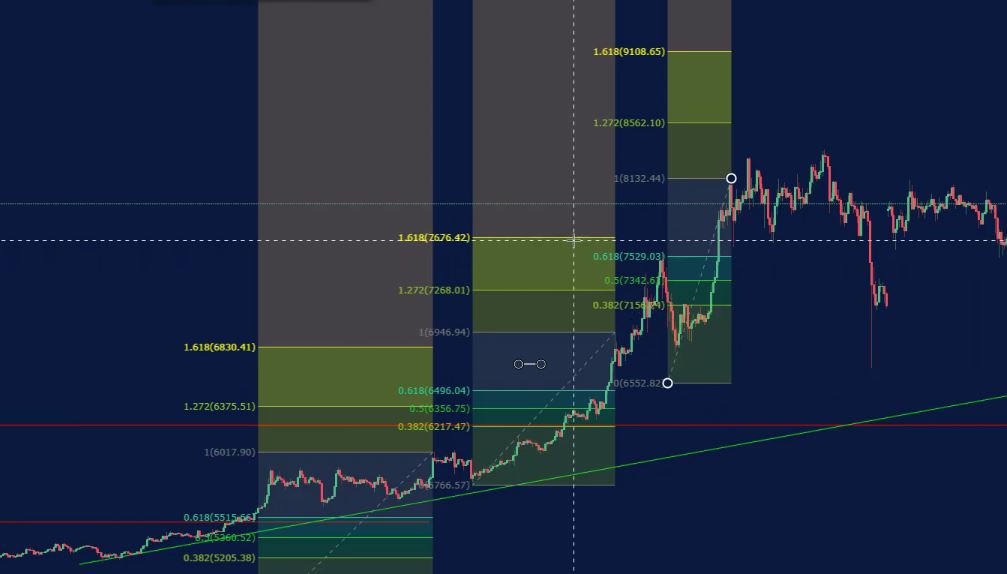
Zoom to make the chart clearer for this Forex Fibonacci strategy.
But you can see the second target is here, the price reaches.
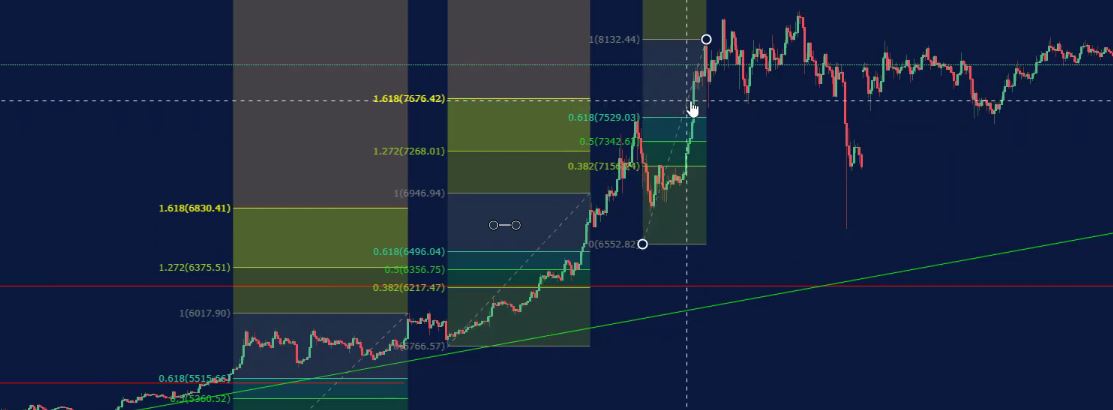
I take the first higher high and it’s this one over here.
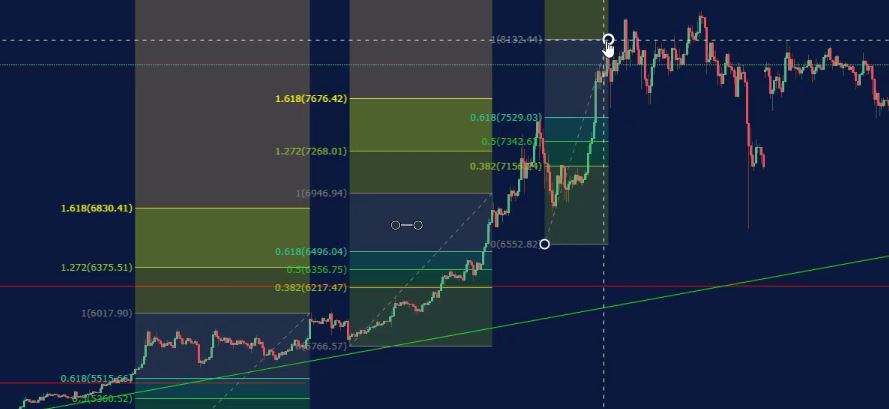
And then here is my zone of retracement
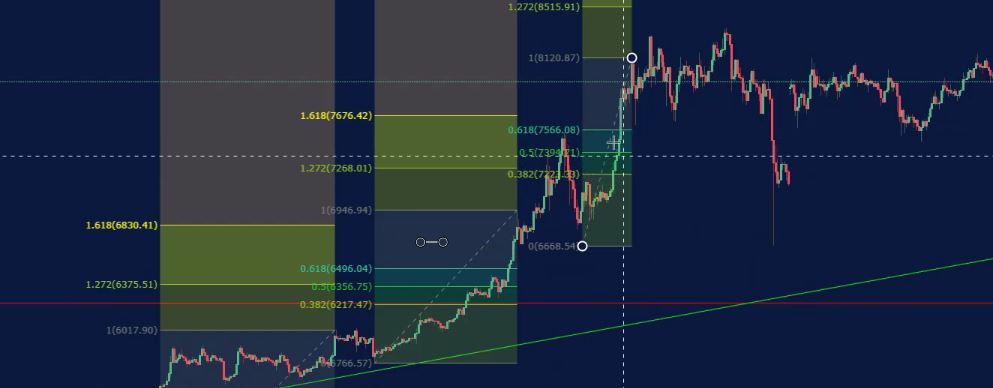
and here is my new Take Profit at 9018.41.
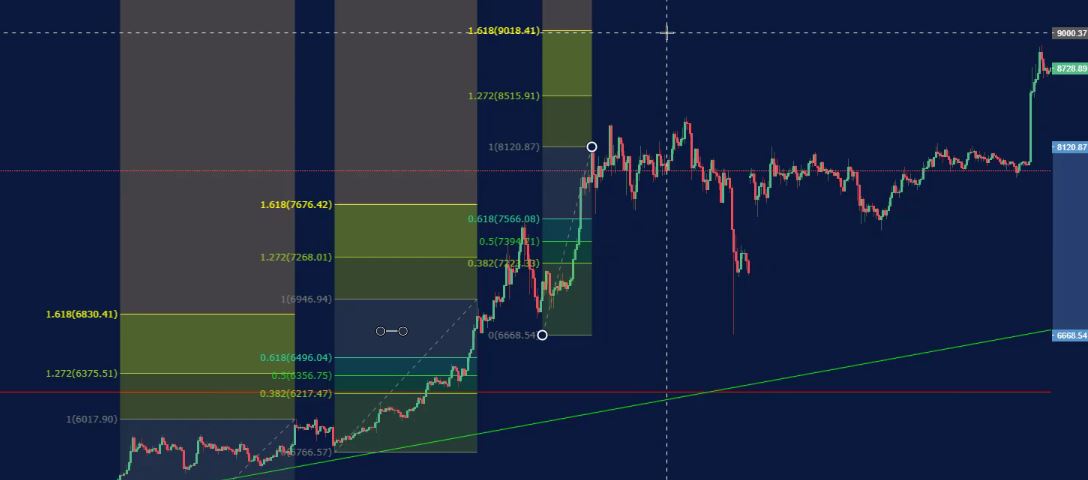
And if I move the chart, you will see that the price reached it exactly.
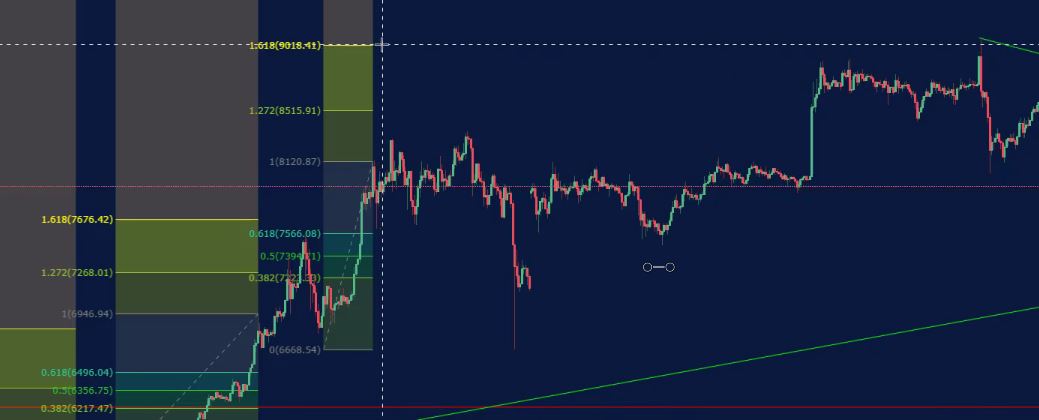
This level here of 9,000 and something was reached by this recent high.
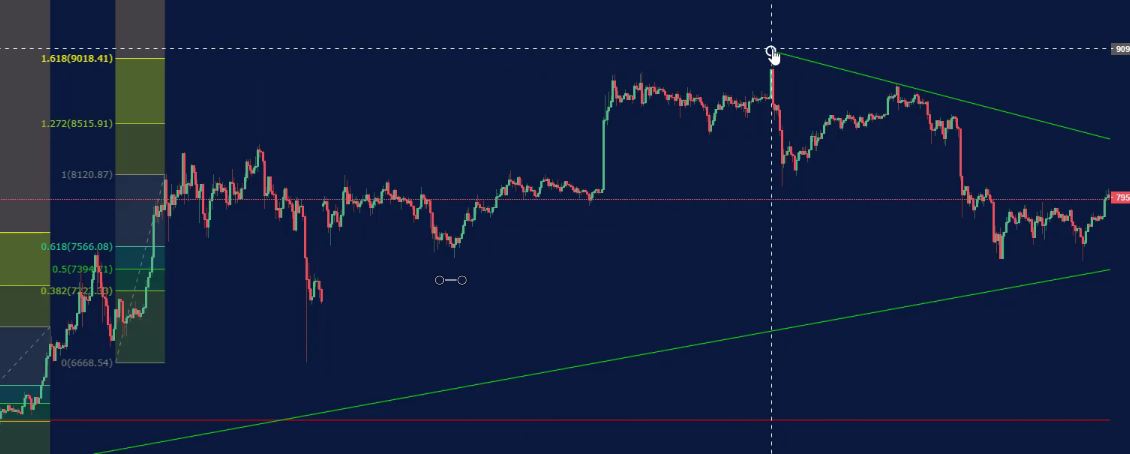
So now I will take one more Fibonacci and I will start it from this high
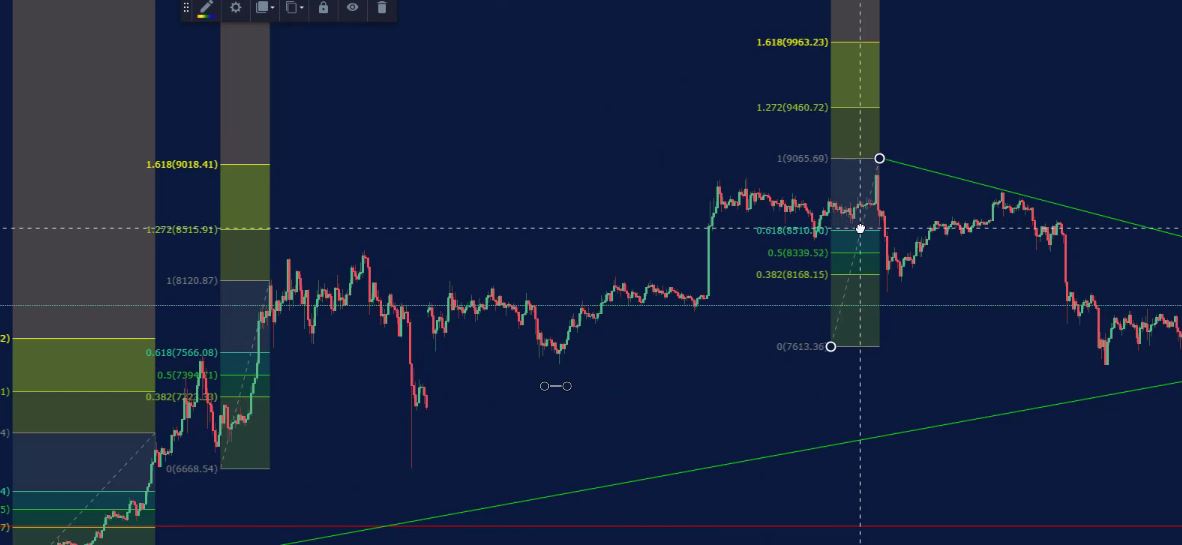
going to the lowest point which, in this case, is this one over here.
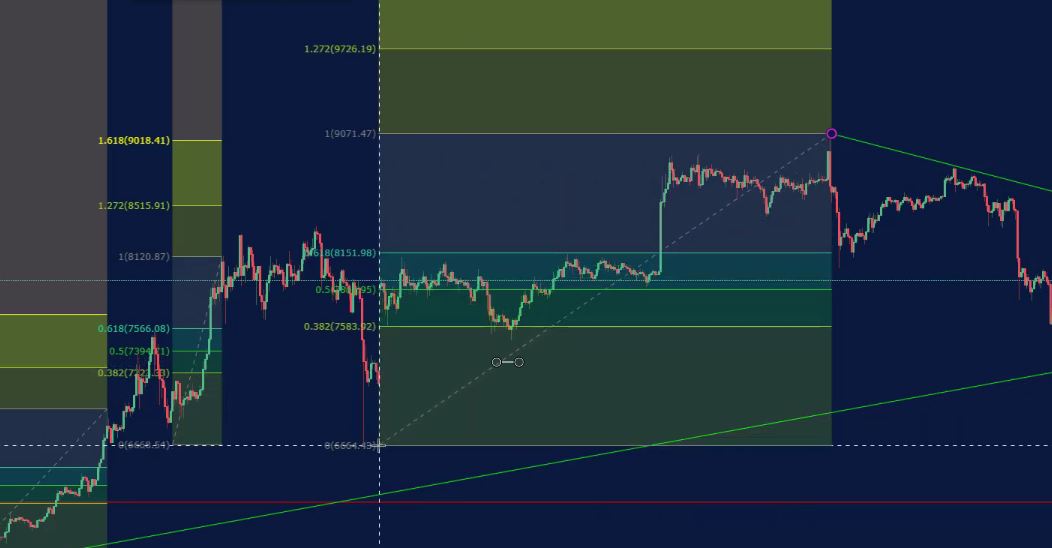
Let me just zoom and to make sure if we are having a lower point or not.
Yeah, I think it’s a little bit but it is lower. I’m talking about this spike here. Yeah, it is lower, a little bit but it’s lower.

Don’t mess up the chart with too many drawings.
So I restart it again starting I ignore all that I have drawn. And I will need to take it to the first high.
And I have a new start for the Fib. So it is like I build it and if I see a lower low than the retracement, I need to restart it. I will take another Fibonacci and then I will take it from the first high after the second target, which is this one over here, here it is, and the lowest point of the retracement. I will draw it like that, so here it is, the very same level.
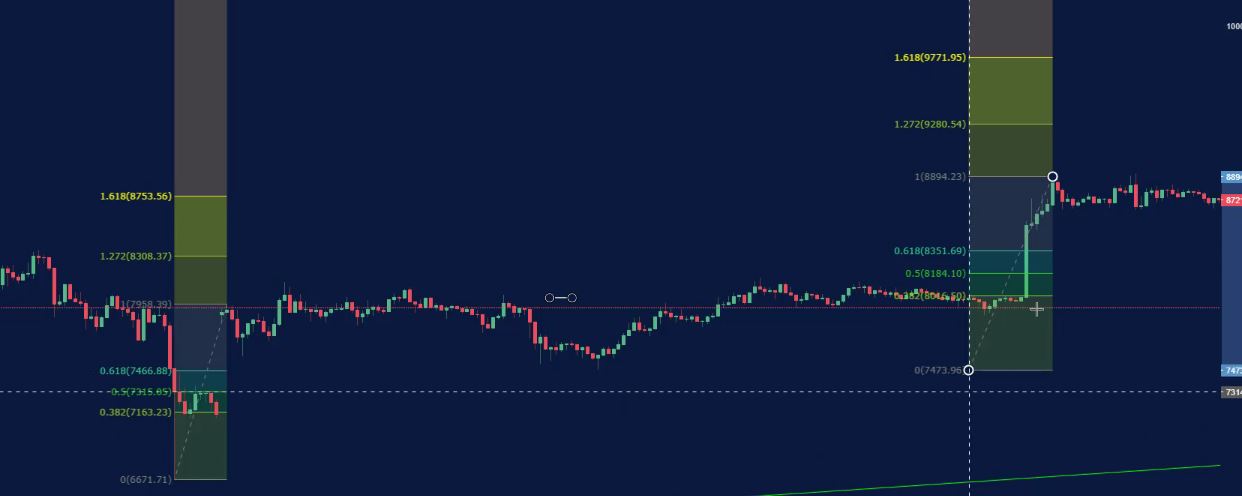
And let’s have a look at the target – 9771.95.
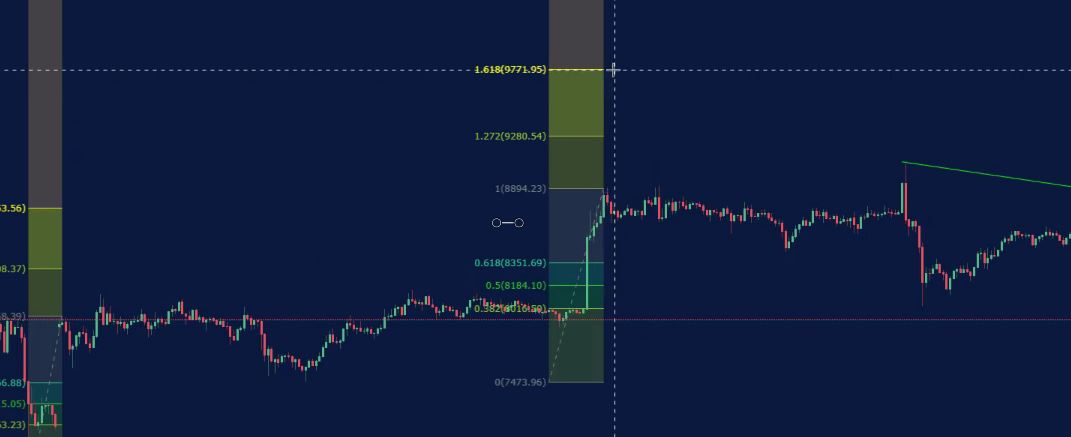
It’s not reached.
And now all of the Fibonacci that I had before that, before this one over here, I can remove it.

I will remove them so I will not have too many drawings and mess on the chart.
Feel free to ask if you have any questions about this Forex Fibonacci strategy.
However, when you do your analysis for the asset, you do it just one time. It is good if you do it just to practice how I do it. And of course, if you have questions you can ask me. In the beginning, it could be a little bit complicated but the idea is very simple.
We take the beginning of the trend, we draw a Fibonacci, we take the second target, where the price reached we take another Fibonacci to the lowest point of the retracement and then we continue. Now, what is the idea here? We have this retracement zone where we want to enter.
And as you can see, if the price breaks the counter trend line, as I said this is one of my entries, this will be within the retracement zone of this Fibonacci. You can see if it breaks it now, it will be within this retracement. And this retracement zone is just an idea where it’s a good place to get into the trade.

Thank you for reading and let me know if you have any questions about the Forex Fibonacci strategy system in the comments below. But I’m sure if it is complicated for you, you just need to watch the lecture one more time and it will make sense to you, and you will learn to do it.
Just practice it, you’re welcome to send me some screenshots for your Fibs.
And this way I will tell you if you’re doing it properly or not.
If you want to learn the complete price action trading system used by me, have a look at the course Price Action trading course.
Thanks for reading and always enjoy the trading.
Cheers.


