In this lecture, I will demonstrate to you how you can export and download EUR USD historical data in JSON or Excel CSV file. Moreover, as a resource file for this lecture, you will find a script that will help you to download historical data in MetaTrader.
Table of contents:
Download EUR USD historical data from MetaTrader
Let’s start by opening EA Studio and going to the Generator tab. On the Generator, you will see that the first box says Historical data, and I have the Data source below.
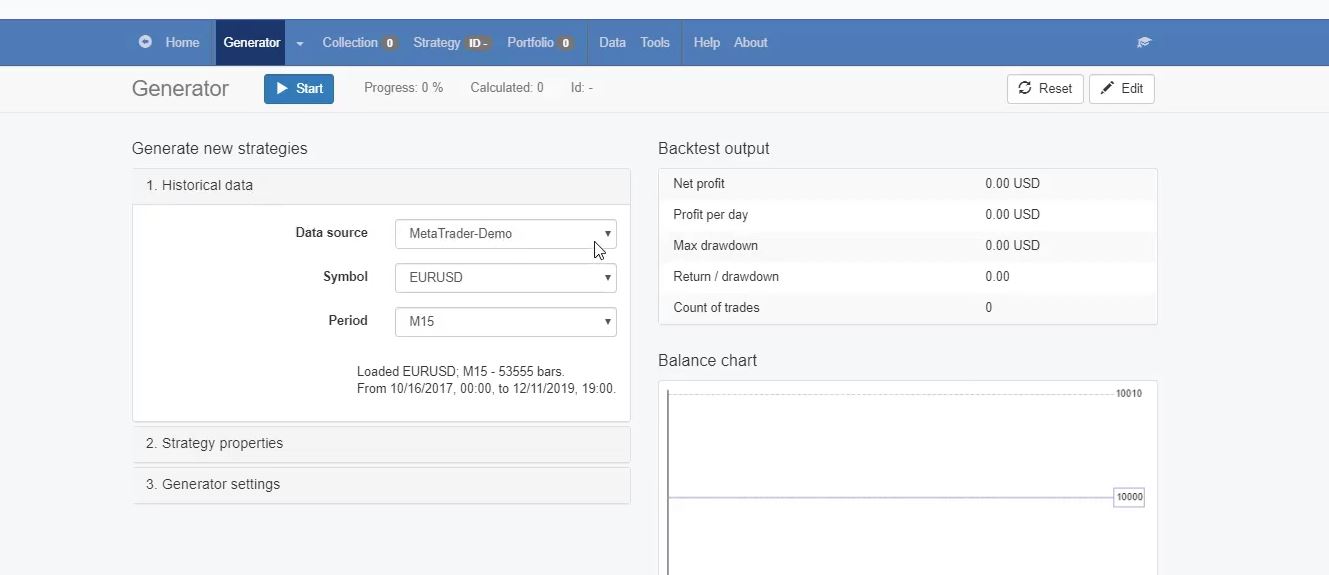
MetaTrader-Demo is the data source that comes by default from Expert Advisor Studio and if I just click on it, I see many other sources of historical data from different brokers.
So what you need to do in order to import your historical data in the software is to go back to your MetaTrader platform and place the script.
Placing the download script in MetaTrader
So how can you do that? Go to File, and then Open Data Folder,
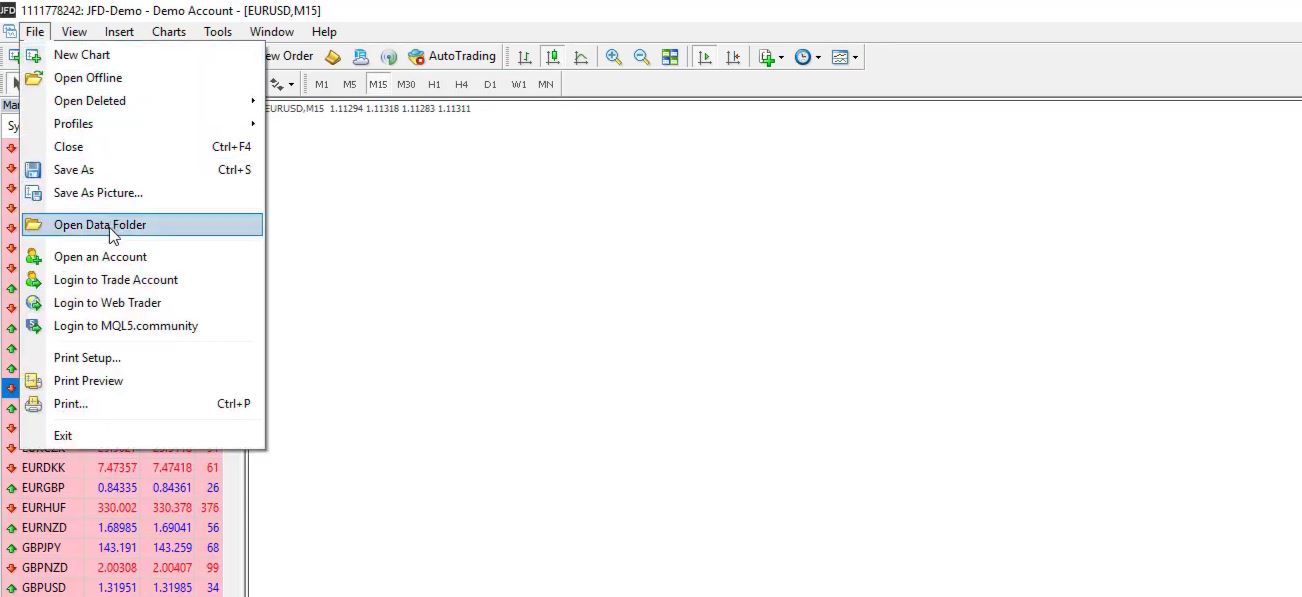
after that click on the MQL4 folder
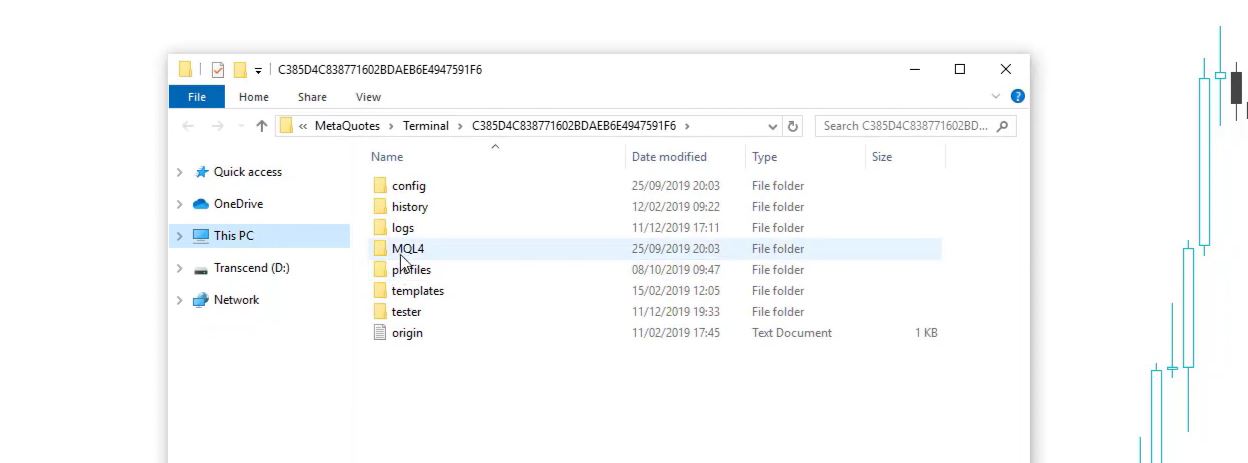
and then go to the Scripts folder. You need to paste the EUR USD historical data download script into this folder.
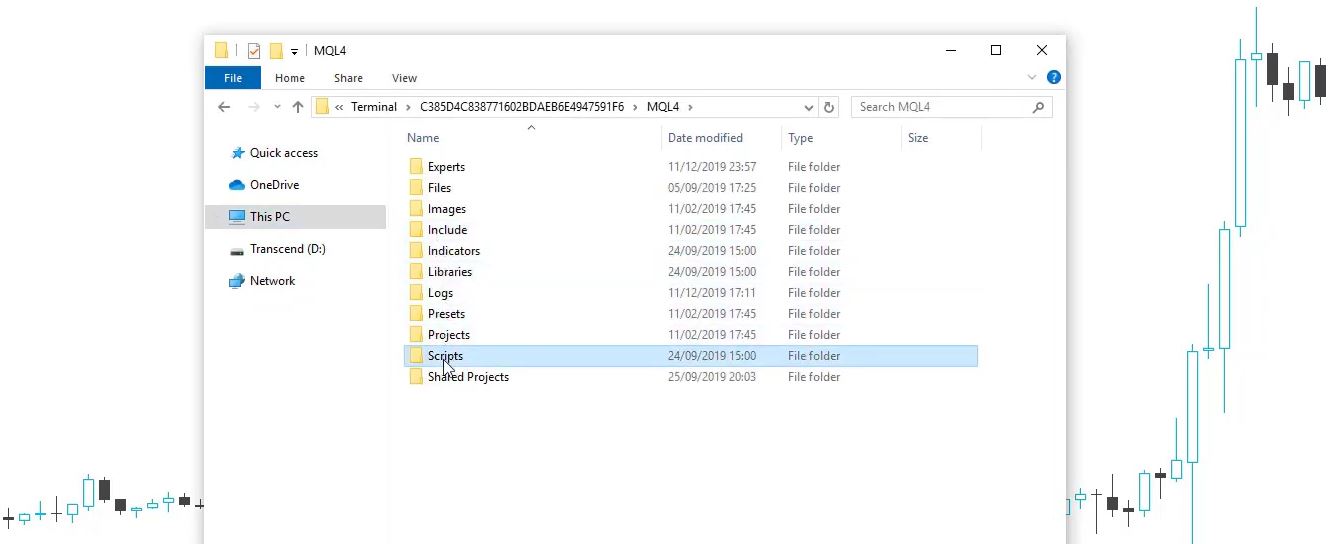
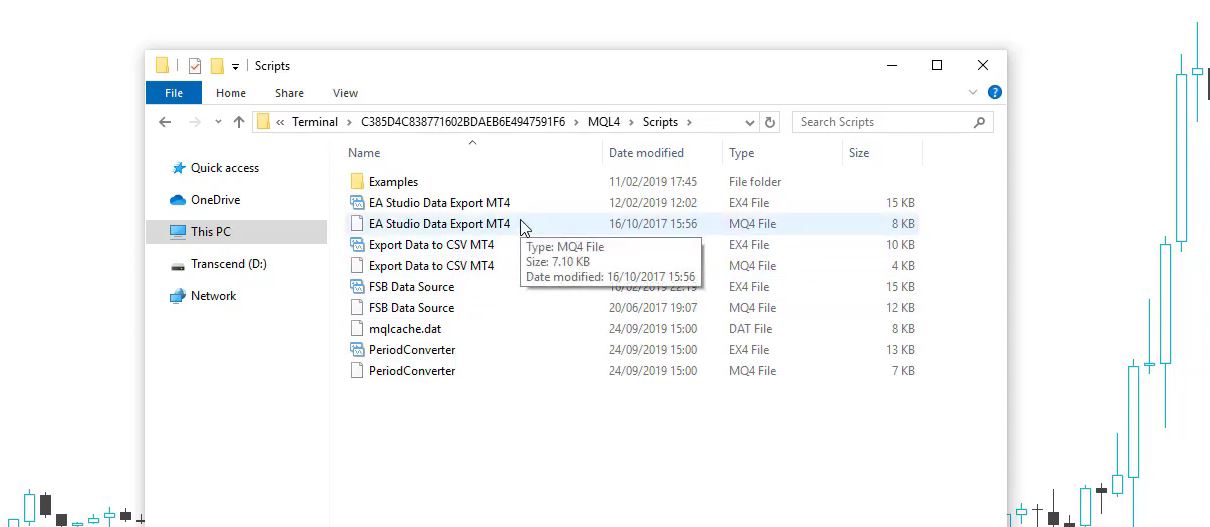
Here it is, EA Studio Data Export MT4. And, of course, if you’re using MT5, you need to paste the script for MT5. You will find attached both scripts to this lecture.
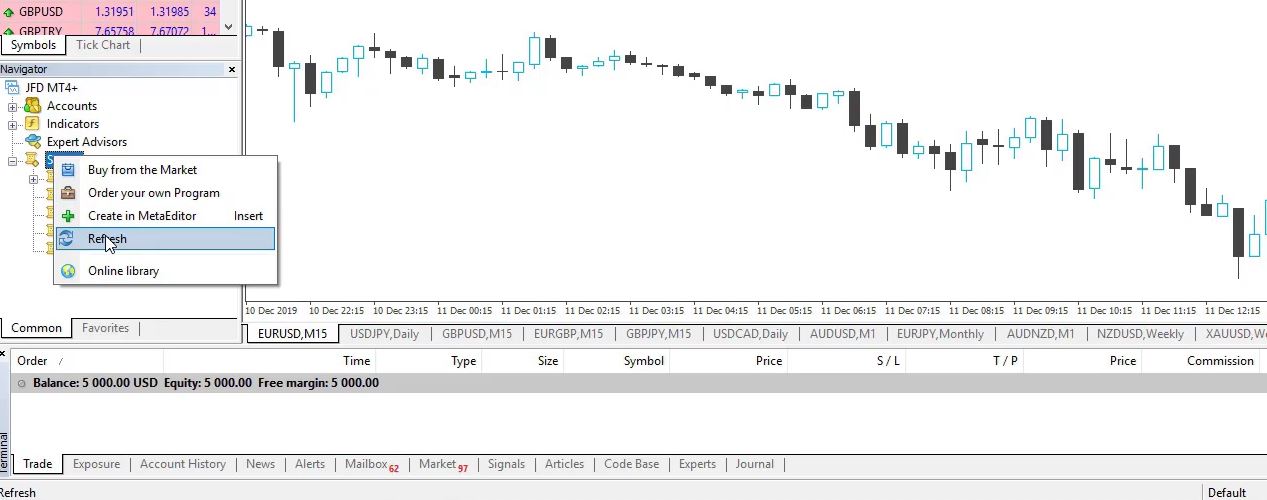
After that, close the folder, go to Scripts in MetaTrader, and click on Refresh. This will force MetaTrader to compile this script and you will see it displayed.
How to load the EUR USD historical data
And before I use the script, I will show you how you can take the maximum bars of your MetaTrader. If you install the platform for the first time, what you need to do is to press the Home key on your keyboard and hold it. Now, because I have done that already it’s not moving but if you install your MetaTrader for the first time and you press the Home key on your keyboard and you hold it, you will see that the chart is moving.
Basically, it will move very quickly and it will load more historical data. So do this for the asset you want to trade. If you want to trade EUR USD, just go to M1 first, press the Home key and hold it, after it stops moving, go to M5, and do this for all timeframes. You need to do this just one time in the beginning.
After that, with time you will collect more historical bars when the new data comes. Keep in mind that most of the brokers don’t provide a lot of historical data at the beginning which is very normal so the best way is to collect it with time. I don’t suggest you download the EUR USD historical data from your history center. So if you click on Tools you will see History Center.
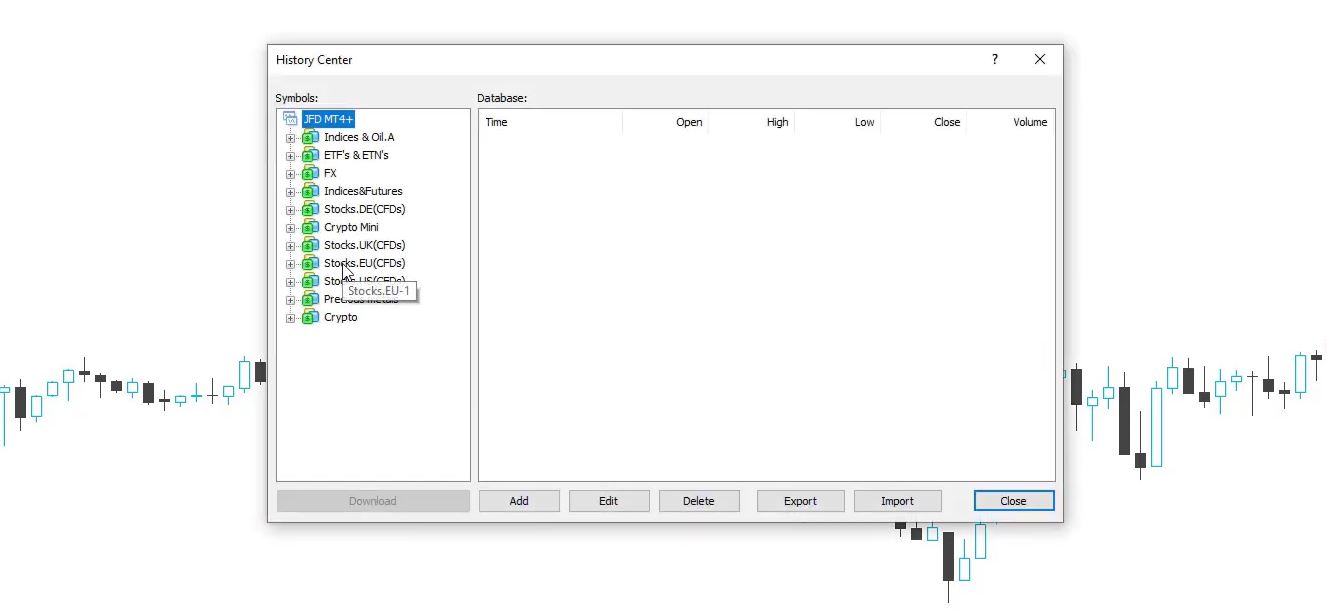
But if you download EUR USD historical data from here, you will see that this data is not actually from your broker.
When you install MetaTrader for the first time
So, for example, if I want to download the EUR USD historical data from the History Center and I double-click on it and I double-click on M1, it loads and I click on Download. You will see the message that pops up, “You are going to download data from the MetaQuotes Software Corp. history center but your account is opened on the JFD.” This is the broker I selected to use.
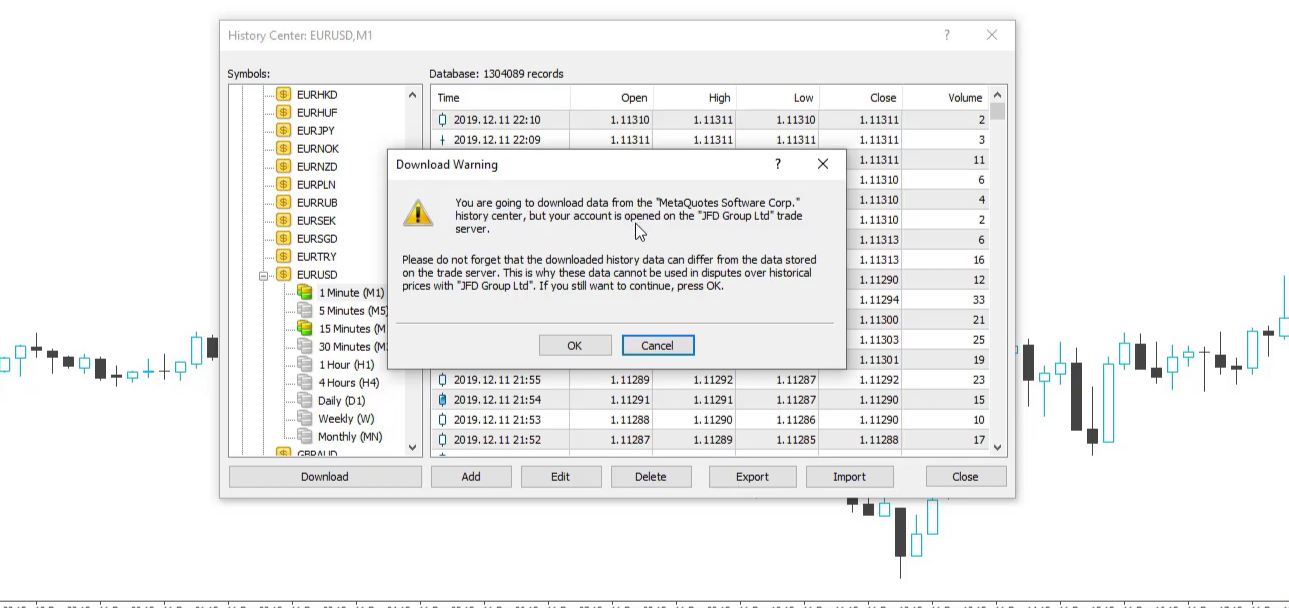
So they are warning you that you are not downloading the data you need. You are downloading the data EUR USD historical from the MetaQuotes Software Company which is actually the company that developed the MetaTrader platform.
What you want to do actually is to create the strategies over your historical data. Or if you are doing a backtest of any of the strategies, it is again a good idea to do it over the historical data of your broker.
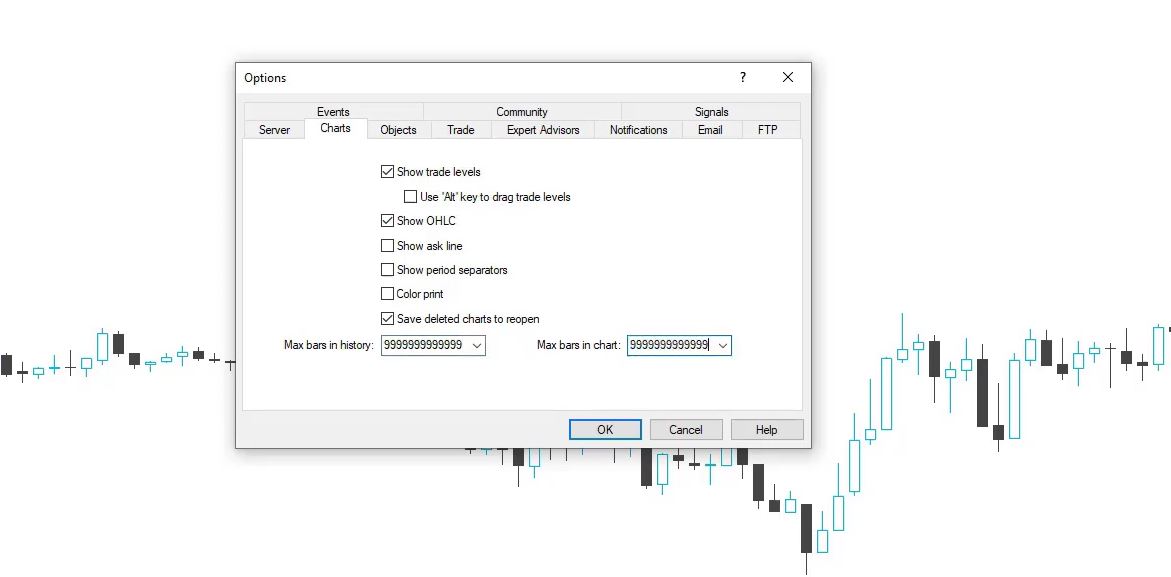
And one last thing about the data. If you install your MetaTrader for the first time you will hit the 65K limitation. So if I go to Tools and I click on Options, you will see in Charts that there is a 65K limitation and normally this is how you will find your MetaTrader for the first time when you install it. What you need to do, press 9 and hold it and then do this for Maximum bars in the chart as well, and then click on OK and you will remove this limitation.
Maximum count of bars
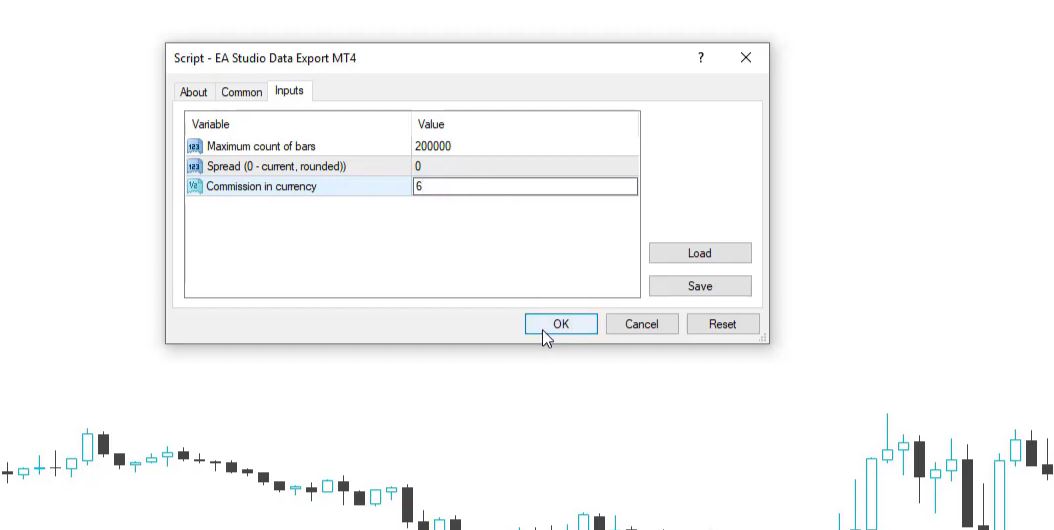
Press the Home key again, hold it, and it will load more bars, more than 65K. After that, go to the EA Studio Data Export MT4 script and drag it over the chart. You will see a small menu that will ask you for the maximum count of bars you want to export. Normally, I leave it to 200,000 but if you do it for the first time, 100,000 would be alright because you will not have a lot of bars at the beginning.
And then you have the spread. You can enter the current spread. At the current moment, it’s a little bit higher for EUR USD but this is because I am writing this lecture just after midnight and after that, it will go back to normal. And if you want to enter a value, it’s good. But normally, I leave it to 0 which will round it to the higher number.
So if I leave it to 0 and, for example, my spread with EUR USD is normally 3, 4, 5, this means it will round it to 10. And if you have a higher spread like 23, 24, 25 for any currency pair, it will round it to 30. So I leave it to 0 and here is the Commission in currency. For this broker, I have $6 of commission for each lot traded.
The JSON files
So I will leave it to 6 and I click on OK, and you will see what will happen.
On the left upper corner, I will see all of the EUR USD historical data exported.
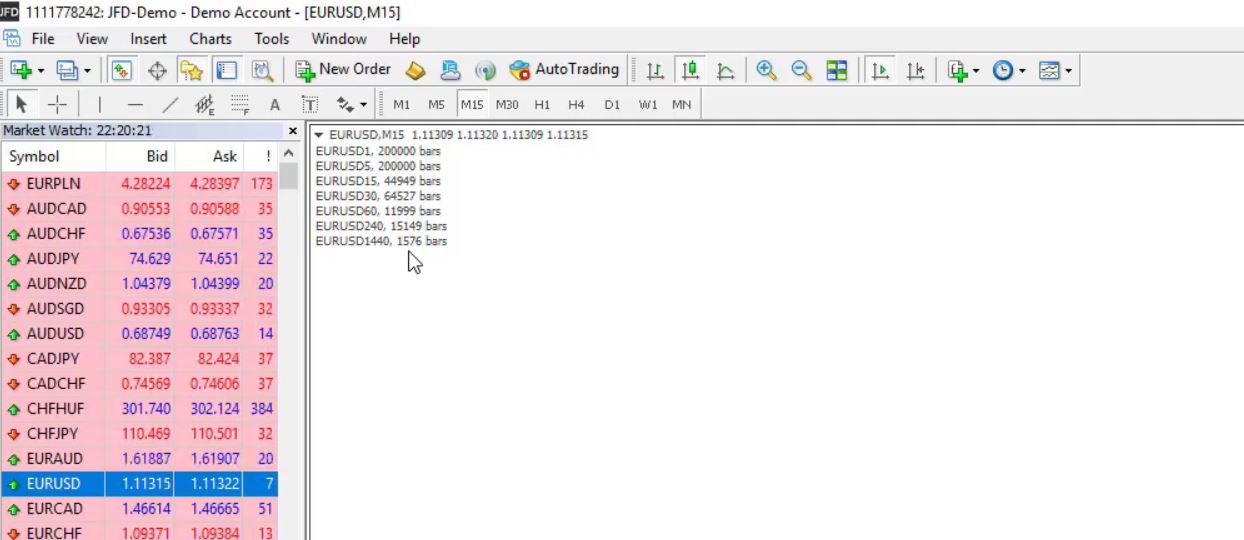
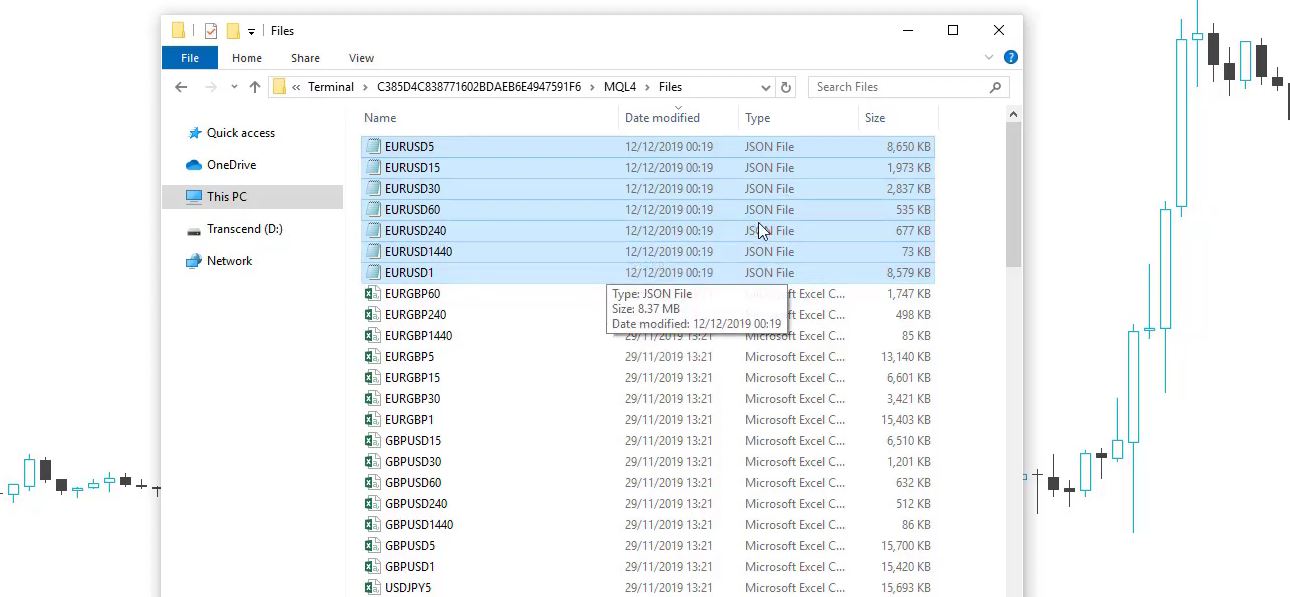
I have 200,000 bars for EUR USD on the M1 chart, the same for M5, and then for the rest, the number decreases. And EUR USD 1,440 is the daily chart. I have 1,576 days or bars. And after that, I need to go to File, Open Data Folder, and I go to MQL4, and then I go to Files.
This is the data I am looking for, these are the JSON Files that were just created.
And then I will open Expert Advisor Studio. I go to Data, and here is the drop zone. This is where you need to drop the EURUSD historical data files or you can just click to upload them. I normally drop them, so I just take them and drop them in the box.
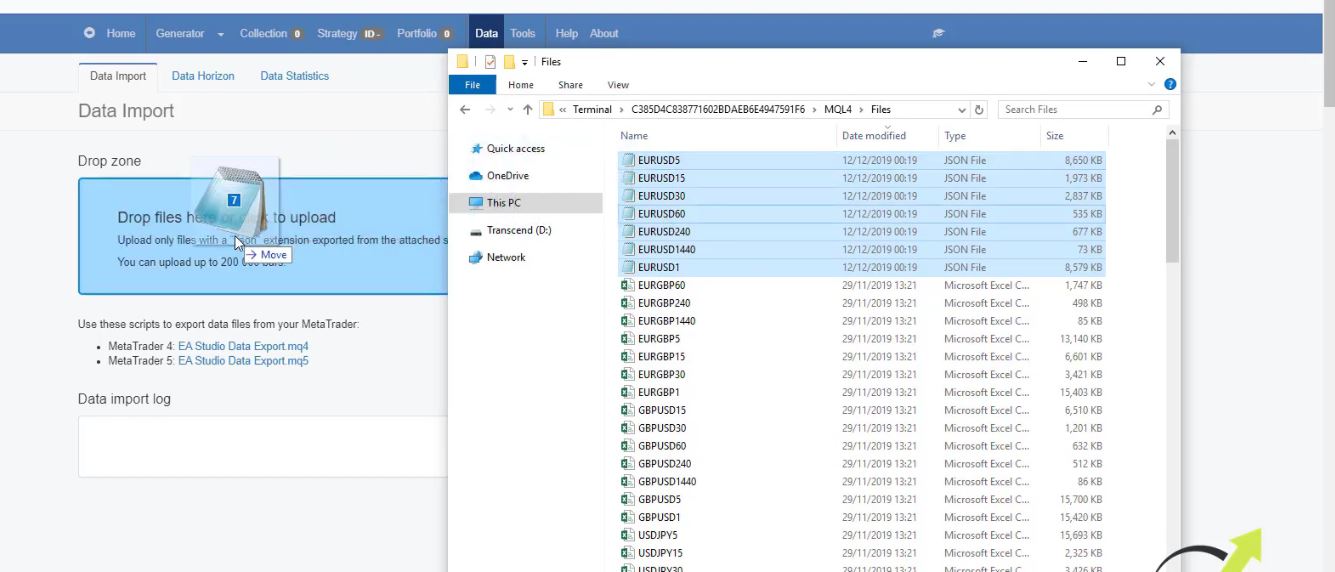
All the EURUSD historical data is imported and uploaded in EA Studio.
The Generator
So if I go to the Generator and I click on the data source, I will see the historical data, JFD Demo, EUR USD on M15.
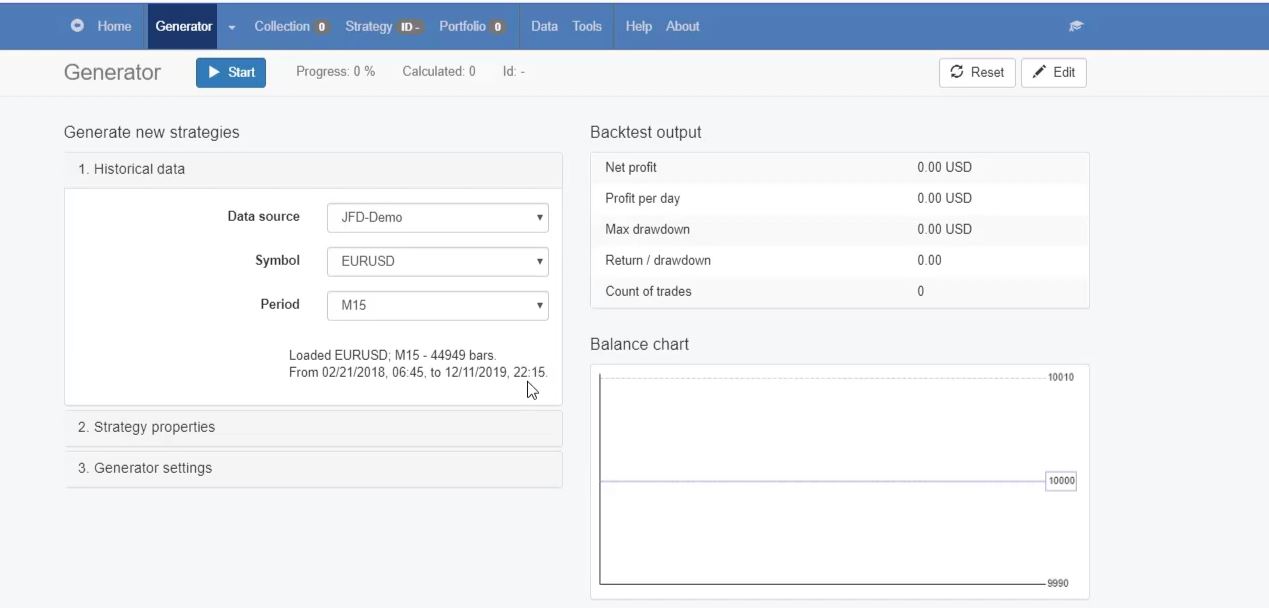
It is from the 21st of February, 2018 till the current moment. And actually, this is the timezone of the broker. For me, it’s just 15 minutes after midnight but you can see the broker uses GMT time. It is a little bit after quarter past 10 PM.
I have the EUR USD historical data and I am ready to use it and generate trading strategies with Expert Advisor Studio.
Resources:
Download EURUSD Historical Data with Historical Data App
One of the most common problems that beginner traders face when starting to use Expert Advisor Studio or during the free 15 days trial period is the lack of historical data from their brokers. This is why we came up with a solution called Historical Data App.
EURUSD Historical Data
This app was developed to give opportunities to the traders to download historical data for many different instruments for Forex trading, commodities, cryptocurrencies, and indexes. So, for example, if you want to download historical data for EUR USD in JSON or Excel CSV, select the symbol and choose the format that you need.
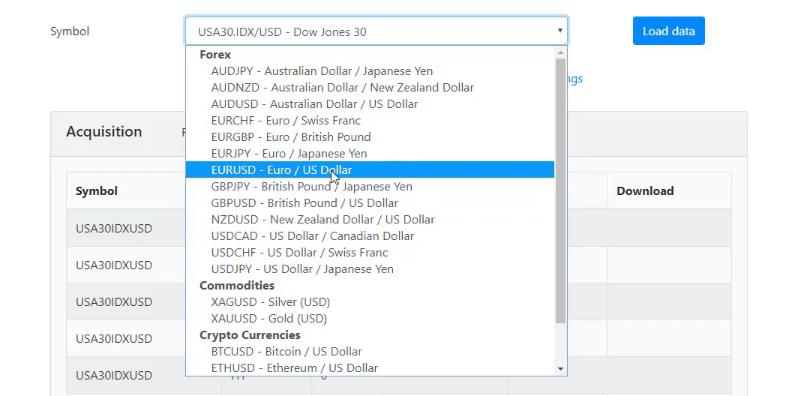
If you are going to use this data in Expert Advisor Studio select the JSON file format. For Forex Strategy Builder you will need it in CSV. If you want to import the data in MetaTrader select CSV, and if you need the EURUSD historical data for Excel then you will need CSV as well.
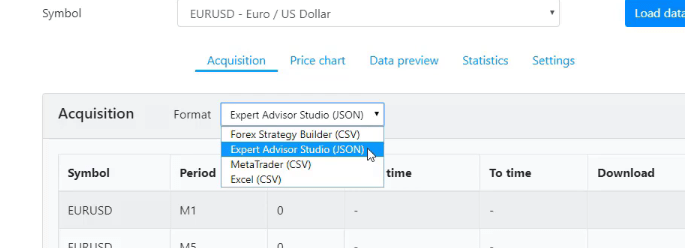
For the purpose of this lecture, I will show JSON files for Expert Advisor Studio and I will click on load data.
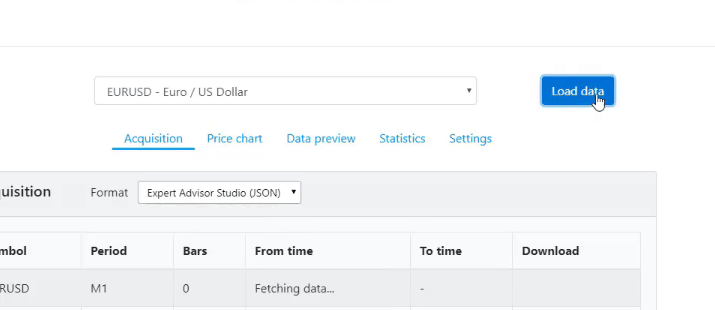
This is the fastest app for historical data that you can find online. As you can see below, very quickly, the data is loaded.
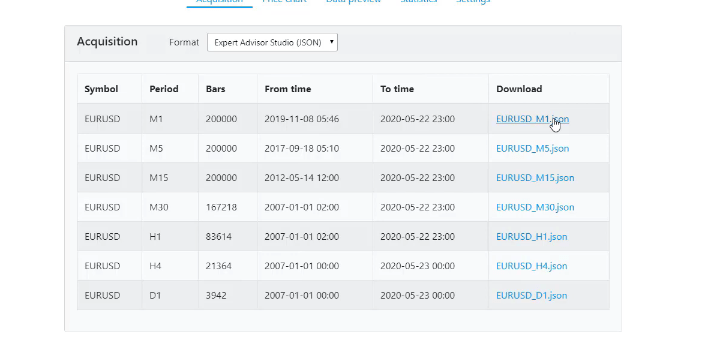
What is interesting with this app is that it converts the tick data to bar data and this is why it is so quick and the data is very accurate.
Dukascopy broker
The data comes from the Dukascopy broker which is known for its reliable historical data. And before I show you how to use this data on EA Studio, what more you can find on the page are tips and instructions on how to use the Historical Data App, how to import it in EA Studio, in FSB Pro, and in Meta Trader.
As well there are the symbols and some of the most frequently asked questions. Now, after you download the historical data, you will need to drop and drag it into the EA Studio. I will click on Software and go to Expert Advisor Studio. From there, click on Data and you will see the drop zone where you need to drop the files.
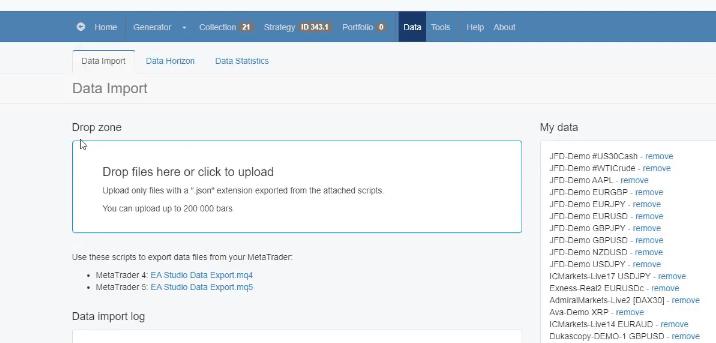
Just select them and drop them into this zone.
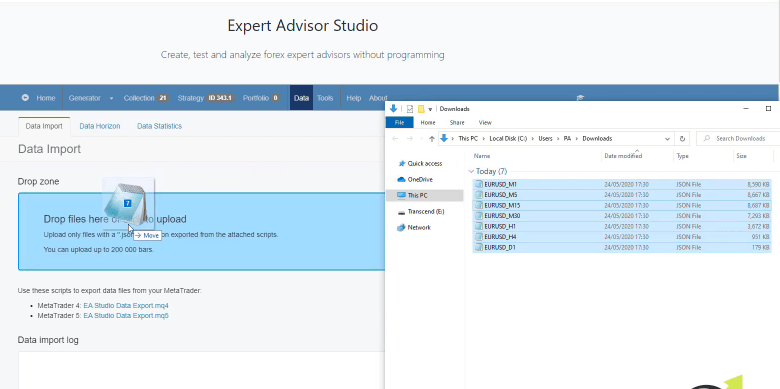
The data will be imported and uploaded. Now, go back to the generator and select the data. In this case, it is the second source that I have.
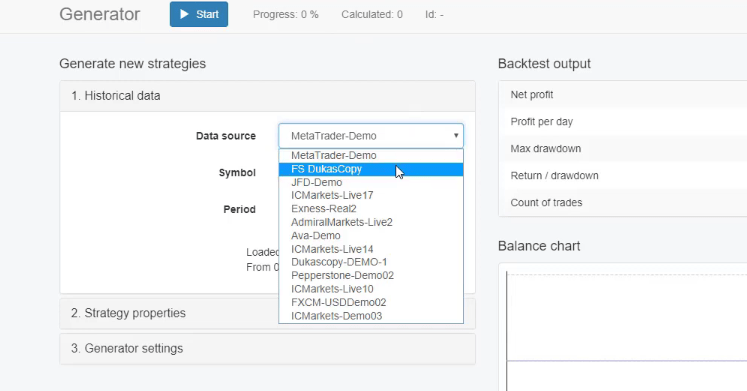
And now for the H1 chart, I have over 83,600 bars. If I switch the timeframe to M1, I will have 200,000 bars.
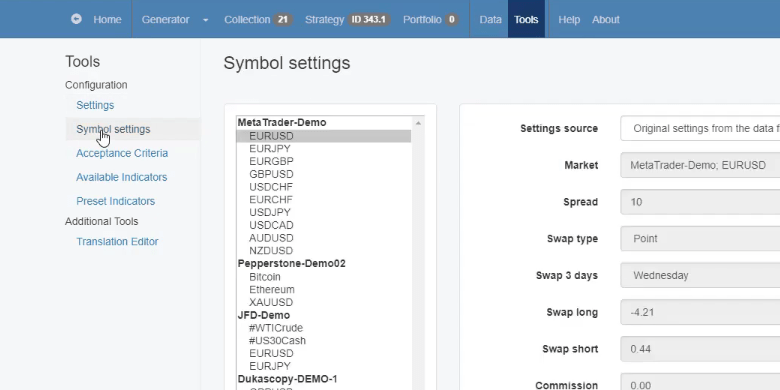
This is more than enough to generate robust strategies. Now, if you want to use this data for your broker you have the option to change the symbol settings in Tools. Click on Symbol settings and you will see that I can change any of the symbol settings.
Brokers have higher spread over the weekend
For example, I can change the EURUSD symbol settings for the historical data that I just have downloaded from the Historical Data App and import it into EA Studio. From the Settings source, just change it to Custom symbol settings and you will see that all of the fields become active and I can change them.
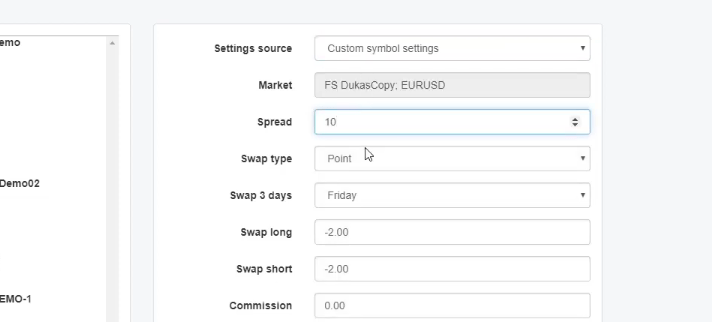
Now, for example, if I want to make this data suitable for the JFD broker, I will open the broker, I will open the MetaTrader from this broker, and I will click on the EURUSD specifications.
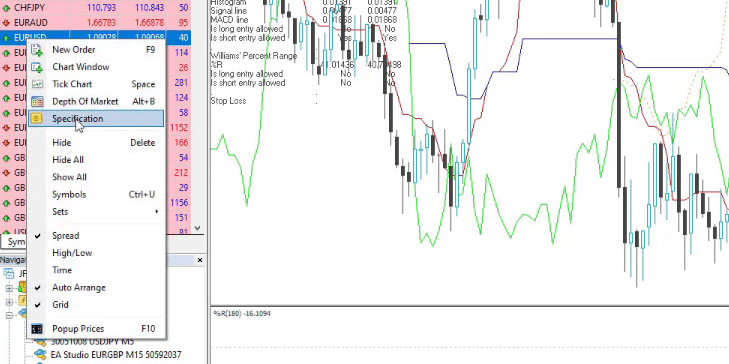
From here, I can see all the details that I need to know such as the swap.
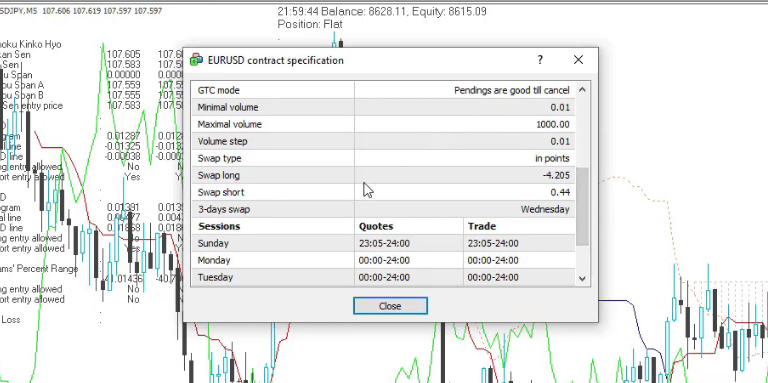
The spread for EURUSD is 10 points maximum, but just because it is the weekend it shows 40.
This is something important that you need to keep in mind. Usually, the brokers close on Friday with higher spreads. So if you are looking at the spread during the weekend, you will usually see a much higher spread than the usual values. So I will leave the spread at 10.
Swap type
As well, swap for 3 days, you can see that with JFD broker this is on Wednesday. And I have a Swap long of -4.205 and a Swap short of 0.44. Commission for the broker is $6 per 1 lot and the lot size is 100,000 and as well the point value.
The swap type which is on the 4th row is in points – Swap type, in points. So what I have done now is to change the symbol settings to be suitable for JFD broker even if this data comes from Dukascopy.
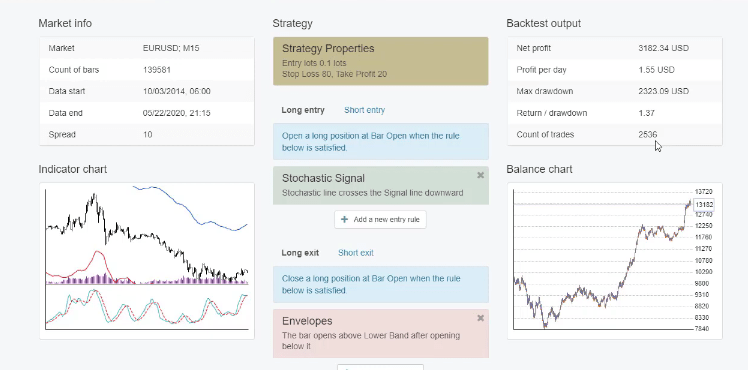
Now, if I go to Strategy, you will see an example strategy where I have the balance chart with the JFD data which is the one that EA Studio uses by default. So the Meta Trader – Demo data comes from the JFD broker. And if I change to Dukascopy, I have the very same result which is shown with the JFD broker.
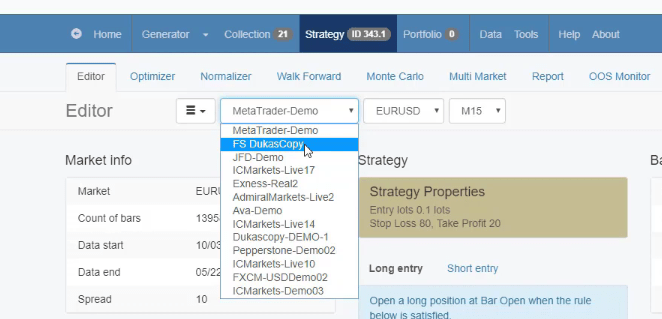
The balance chart looks different but it’s the same result because I have more EUR USD historical data for download. And simply, this negative part of the backtest was not visual with the JFD. So, one more time, if I go back to the MetaTrader Demo or the JFD data, you will see the balance chart which comes from approximately 2,500 count of trades or we have about 140,000 count of bars.
The importance of having many count of bars
With Dukascopy, I have 200,000 bars and 3,400 count of trades. And it’s the very same backtest but it shows me as well previous historical data which shows that the strategy was losing before that. And this is why it is very important to have many count of bars.
This way, you can see how the strategy has performed in the past. In this case, it is back to 2012 or this is about 8 years of time. And, one more time, if I change to JFD broker, you can see that this is since 2014. So this is how you can download historical data from the Forex Historical Data App.
And in Tools, go to symbol settings to make it suitable for your broker that doesn’t provide you enough bars to backtest strategies, it doesn’t matter whether on EA Studio, FSB Pro, or Meta Trader.
And the good thing with this historical data is that if I go to Data and I click on Data Statistics, you can see that this data from Dukascopy has maximum days of 3 which means that there are no gaps and missing days which is very common with most of the historical data which you will find with the other brokers.
Take a look at our Brokers page
There is an average gap of 1 point which is great. And you will see a lot more statistics with this data. So from data statistics, you can check first the data of your broker once you export it with the 2 scripts that are imported.
And if you have a small number of bars, as most of the brokers provide in the beginning around 65,000 to 70,000 which is not enough especially for the low timeframes, you can use the Forex Historical Data App and download more historical data which, one more time, you can modify and change the symbol settings to be according to the broker that you want to use.
If you are struggling to find a reliable broker, you can check our Brokers page where we have prepared some tips about the regulations, the costs, and the reviews which are very important when you’re choosing a broker.
As well, we have listed some brokers that we and many of our students and traders have tested.
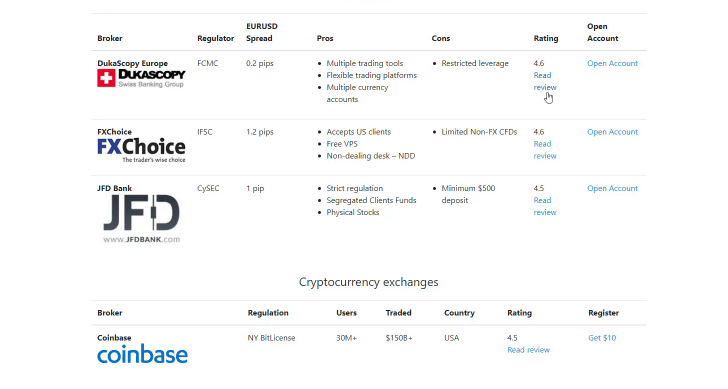
As well we have prepared detailed reviews about each broker which makes your choice easier when you are selecting a broker.
And keep in mind that it is a personal choice which broker you will use. We have brought the solution for the EUR USD historical data download with the Historical Data App. And in this lecture, I showed how you can make this data work for the broker you want to use.

