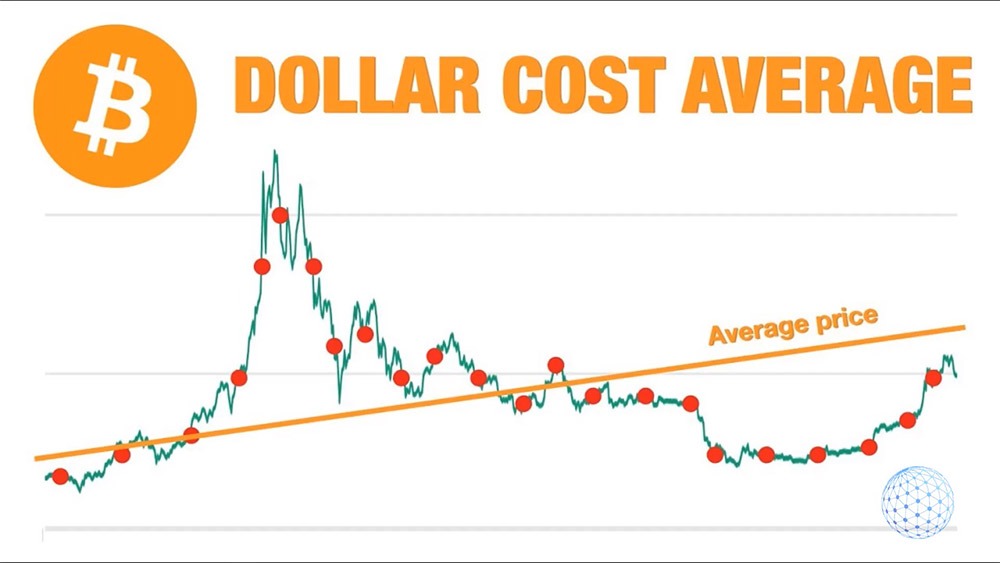
In this lecture, I will give you an example of a Bitcoin dollar cost averaging strategy if you are interested in investing and not in trading. Initially, this is a trading strategy so we buy and then we take quick profits, then we buy again, we take quick profits. But if you want to use it as an investment strategy, it works just great and I will share it with you right now.
Bitcoin Dollar Cost Averaging Investment Strategy
What I want to show you is that our simple Bitcoin trading strategy is actually very suitable if you are purchasing regularly Bitcoin or, in other words, if you’re using a dollar cost averaging strategy.
So for beginners, a dollar cost averaging strategy means that you are buying regularly Bitcoin. For example, you are just buying for $100 every week, every Monday, or you are buying for $1,000 every month. Or it could be less. It could be just $10 every week or every 2 weeks. It depends on how much you can afford, how much you want to put on the market.
Usually, the dollar cost averaging is suitable for very beginners who have no idea about indicators at all and they just buy every Monday, for example, or every first day of the month.
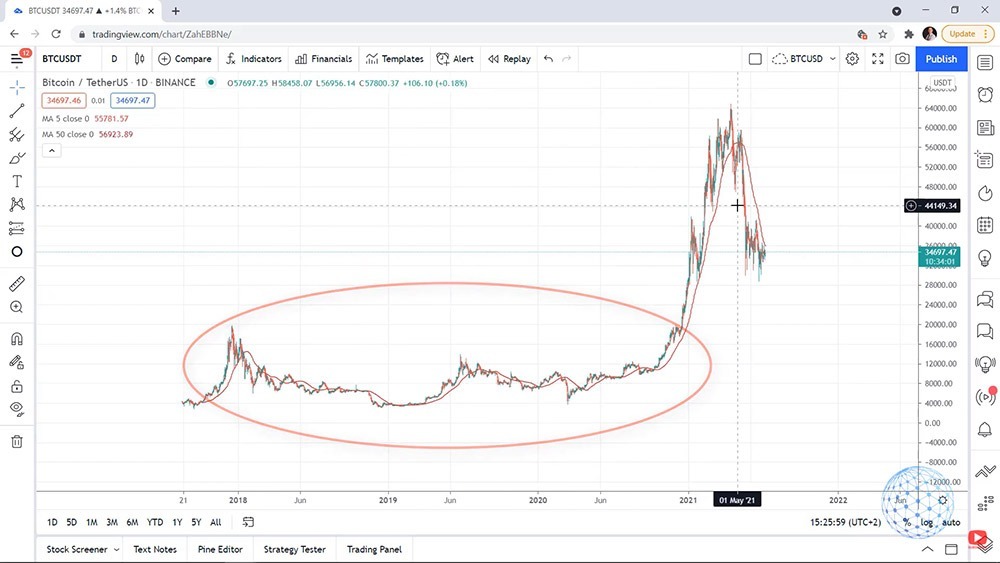
And in the long-term, the Bitcoin dollar cost averaging strategy is profitable until the moment. Because overall, the Bitcoin market went positive. There were declines, there were negative times, but overall, in 2021 especially, everyone who used the dollar cost averaging strategy during this time is in a huge profit. Because if you did it, you were buying Bitcoin at a much cheaper price where the market is today.
When to Buy an Asset
Now, with this Bitcoin dollar cost averaging strategy, you won’t be just buying every Monday or every first day of the month no matter where the price is. You will be buying whenever the market turns positive again.
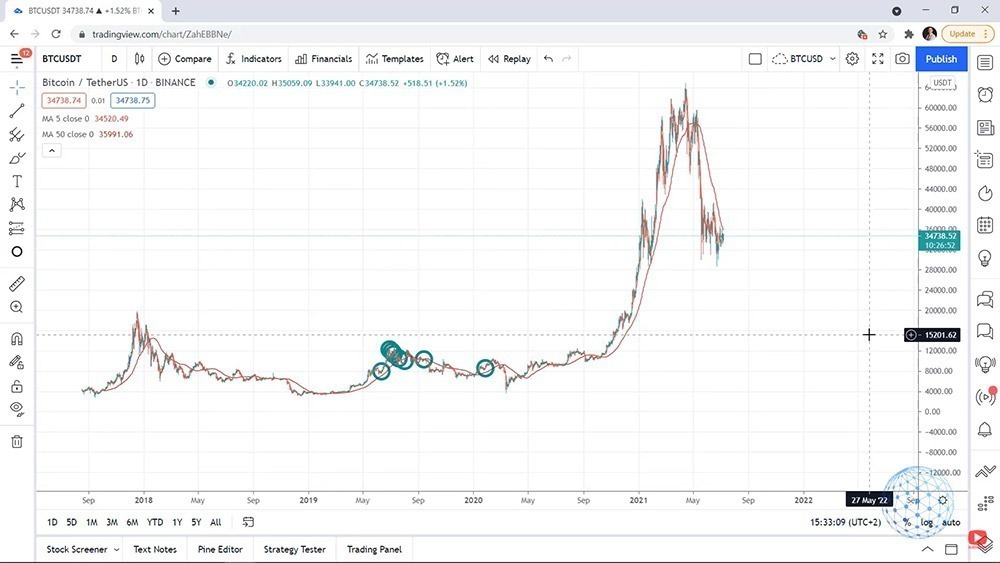
So let me go back a little bit earlier so we can have a market where the Bitcoin price is going up and down. For example, there is a period over in 2019 that was quite interesting because the price reached nearly $14,000. Then last year in March, because of the Coronavirus, it dropped down below $4,000. And after that, it reached record highs above $60,000 in 2021.
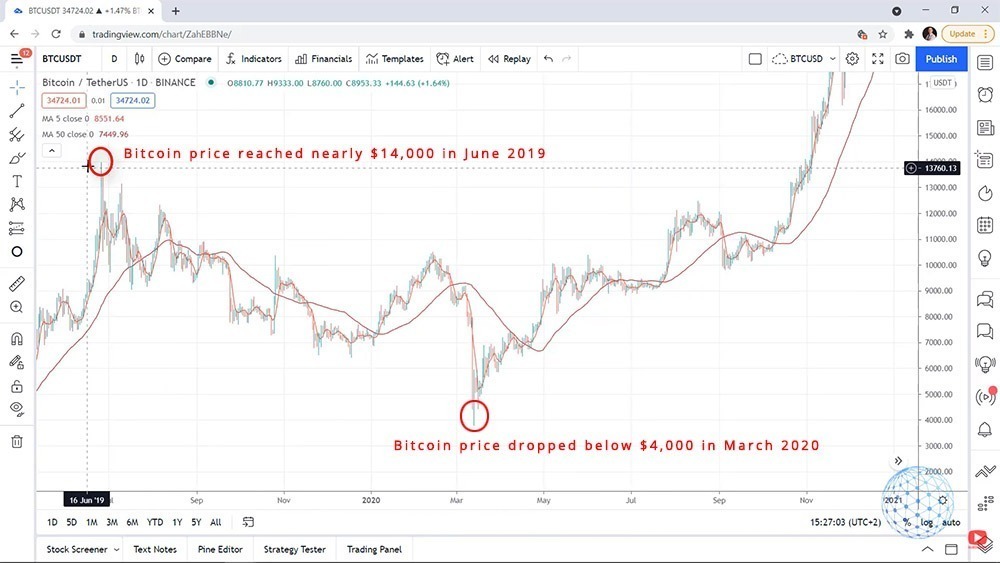
Now, how you can use this Bitcoin strategy and combine it with the idea of dollar cost averaging investing strategy? Let me zoom the chart just starting randomly somewhere from the daily chart.
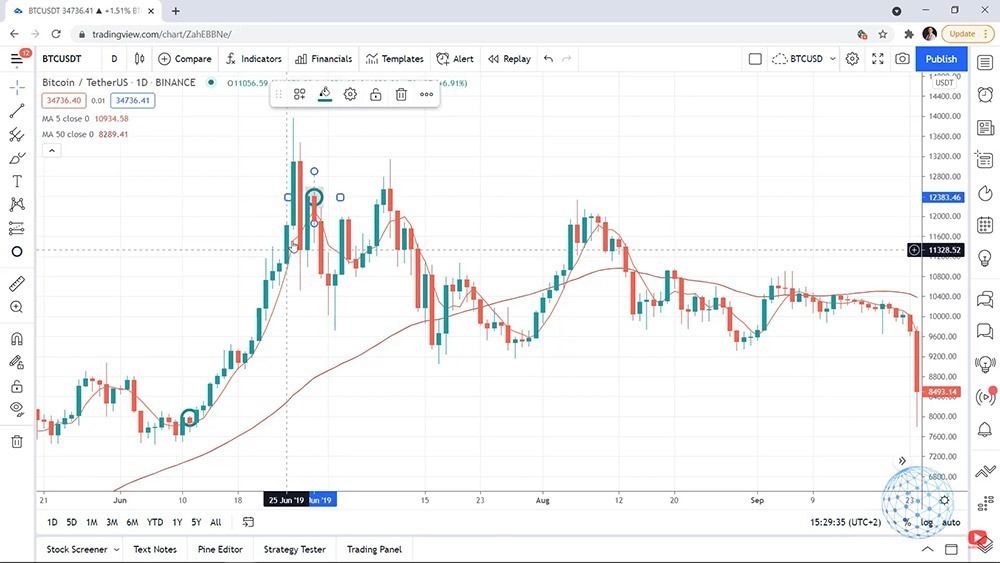
For example, let’s say that you got very enthusiastic right in June 2019, and you wanted to start buying Bitcoin and you are using our simple Bitcoin trading strategy. So you would be buying when the 50 Moving Average goes up. And at the same time, when we have a bar opening above the Moving Average with a period of 5. And below you can see an example entry. The market goes up and you buy.
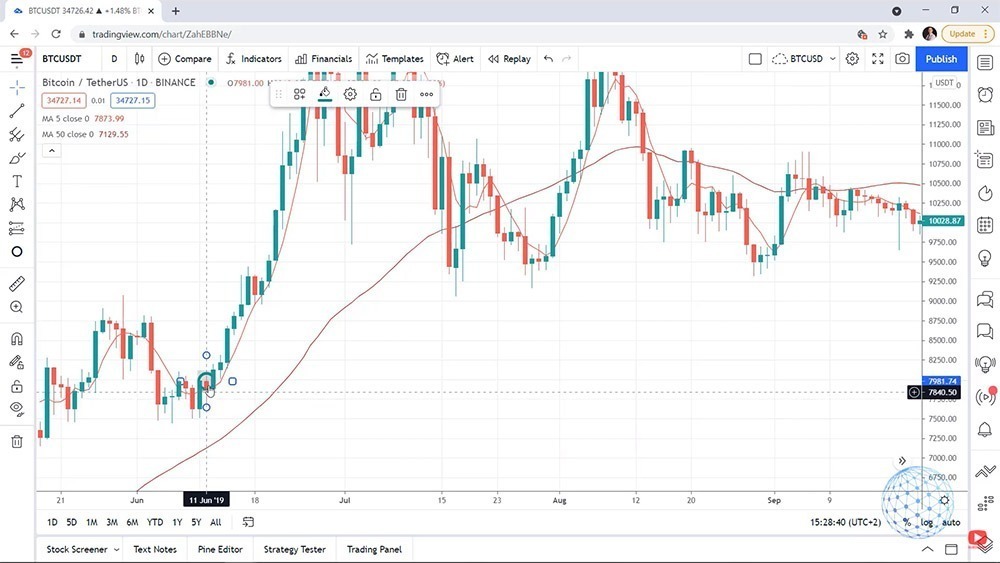
Let’s say, you buy Bitcoin for $100 when there is an exit condition, and what do you do? Nothing. You are investing in Bitcoin. This is what I’m talking about in this lecture.
If you are the type of person that wants to buy regularly Bitcoin and have it in your portfolio or invest some of your savings into Bitcoin, I will share with you how you can use this Bitcoin strategy for investing.
The first opening above the Moving Average
Then where is the next entry? On the image below you can see another opportunity to buy. The price was below, it went above on the first opening above the Moving Average, so we buy again.
And then where we have the next buying opportunity on the chart below. And then we have the next one. So we have 3 entries, and then the price went above, and then it went below. And you will see on the image below that here I have one more entry because we have a bar opening above the chart.
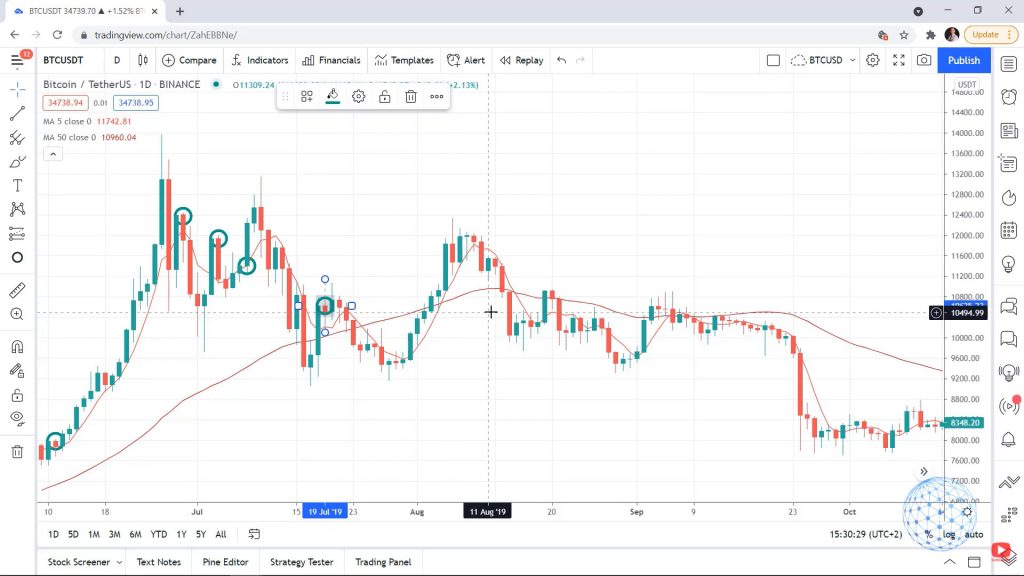
And I won’t make this lecture very long but you get my point. Every time we have the entry signal from the simple Bitcoin trading strategy, we buy.
Should you buy when the 50 Moving Average turns downwards?
And then on the image below, we may have one more buying opportunity. But should I be putting the circle there or not? I will give you a second to think about it.
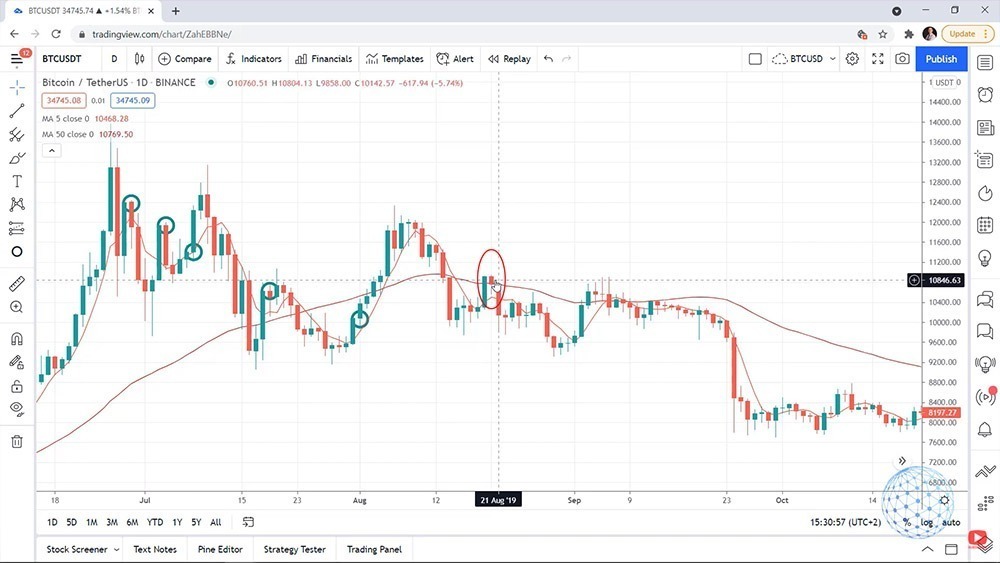
No, I shouldn’t be doing it because the 50 Moving Average turns downwards. It’s going down instead of going up and we are not buying during this time.
I think the next buying opportunity was on the opening of the bar on 13 September 209. On that day the 50 Moving Average goes upwards.
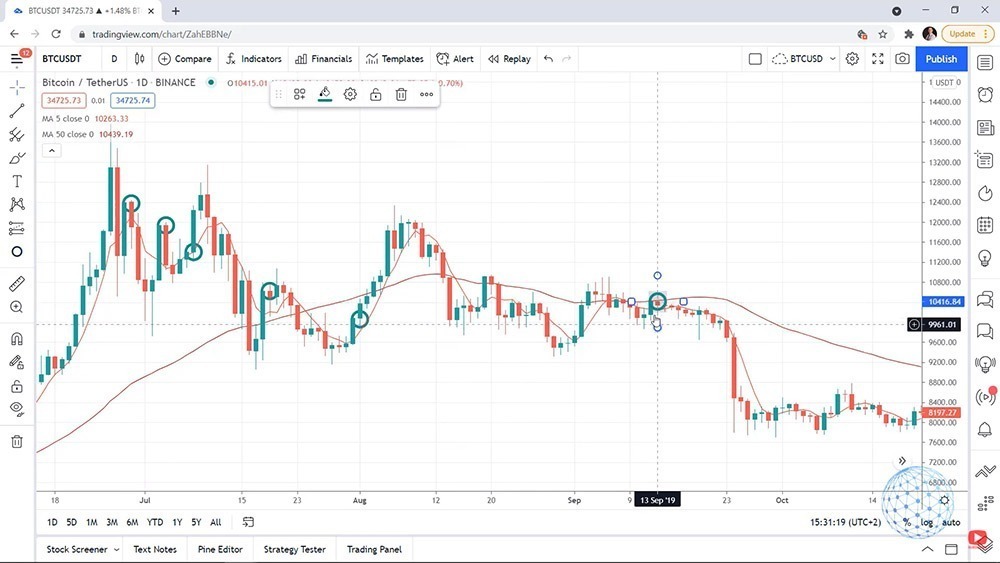
Then the 50 MA goes down until January 2020 and probably the first entry will be at the end of January 2020, right after the 50 Moving Average changes its direction upwards. I’ll be buying it right over there, on the 27th of January, 2020.
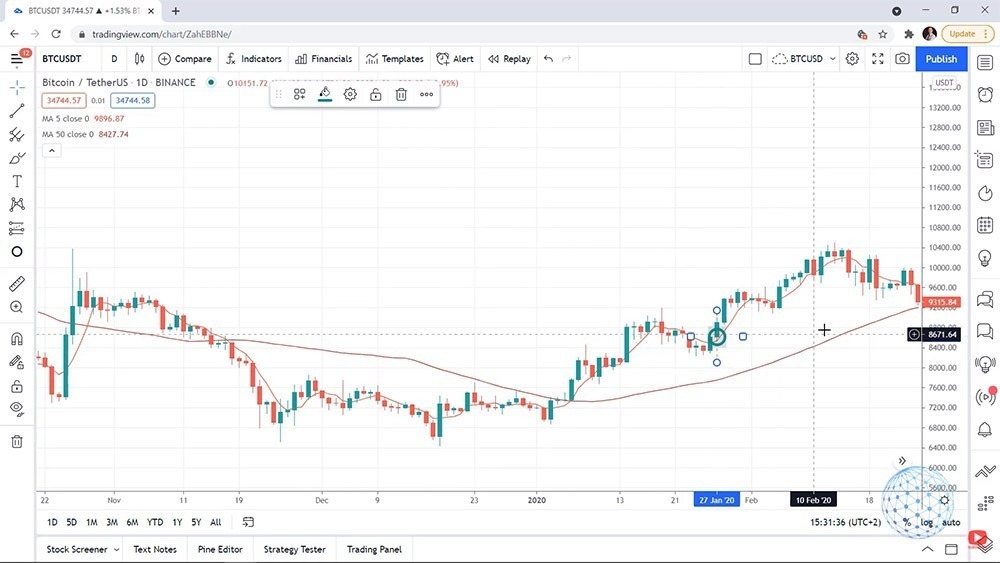
So this way, you will be buying only when the market turns positive and you won’t be buying when it’s negative. And in the long term, one more time, what we’ve seen so far from Bitcoin is that we have some great buying opportunities in 2019. And then you see that the market went very positive in 2021.
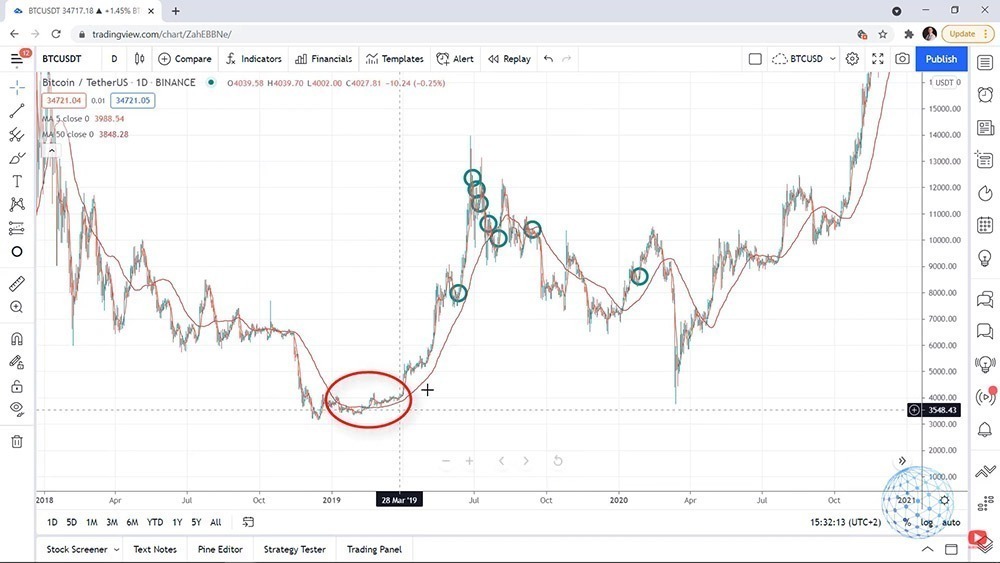
Investing in Bitcoin with the dollar cost averaging strategy
So this Bitcoin strategy, you can apply for investing purposes. And if you are a fan of the dollar cost averaging strategy or if you just want to buy Bitcoin from time to time, you can keep an eye on that strategy. Whenever you have the entry you can buy. In the long term, you would be profiting because Bitcoin has been on the market for over 12-13 years and this strategy proved to be profitable.
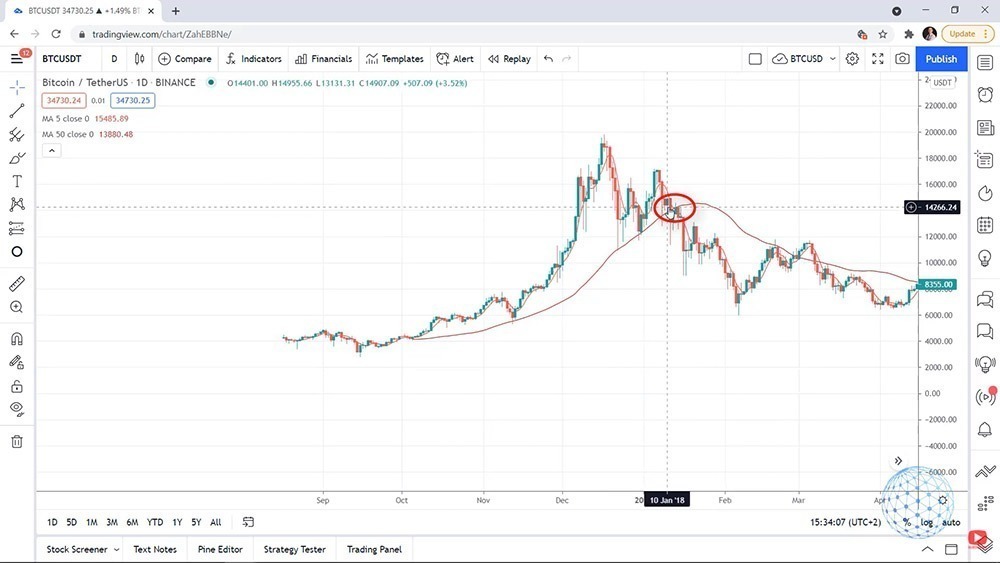
You will be buying regularly when you have the signals. Of course, at any moment when you are happy with the profits, you can take them. Especially when you have a huge move like in the image below. Then the 50 Moving Average starts to turn downwards, probably the best time to take the profits because we never know exactly where the top is. And taking the profit on the top or selling everything you have on the top is nearly impossible.
And if I zoom the chart back in 2017-2018, you can see a very similar thing. So even if you are selling Bitcoin at 11,000-12,000 when the 50 Moving Average starts to go downwards or when the 5 crosses the 50 Moving Average downwards, it’s a great sell signal as well. You can use this moment to sell Bitcoin and take profits because if you have bought it earlier, you would be definitely on profit at that moment.
My trading chart
So one more time, you can use the signals from the simple Bitcoin trading strategy to buy. And if I show you my chart with the dollar cost averaging strategy for Bitcoin where I’m buying regularly based on many things, not just on the 5 Moving Average, but I have a lot of drawing tools and trend lines and counter trend lines, which is the strategy that I explain in my Cryptocurrency Investment Strategy course, you will see how many times I have bought it.
The light blue points on the image below show where I have bought Bitcoin and you can see that when the market turns negative, I didn’t do it. I’m waiting for the new uptrend to come on the market.
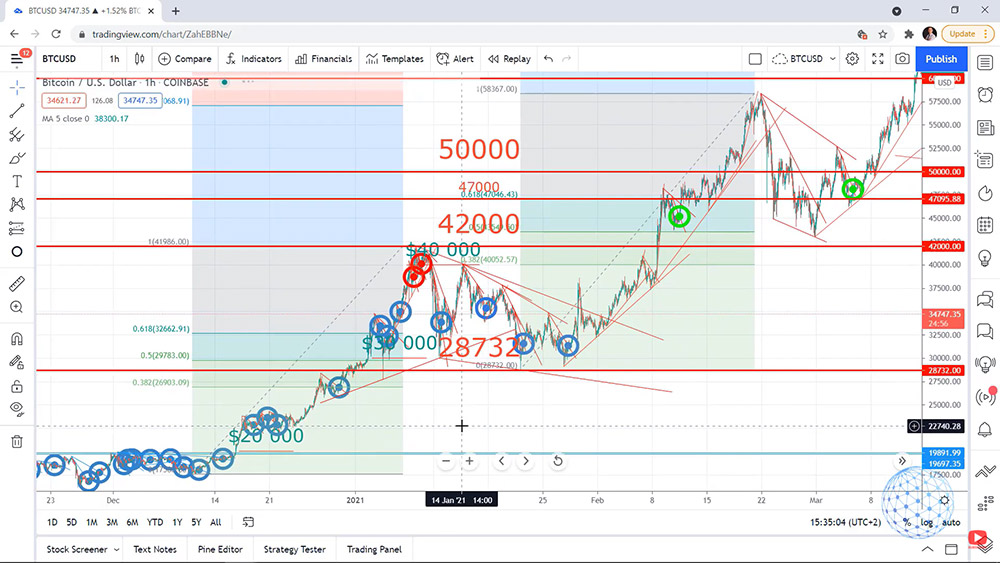
So this simple strategy will give you great entry points if you want to buy Bitcoin regularly and use it as a dollar cost averaging investment strategy.
I would be super happy if you practice and share with me and the other students where are all the entries during 2020. You can do it on any trading platform, not necessarily on TradingView.com, but you can put circles, arrows, whatever it is with all the entries.
Make sure that you understand the Bitcoin dollar cost averaging investment strategy and this way you will be convinced that you know what you’re doing. But even if you are not going to invest in Bitcoin but you like just to trade with a robot, by practicing you will just learn exactly which are the buy signals in the Bitcoin dollar cost averaging strategy.


