This beginner’s guide to technical analysis in trading will help you to predict the probable prices of the instruments that you’re interested in. The information presented here will help to guide your decisions. However, you should always exercise caution with every trade.
Many traders use fundamentals while trading. Despite that, the market price doesn’t always reflect these factors. Technical analysis uses historical data. In this way, it helps you to understand the market. You’ll trade more efficiently by using technical analysis.

How does technical analysis help you?
Technical analysis helps you to predict price movements. It does this by analyzing historical data. Typically, traders use different strategies with technical analysis. As such, the period that’s used for data collection varies.
Previous prices are frequently used for this type of analysis. Generally, traders who prefer technical analysis think that past price action is a reliable indicator of future price action.
Traders also look at changes in volume in order to predict price movements. For example, they pay attention when the market volume is low at a particular price. In that case, it’s unlikely that the price will quickly return to that level in the future.
All traders can benefit from technical analysis. Usually, this type of analysis will work with different types of securities. If you trade cryptocurrency pairs, you can use it. Similarly, traders who like stocks can also use it. However, the same strategy won’t work well with every type of security.
Which techniques does technical analysis use?
Technical analysis uses statistical analysis. Technical analysis charts help traders to identify signals. Typically, these signals tell them when it might be a good idea to enter or exit trades. Charts also help you to pick out price patterns.
Technical analysis also uses behavioral economics. In other words, it looks at how psychology affects decisions. Generally, the choices that traders and financial institutions make cause prices to change.

Technical analysis is based on the premise that the collective actions of traders reflect what’s really happening with a security. These actions are buying and selling. Usually, the price of the security is thought of as fair. This is because it’s based on the actions of buyers and sellers.
Why does technical analysis work?
Technical analysis helps you to understand why changes are happening in the market. It gives you a window into market psychology. In most cases, traders who understand psychology can quickly spot opportunities for profit.
Technical analysis charts may seem confusing at first. The price patterns might be overwhelming. However, when you understand why the price patterns form you will become a better trader. Usually, you’ll be able to consider what might happen next.
Technical analysis is not a crystal ball. There isn’t a guarantee that price will always move in the direction that it seems to be going. Using several technical indicators helps you to make your own choices with more confidence.
Does technical analysis replace fundamental analysis?
Traders use both fundamental and technical analysis. They complement each other. Generally, one can’t completely replace the other. Technical traders usually have a good understanding of fundamental analysis. As such, they apply its principles to every trade.
Fundamental traders frequently conduct technical analysis of the financial markets. A fundamental trader will use fundamental analysis to decide whether they should enter a market. After that, they use technical analysis strategies to decide when they should enter the market.
Fundamental analysis tells you what to buy. Usually, technical analysis is a better indicator of when to buy. Traders can use it to find price points that are ideal. After that, they can enter the market at any of these price points.
Technical Traders Must Maintain Objectivity
Above all, a trader who is using technical analysis must be objective. Likewise, they should always develop a plan and stick to it. You can’t allow second-guessing to distract you from your plan. Stick to your strategy.
In conclusion, if you’re objective, you won’t get caught up in the emotions of the market. Disciplined traders always stick to the trading approach that they’ve chosen.
Choose your Broker Wisely
Generally, a good broker can help you to be successful with using technical analysis. Select a broker with fees that meets your needs. Most of the time, high commissions can cut your profits. Typically, they also affect the strategies that you can use.
In addition, brokers should offer platforms that match your strategies. All trading platforms don’t offer the same tools. However, the platform that your broker uses should provide technical indicators and tools that you are comfortable using.
Utilize Free Trials
You can utilize free trials. Some brokers offer 7 days free. Others give 14 days free. You’re free to cancel without charge before the trial is up.
Furthermore, free trials let you test all the features that a broker provides. For example, they might have text alerts. Free trials let you see how well these work.
In the same way, test their customer support. Always do that during the trial period. Test it at all hours of the day and night. By doing so, you’ll learn exactly what you can expect from customer care if you have problems with a trade.
Which approaches to technical analysis do traders use?
Two approaches are commonly used by technical traders. One is the top-down approach. The other is the bottom-up approach.
Your approach will often depend on how long you plan to stay in the market. Short-term traders often prefer a top-down approach. They look at the overall market and then focus on individual securities. In conclusion, they prefer short term gains.
On the other hand, long-term investors often like a bottom-up approach. Usually, they focus on individual cryptos. In conclusion, they take a long-term view with regard to entry and exit points.
Develop your Trading System
Each trader should develop a trading system that they’re comfortable with.For example, some traders may choose to track moving averages. In this case, they’ll need to know what it means when one moving average crosses the other. Signs of an upward trend will tell them that it’s a good time to purchase an instrument.
Always backtest your trading strategies. It’s important to know how they would have performed in the past. That way, you can make adjustments as needed.
Several brokers offer demo accounts. These let you test your strategies in a virtual environment. You should always try to do before you invest real capital.
Select your Securities
Some strategies only work well with volatile stocks. If you intend to use these with a security that’s not liquid, you won’t get the results that you’re looking for.
Always Start Small
You should always start small. Traders are sometimes so confident in their strategy that they mediately invest large sums of money. However, even if you’ve been testing your strategies in a demo account, you should always prepare for the unexpected.
Starting small helps you to build confidence. When you switch from a demo account to a real account, you’ll change many elements, including the margin that you can trade with. Your emotions will also come into play. Start small and give yourself time to learn.
How do technical traders use price charts?
Price charts provide technical traders with historical data. Traders use price charts to get an idea of future price movement. There are no guarantees when you’re using a price chart.
Price charts vary in terms of their time frame.
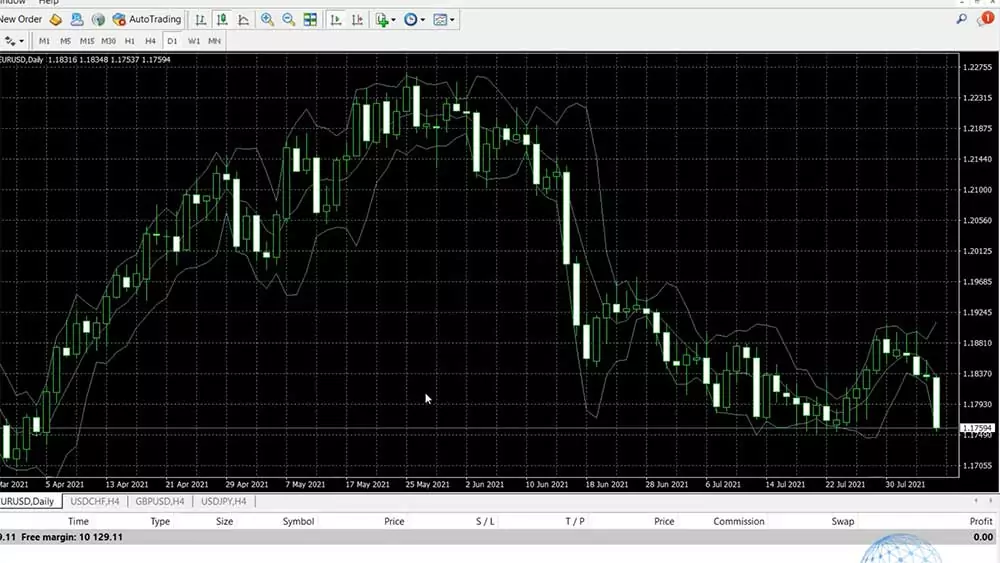
This variable is important. Security might not seem to display any fluctuations in price over a long time frame. However, the same security might display rapid changes in price over a 10 minute period.
You can set a time span that’s as short as one minute. Time spans of a year are ideal for long-term investors. Popular time spans include five minutes, four hours and 24 hours.
Choose Time Frames that Complement your Trading Style
Traders choose time frames that match their trading style. Intraday traders often look at time spans of five or 15 minutes. This is because they will open a trade and lose it on the same day. They open and close several trades during a single day.
Some traders like to hold positions overnight. They may even do so for longer periods of time. They prefer to look at time spans of four hours or even a week. Traders use several technical indicators with each price chart.
Candlestick Charts
Candlestick charts are popular among technical traders. These charts are used for stocks, currency pairs and several other securities. Many traders like to use them. Every single candlestick provides a wealth of information.
A candlestick is formed for a specific time period. It reflects the price action during that time period. For example, it may reflect what happens with price over a 10 minute period. It depends on what type of chart you’re looking at.
Suppose that you’re looking at an hourly chart. Each candle stick on that chart will reflect the price action for one hour. It’s an easy way of understanding price movement over an hour, four hours or even a week.
What does each candlestick tell you?
A candlestick’s highest point shows the highest price that the security was traded for. It specifically applies to that time period. For example, if the time period on your chart is 10 minutes, the candlestick’s highest point gives you the highest price that the security was traded at during that 10-minute interval.
The lowest point of a candlestick tells you the lowest price that the security was traded at. It applies to that specific period of time. If you want to know the lowest price for another period, you’ll have to look at another candlestick.
Each candlestick has a body. This body tells you the opening and closing prices of the security. The body is thick. Candlesticks on each chart are usually displayed in one of two colors.
For example, some of the candlesticks may be red. The others may be green. The color of the candlesticks is important. One color tells you that the closing price was higher than the opening price while the other tells you that the closing price was lower than the opening price.
The colors save time. Just one glance tells you whether prices closed higher or lower. You can check that quickly at the end of any time period.
Candlestick Formations and Patterns
Technical traders take the time to learn about common candlestick formations. These patterns give them clues about what’s happening in the market. There are dozens of formations and patterns. Traders who learn all of these can use them well.
Dojis are candlesticks with a flat line as their body. This is because the opening and closing prices are the same. Dojis are a sign of indecision in the market. They indicate that the trend might change.
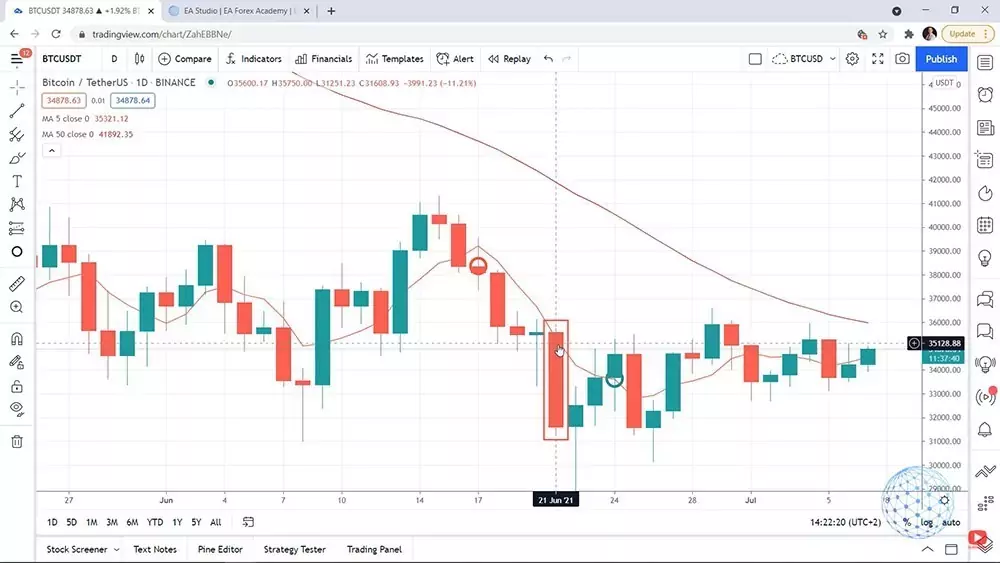
Moving Averages
Moving Averages are popular among technical traders. In fact, they are one of the most popularly used technical indicators in the world. Several trading strategies using moving averages. A single moving average can be helpful. However, many traders use more. Price is usually compared to moving averages.
For example, a trader may decide to buy security as long as the price remains above a particular moving average. If price drops below that moving average they will sell. Traders sometimes choose to use a crossover strategy.
In this case, they may have a 10-period moving average and a 50-period moving average on the same chart. They’ll buy when the 10-period moving average crosses above the 50-period moving average.
Pivot Point Indicators
Pivot point indicators show traders where there are support and resistance levels. Traders need to identify these levels on the chart. The levels are useful because they tell them when it’s possible to enter or close trades.
Fibonacci Levels
Fibonacci ratios are used during sustained trends. They help traders to pinpoint opportunities. Technical indicators can load Fibonacci levels onto your chart automatically. Fibonacci retracements are one of the most popular Fibonacci indicators.
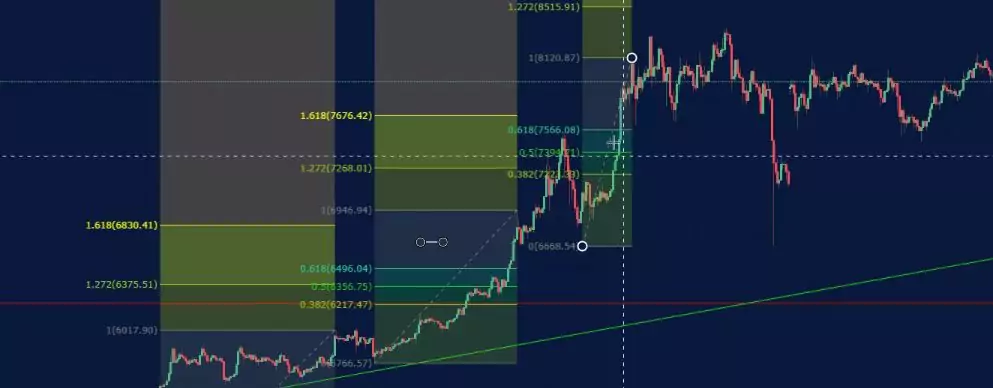
A sustained uptrend or downtrend will often be corrected. When this happens, it is retraced in the opposite direction. Fibonacci retracements help you to identify low-risk entry points during this type of retracement.
Momentum Indicators
Many technical indicators give you information on market direction. Momentum indicators give you information on market strength. They can give an early signal that a trend will soon end.
There are several momentum indicators that are popular among traders. These include the Relative Strength Index (RSI) and Stochastic Oscillator.
Typically, traders used several momentum strength indicators to guide their decisions. For example, during a sustained uptrend you may be wondering when would be the best time to sell. Usually, if two momentum indicators show that the trend is slowly losing strength, it may be time to take profits.