Stochastic oscillator indicator – the key indicator among the Oscillators in Meta Trader.
Stochastic oscillator indicator is one of the preferable indicators from many traders. It shows the overbought and oversold market, which is very useful. This makes it suitable for a range market, which is the hardest for trading.
In this article, you will understand how the oscillators work and how you can build Stochastic oscillator EA without programming skills. Many traders think that algorithmic trading is difficult because IT skills are required, but this is not the case anymore. But now you will learn how you can create not just Stochastic EA, but any other you think will bring you profits. And we will show you realistic backtest and results from stochastic EA, and you will see how you can analyze such an Expert Advisor.
If you want to build a stochastic indicator EA, it is better to combine the indicator with different indicators. This way, you will filter the entries better, and you will get stronger signals for your trading.
Our advice is not to ”fall in love” with the stochastic oscillator or any other indicator.
Many traders do the mistake to like so much one indicator (many times that is the Stochastic oscillator) and they do everything to go around it. Even their strategy is losing, and they add different indicators, remove indicators, change the Stop Loss and the Take Profit, but they do not remove the stochastic oscillator. They just believe it is a profitable indicator because they read it somewhere.
All indicators are useful if they are combines properly. So let’s get started with some basics, and you will learn how to create a profitable strategy.
For the very newbie traders, I will explain what the indicators are and how they are useful in Trading. So if you are advanced Trader and have an idea about indicators trading platforms and Forex trading, you can skip these sentences.
Once you decide to trade on the Forex market, you need to have an account with any broker. The broker provides us with access to the real market and allows us to trade. Once we open the account and stole the platform, we need to know in which direction the market goes.
If you look at the charts, you will not have an idea of whether to buy the asset or to sell it. This is where the indicators as the stochastic oscillator indicator come very useful.
There are different formulas behind each indicator, and they are based on the price. Most of the indicators use the information that we get from the candlesticks.
Also, any EA that we build, does not matter is it Stochastic oscillator EA, is it MACD EA, or any other, the EAs are made over the Historical data which is exactly the data from the candlesticks.
What information do we get from the candlesticks?
- Open
- Close
- High
- Low
Most of the indicators are invented during the last century, and they are beneficial till today. The best results are coming when the trader combines a couple of indicators.
Below in this lecture, you will learn how the different indicators work and what signals they provide. And in the MetaTrader course, you will learn how to build strategies using various indicators at the same time.
Now, in this article, I continue with the second part with the Oscillator indicators that we have in MetaTrader. So in the previous lecture, we went to the first seven indicators, and now we are going to the eighth one, which is…
The Momentum.
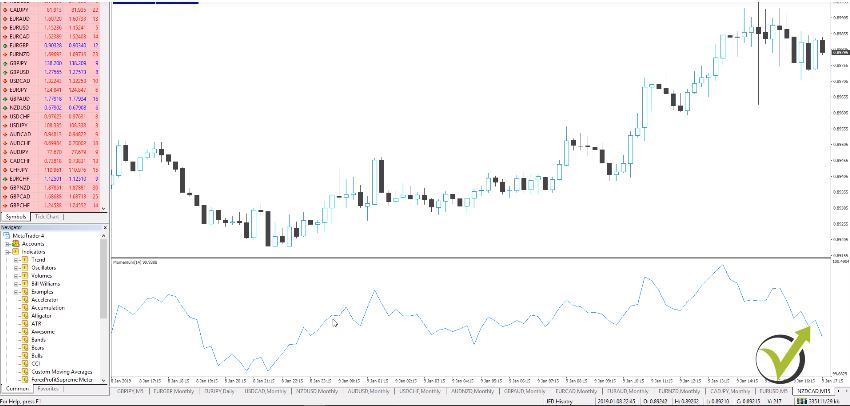
Which is pretty famous I can say a pretty standard indicator in Forex trading.
When the Momentum indicator gives a signal for price change?
- when it changes a direction and starts to rise it provides us with a signal that we need to buy
- when it reverses, and it goes down it’s a signal that we need to sell
Usually, the extreme high or low points are signals that the trend will continue. With the stochastic oscillator indicator, we have the over-bought over-sold areas.
This means that the indicator shows us when the price might reverse. While with the Momentum, we can expect a continuation of the current trend.
The moving average of Oscillator.
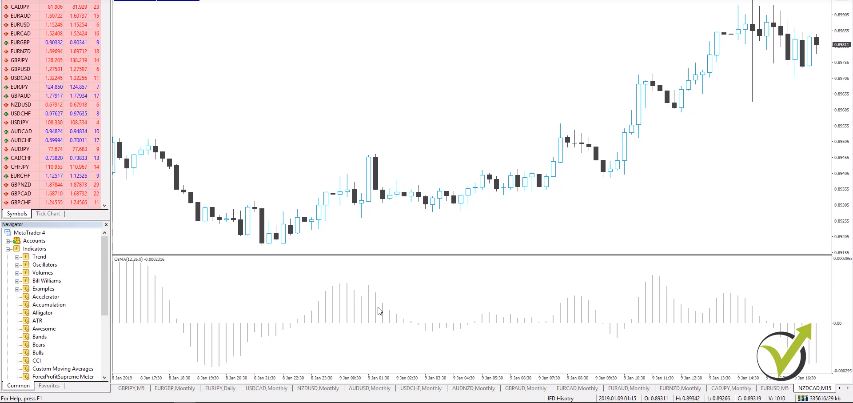
It’s just right here Moving average of Oscillator. I will click on OK, and you see it’s very, very similar to the MACD, but we don’t have the signal line over here. It’s just displayed in a very, very same way. And the Moving Average Oscillator is calculated as the MACD line minus the signal line. So we can say it is the difference between the Oscillator and Oscillator smoothing.
It is a different approach from the Stochastic Oscillator Indicator.
So, moving average convergence divergence or the MACD baseline. Which I said is the one connecting the bars is what is being used here as an Oscillator. And the signal line is the smoothing. So the Moving average of Oscillator is one more time the MACD minus the signal line or one more time we can say it’s the difference between we the Oscillator and Oscillator smoothing. And here we have the very very same signals. When the Oscillator changes. So when it crosses the zero line very very simple.
I’d prefer to use more the Moving average convergence divergence or the MACD indicator. It is just more visual. It gives better signals. According to me, of course, this is just a personal opinion over here. I want to show you all the indicators available in Meta Trader. So you can have a better idea about them, and you can decide which ones to use.
Then we go to the RSI relative strength index.
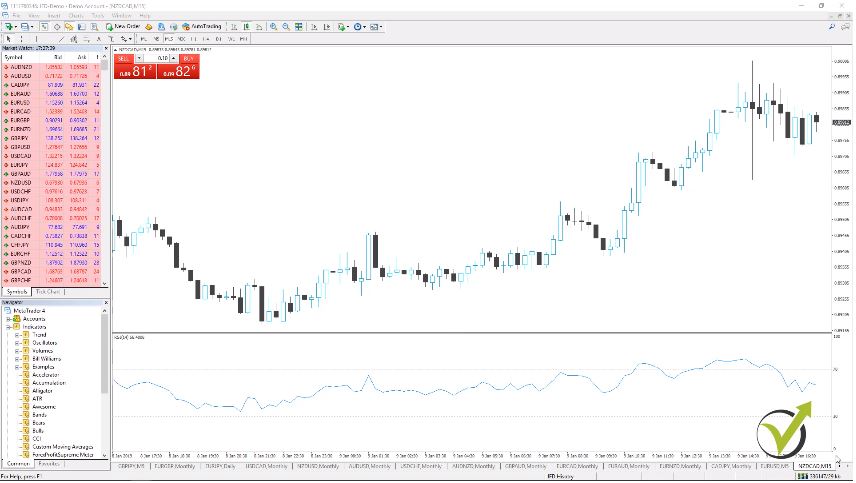
Another very very common Oscillator indicator in manual trading, especially in manual trading. So the Relative straight index goes between 0 and 100. We see the 30 and 70 levels, and we say it’s a price following. So it follows the price just because of the way it is calculated.
It shows when the asset is overbought and over-sold just like the Stochastic Oscillator Indicator, but it follows the price.
Typically, it uses the tops that are above the 70 line or the bottoms that are below the 30 lines. Like this one over here or this one over here. And it is used to show some signals when the price might reverse. It has as well divergence, which we have already discussed. As well it forms some patterns that are familiar from the technical analysis, such as trendline or support and resistant trendline.
You can draw them over the indicator itself.
So let me look for some example I’m just looking at the current chart. But typically, when it breaks, it will break just before the price. So you can see here if I have this trendline on the chart, let me make it precisely. So it will be right here. Kind of trend over here, and then you can see if I do it from this bottom and this bottom, and now the RSI bounces off it.
Now, if I use the very same trendline over the chart, it will be here, right?
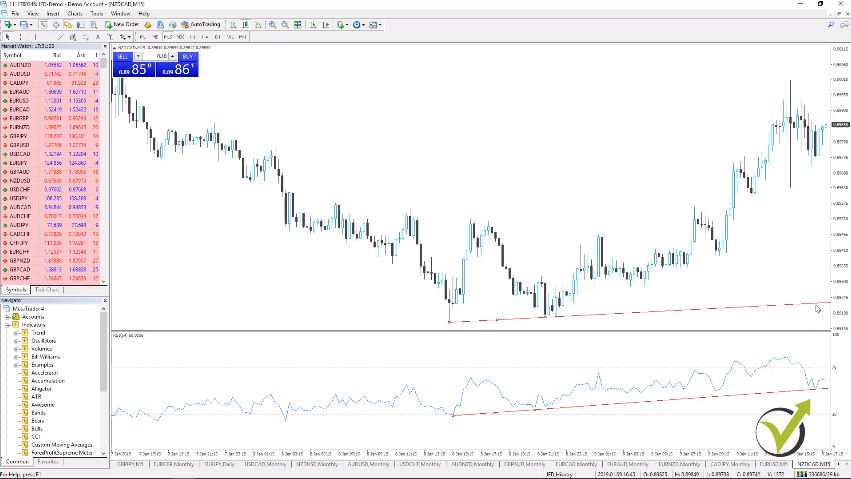
I will do it precisely again, right over here. So you can see how far is the price of what I have here. So if the RSI breaks the trendline, it will be much earlier than the price will break this trendline on the chart, which will give us the signal earlier then what we’ll have over the price chart. You can look as well for some patterns such as head and shoulders, double tops, triple tops or bottoms, or whatever price patterns you are familiar with.
I will close this now, and I will go to the next Oscillator indicator. Many beginner traders associate the Oscillators with the Stochastic oscillator, but these are actually a whole group of indicators.
Relative vigor index
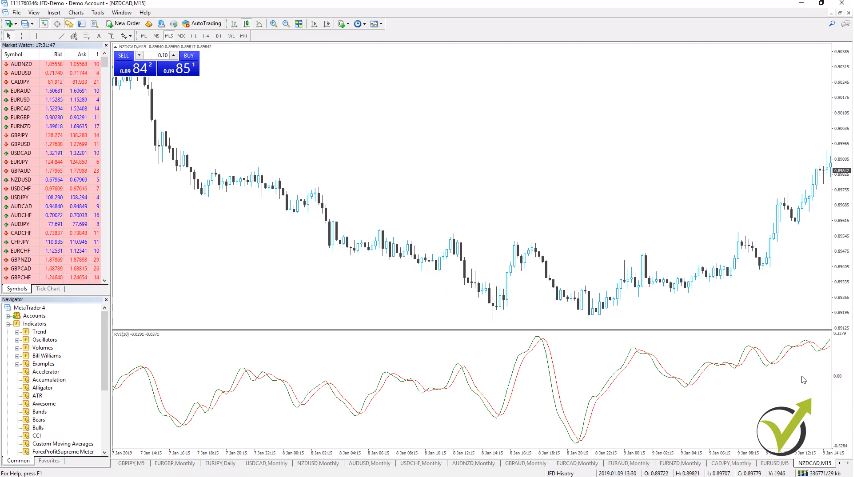
This index displays with two lines, and it goes around zero levels as well. And as a rule in this index, it is used that the closing price is higher than the opening price.
Now it uses a simple moving average of 10 as a default input over here. And it is considered as the best period for this indicator. Of course, you can change it to any if you decide that it will work better for you, and especially in Algorithmic Trading, we don’t use these default levels. But we use different numbers because we optimize the Expert Advisors according to the historical data that we have from the broker. And as you see, there are two lines here with the RVI or the Relative vigor index. Which by crossing show us rapid signals.
I will remove now the RVI index, and I will go to the next indicator.
Which is the Stochastic Oscillator Indicator
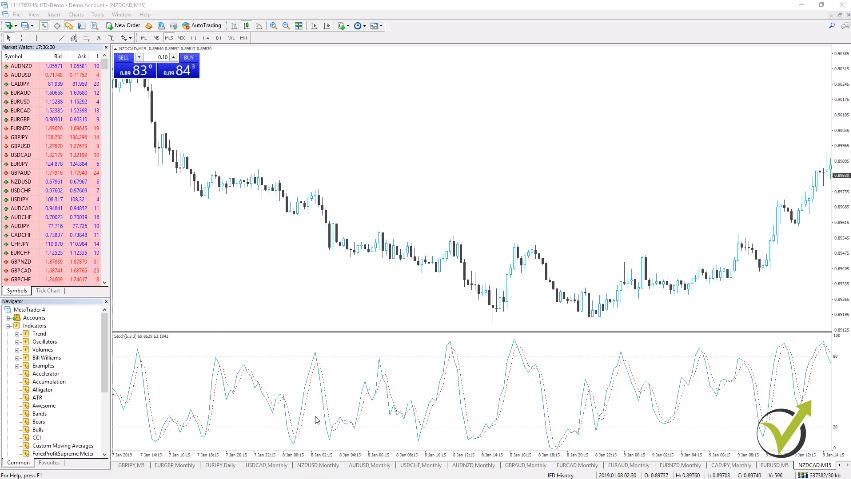
I will drop it over the chart. So the Stochastic Oscillator Indicator looks similar to the one we had before. We have levels of 20 and 80. Now here as well, we have two lines one is known as percent K and the other one – as percent D. Which is displayed with a line with dots usually. And actually, this percent D is moving an average of percent K. So this red line is a simple moving average of the other line.
Again many strategies over here from this Stochastic Oscillator indicator.
Many traders try to create stochastic ea using some of the basic rules that stand behind that indicator. Unfortunately, it is not enough to use just the conditions from one indicator. You have to mix it up and combine it with another indicator. You can still base the stochastic ea on that indicator as a significant entry rule, but filtering with other indicators will bring you better results.
Creating a Stochastic EA is not as easy as some people think, and below, I will show you some examples that will make it more transparent for everyone.
One of the common strategies is to look when percent K will cross the percent D and especially when it is in those overbought or oversold situations.
- below 20, we are looking for an oversold market
- above 80. We are looking for overbought markets
So if we have across here, it makes the signal stronger. And here as well, we are looking for divergences. As we said, divergence is when we have lower points on the price, and the indicator fails to make such a lower point. So, for example, here you can see we have the price going lower, but with the indicator, I think it’s a little bit higher. So this gives us the signal that there might be a change in the direction of the price.
I will remove now this Stochastic Oscillator indicator, and I will go to the last Oscillator that is in the group here.
Its name is William’s percent range.
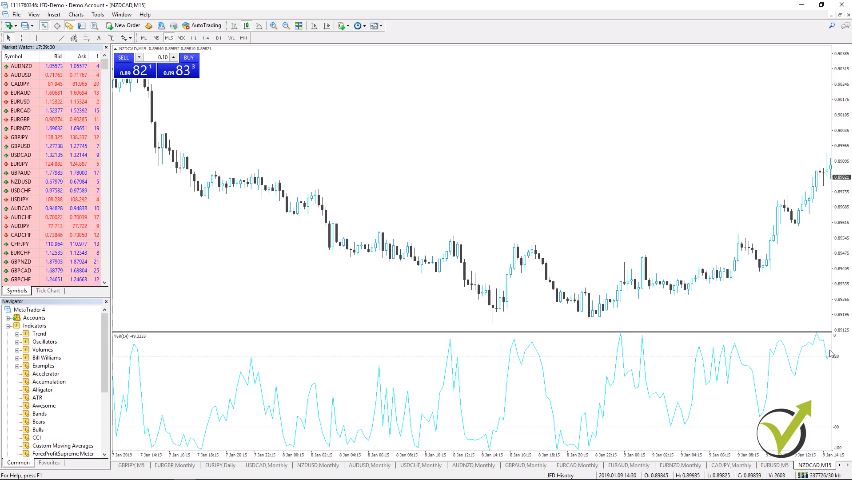
I will click on OK. Using the main percent R14, which you can see again is displayed, but this time, you can see it is negative from negative 100 to 0. We have levels of negative 80 and negative 20. That’s why it is said that the percent R has an upside-down scale.
And this is what makes it different from the Stochastic Oscillator.
So it is very similar to this Stochastic oscillator just it has a negative scale. And one of the suggestions here is to wait to see a confirmation on the price itself. So if we see a signal on the indicator, we might want to wait a bit to see the price actually going with the direction of the signal and then to enter on the market.
So these were all Oscillator indicators in MetaTrader. I just wanted to go over each one to give you an idea of how they look and what are the essential signals that they provide. And as said, each one of them has many interpretations and could be used in many many different ways.
Creating Stochastic Oscillator EA with strategy builder
Coding a Stochastic Oscillator EA is not a simple task. It is hard to be a good trader and a good developer at the same time, or we can say almost impossible. The other option is to hire a developer, which is costly.
The best method we have found is to use strategy builders as EA Studio.
Now, you can test each of the oscillators indicators using the strategy builder EA studio.
There you can build your strategies and export them as expert advisors. The good thing is that you see the results before testing the strategy.
For example, if you placed only the Stochastic oscillator indicator on EURUSD H1 chart, you will see the following result:
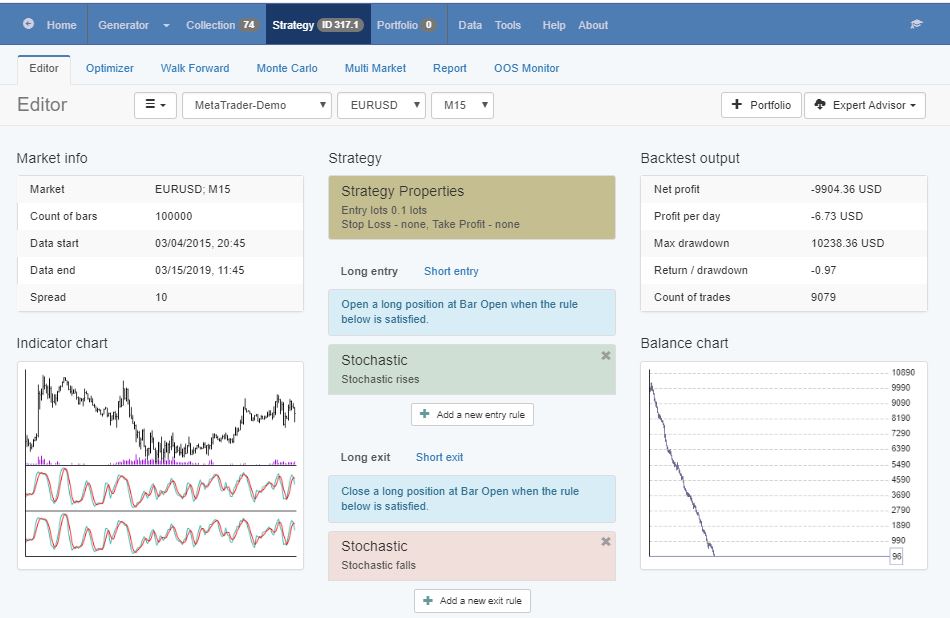
In this example, I have used stochastic oscillator indicator Rises as an entry rule, and I have used to have a stochastic oscillator indicator that falls as an exit rule.
As you can see with equity, charge, the strategy losses. Here we see the results for the last 100000 bars of historical data. This way, we know if such a strategy would be profitable or losing for the last couple of months or years depending on which timeframe we use.
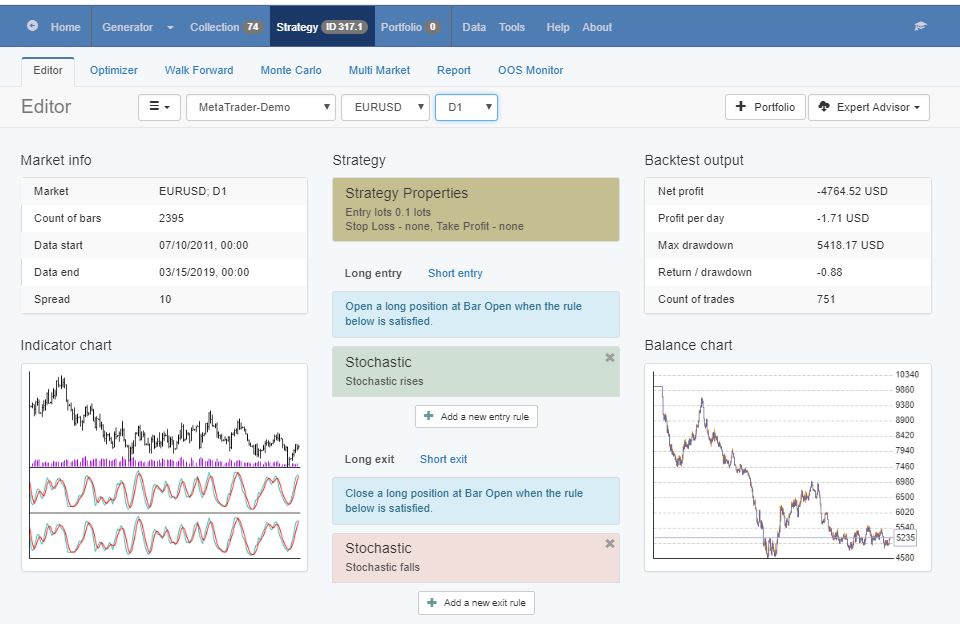
For example, if I switch this strategy to the daily chart, you will see that the Equity line looks better, but it’s still losing:
Now, if we use the stochastic oscillator indicator combined with other indicators, for example, the alligator and the directional indicators for entry rules, we will have a much better strategy.
Also, as an exit condition, I will show you the indicator commodity index, which will improve even better the strategy. I will add as well Stop loss and Take profit to make it a complete strategy:
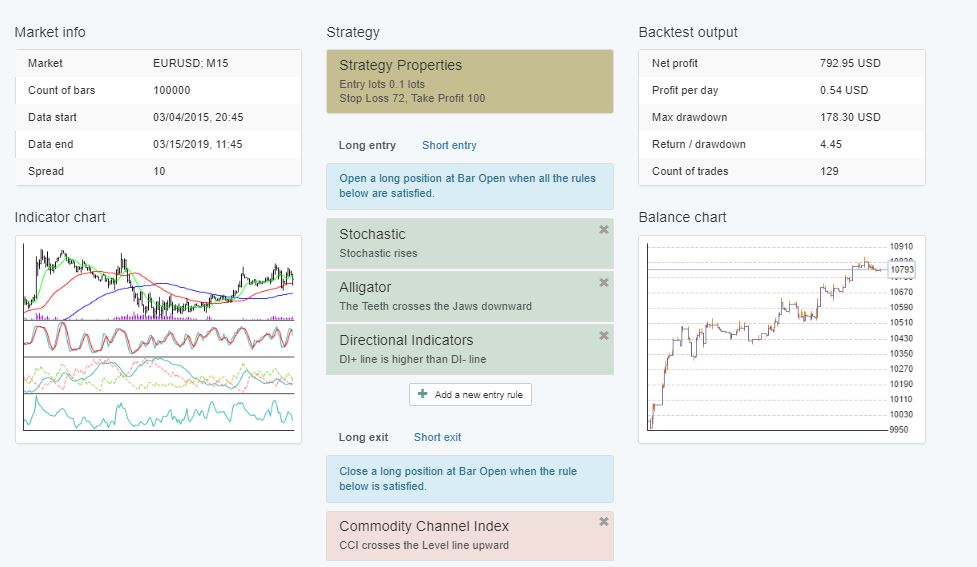
You can see that the Equity line is much better and the strategies profitable.
We have the stochastic oscillator indicator Rises as one of our entry rules.
The Alligator indicator is with the rule the teeth cross the jaws down words.
The third indicator that is used is Directional indicators, and we have DI plus line that is higher than DI minus line.
Also, we have a commodity index crosses the level line up word.
The strategy uses stop loss of 72 pips and take profit of 100 pips.
From the backtest output, you can see that the strategy has returned to a drown down ratio of 4.45. This way, we have a decent strategy that uses this the fastest escalator indicator but not alone.
Thank you very much for reading this article!
If you have any questions, you can always write in our trading forum on the website.
Cheers!
What is Stochastic Oscillator EA?
That is an Expert Advisor (trading robot) based on the Stochastic Oscillator indicator. Normally such Expert Advisors are built in combination with other indicators.
How can I create Stochastic Oscillator EA?
One thing is to code the Expert Advisor on MQL in MetaTrader Meta Editor. The other option is to use strategy builders which do not requite programming skills.
What EA stands for?
EA stands for Expert Advisor. This is an automated strategy that could be applied on the MetaTrader platform.
Where can I trade with Stochastic Oscillator EA?
The Expert Advisors are used on the MetaTrader platform. This is a free platform that is provided from most of the brokers.

