An S&P 500 day trading strategy can help you buy and sell companies’ stocks in this index. This strategy can also help you to trade exchange-traded funds (ETFs) that hold the securities of this index.
But most importantly, you will learn when to buy and when to sell it.
Rising interest rates have made some traders uncertain about buying stocks. Our S&P 500 Index (SPX) day trading strategy can be useful to traders who are wondering whether it’s a good time to trade the S&P 500.
Some traders want an S&P 500 trading strategy that they can apply in their day trading. We’ll share a strategy with you today.
A Versatile Strategy
You can apply this S&P 500 day trading strategy on any trading platform. However, we suggest that you stick to MetaTrader. That’s because you can trade with the Robot that will share with you.
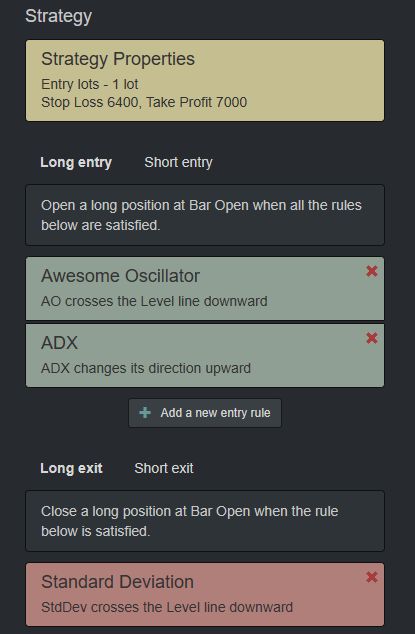
Our S&P 500 day trading strategy has two entries and one exit rule. So, it’s a very simple strategy. As you can see in the image below, we have a Stop Loss and our Take Profit. However, it would help if you remembered that this strategy is for the M1 time frame.
So, it’s very active, and the trades won’t last until the next day.
Avoid Swap Fees
We created this strategy to help you avoid paying a swap fee to the broker. This type of fee is necessary if a broker has to roll over your trade to the next day.
You’ll lose money if you open an account with a broker that charges you for commissions, swaps, and spreads. It’s hard to trade stocks, Dow Jones, or the S&P 500 with a broker that charges so many fees.
This is especially true when their spreads are high. It’s always best to look for a broker that doesn’t charge you any commissions.
Stick to M1 for This S&P 500 Day Trading Strategy
This S&P 500 day trading strategy works for the M1 time frame. If you switch to another chart, you might lose money.

For example, if you switch to M5, in the long term, you’ll lose money. Similarly, you’ll lose money on M30 and H1. So, the time frame is very important.
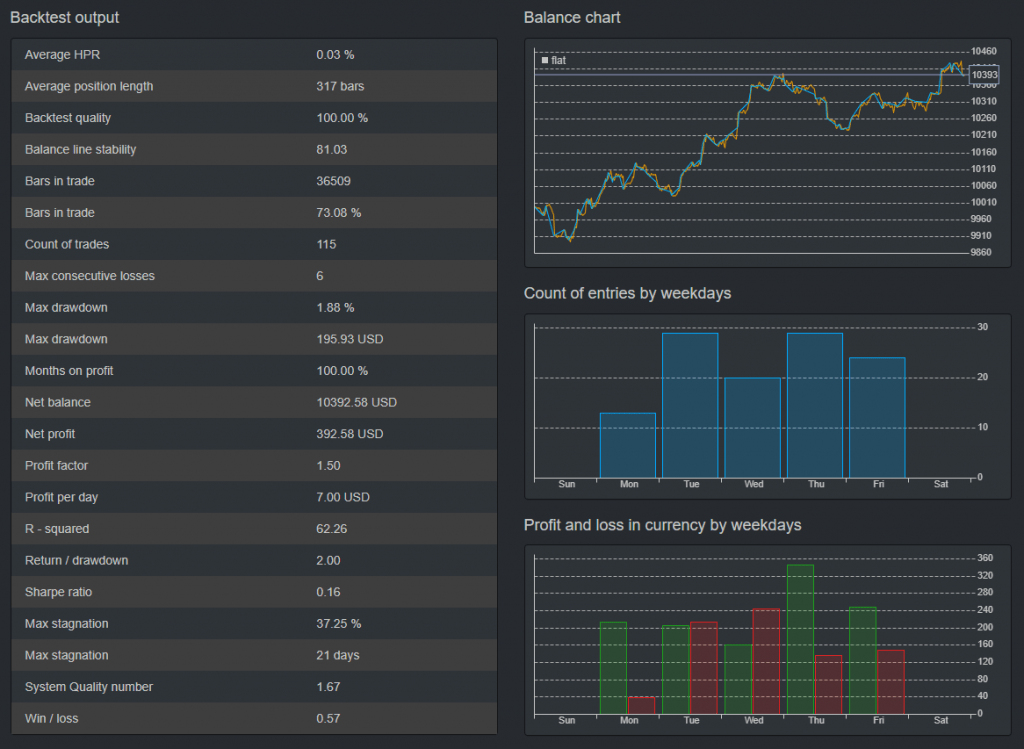
This S&P 500 day trading strategy was tested nearly 700 times. The Stop Loss is 6,400, and the Take Profit is 7,000 pips. To simplify, the Stop Loss is $64 on the S&P 500 price, and Take Profit is 70.
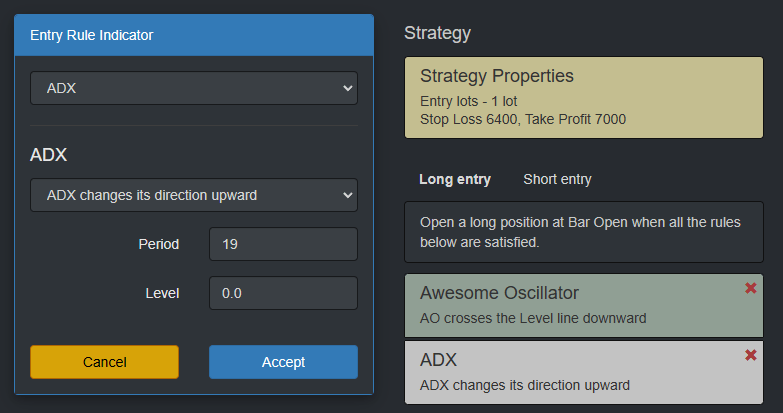
If you buy S&P at $4,000 you’ll have to put a Stop Loss of $64 below that and a Take Profit of $70 above that, or at $4,070. Our entry rules use the Awesome Oscillators and the ADX, so you’ll need to confirm these two indicators.
Using the Awesome Oscillator With the S&P 500 Day Trading Strategy
Look for the Awesome Oscillator to cross the level line downwards for a long trade. The level is zero.

When the Awesome Oscillator crosses the zero line downwards, this is a signal to buy. However, we need to have confirmation from the ADX.
Using the ADX Indicator for the S&P 500 Day Trading Strategy
We can use the ADX indicator to confirm our buy signal. The ADX should change its direction upwards with a period of 19.
In the image below, the ADX is the blue line. So, we should see it changing upwards. So if it’s dropping, the moment when it starts rising again, we can open a long trade.
Example of Buy Signals for the S&P 500 Day Trading Strategy
The image below shows the Awesome Oscillator going below the zero line during that bar. When the next bar opens, we’ll have a long trade. You can see that the oscillator changes its direction upwards. This works with one-minute bars.
We also see the ADX turning downwards. We closed the trade at that point because of the exit condition, which was the Standard Deviation crossing the line.
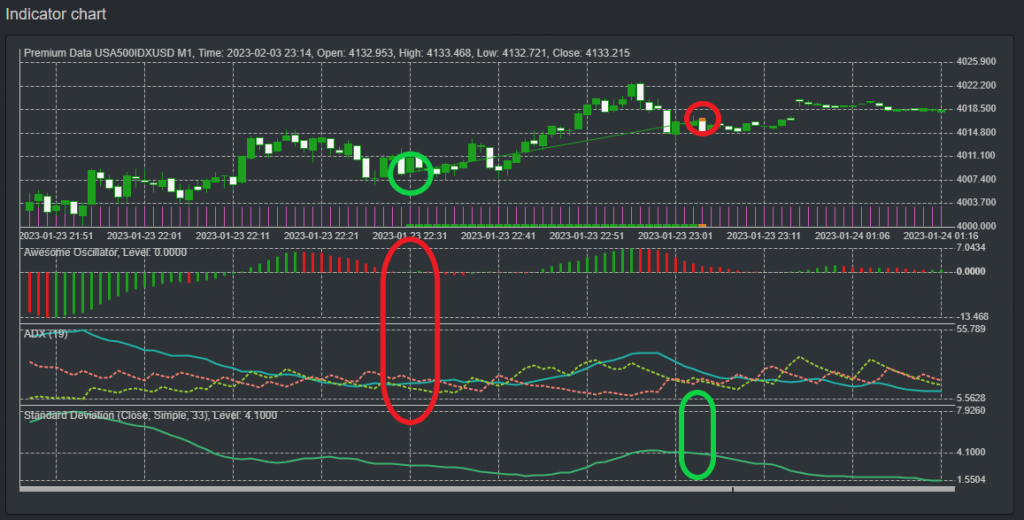
Our Exit Rule
For this S&P 500 day trading strategy, we have a simple exit rule. We use the Standard Deviation. So we look for the Standard Deviation to cross the line.
In our editor, we set the exit rule as Standard Deviation crossing the level line downloads. We used a period of 33 and level 4.10.
To recap, whenever the Standard Deviation crosses the level line downward, it’s time to close the trade. That’s our exit rule and we have to follow it.
We got good results when we tested the robot for this S&P 500 day trading strategy. However, it would be best if you did your own backtest. There’s no guarantee that this strategy will continue to profit in the future.
With everything, if you’re trading or investing by using a particular strategy and it’s been profitable so far, there’s no guarantee that it will be profitable in the future. It’s always wise to trade a small portion of the capital that you have prepared for trading or investing.
Final Thoughts
This is a decent strategy for the M1 time frame. However, it’s challenging to follow the strategy manually because the ADX changes direction really quickly on the M1 time frame.
You’ll have to keep staring at your chart to follow the strategy manually. We have a robot for this S&P 500-day trading strategy that we’ve shared with you. You can drop the Expert Advisor on the MetaTrader platform, and the expert will start trading automatically.
It will buy when there’s the buy signal and the confirmation. The robot will also sell when there’s an opposite signal. It will place the Stop Loss and the Take Profit automatically.
Please let us know how your own test went by sharing it in the comments.
Thanks for reading this post. Have a great day!