Moving average crossover strategies are widely used in trading because they provide clear signals for entering and exiting trades based on trend changes. By automating this strategy, traders can remove emotional decision-making and focus on executing trades based on defined rules.
One of the best ways to automate trading strategies is by using a strategy builder like Expert Advisor Studio. EA Studio allows traders to create and optimize strategies quickly without needing to know complex coding. In this tutorial, we will guide you through the process of creating a moving average crossover strategy using EA Studio software
We’ll also show you how to optimize your strategy using EA Studio’s robust features and prepare it for live trading. By the end of this guide, you’ll be able to download and deploy your very own USD/JPY moving average crossover expert advisor and enhance your trading.
You can also get the ready-to-use expert advisor from this link.
For a visual guide, check out this helpful video tutorial below:
Table of Contents:
- What is a Moving Average Crossover Strategy?
- Setting Up EA Studio for Strategy Creation
- Selecting Indicators for the Moving Average Crossover Strategy
- Refining the Strategy with Performance Filters
- Validating Strategies with Monte Carlo Testing
- Manually Reviewing and Selecting the Best Moving Average Crossover Strategies
- Final Testing and Optimizing Out-of-Sample Performance
What is a Moving Average Crossover Strategy?
A moving average crossover strategy is a popular technical analysis approach used to identify potential market trends and generate trading signals. The core concept involves using two technical indicators: a fast-moving average and a slow-moving average. The strategy relies on the crossover signals between these two moving averages to indicate the direction of a trend. This helps traders identify buy or sell opportunities.
- Fast Moving Average (shorter period): Reacts quickly to price changes and signals short-term market movements.
- Slow Moving Average (longer period or long-term moving average): Smooths out price fluctuations over a longer time frame, providing a clearer view of the overall trend.
When the fast moving average line crosses above the slow moving average line, it signals a buy or long entry, indicating that prices may start trending upwards. Conversely, when the fast moving average crosses below the slow moving average, it signals a sell or short entry, suggesting a potential downward trend.
Traders use the moving average crossover strategy because it simplifies the decision-making process. By focusing on the crossover of moving averages, a trader can spot new trends and avoid chasing the market during sideways movements.
Setting Up EA Studio for Strategy Creation
Creating a moving average crossover strategy in EA Studio is a straightforward process. EA Studio allows traders to generate strategies without writing any code, and the software’s built-in optimization tools make it easy to fine-tune trading parameters for better performance.
Steps to Set Up EA Studio:
- Launch EA Studio: Begin by opening EA Studio and setting up your workspace.
- Choose Timeframe: For this example, we’ll use the M15 timeframe (15-minute chart) to build a strategy for short-term trades. You can adjust the timeframe based on your trading preferences.
- Select Data Source: Use a reliable data source for the USD/JPY pair. High-quality data ensures the accuracy of your strategy’s backtesting.
- Date Ranges for In-Sample and Out-of-Sample Testing (in this case we are going to do the date ranges manually):
- In-sample period: Set this for generating the strategy, such as a 2-year period.
- Out-of-sample period: Use a 6-month period for out-of-sample testing to ensure that the strategy remains robust and profitable in unseen data.
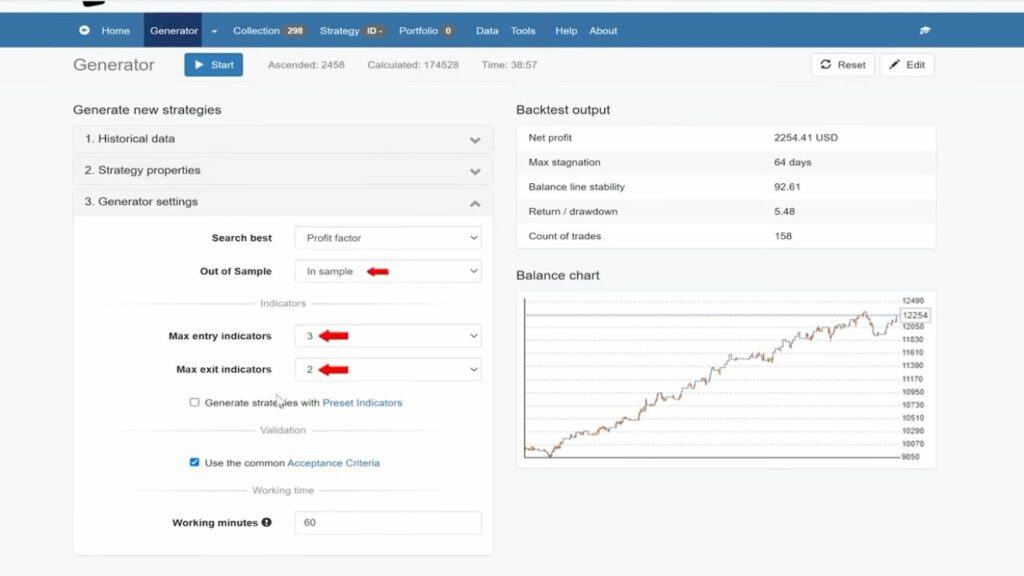
In this step, we also set basic filters for the acceptance criteria, like a minimum number of 150 trades and a profit factor of 1.1 or higher. This is to ensure that the strategy generates a reasonable number of trades and remains profitable. And for the strategy properties, we’ve used fixed take profit and stop loss between 20 and 120 Pips. And for the generation, we have set a maximum of three entry indicators and a maximum of two exit indicators.
After setting these initial parameters, EA Studio will begin generating strategies. Once completed, you can move on to refining the strategy specifically for a moving average crossover.
Selecting Indicators for the Moving Average Crossover Strategy
Once you’ve set up EA Studio, the next step is to define the entry and exit rules for your moving average crossover strategy. In this case, we focus primarily on the crossover between a fast and slow moving average, with additional technical indicators such as RSI, Stochastic, and Bollinger Bands available to enhance accuracy.
- Entry Rule: The primary entry rule will be a moving average crossover, where the fast moving average crosses above the slow moving average, signaling a buy. Other indicators, like RSI and Stochastic, can be incorporated to filter trades during extreme conditions.
- Exit Rule: Similarly, the exit rule is based on a moving average crossover where the fast moving average crosses below the slow moving average, indicating a sell or position close.
EA Studio allows you to test combinations of these indicators, giving you the flexibility to fine-tune your strategy.
Refining the Strategy with Performance Filters
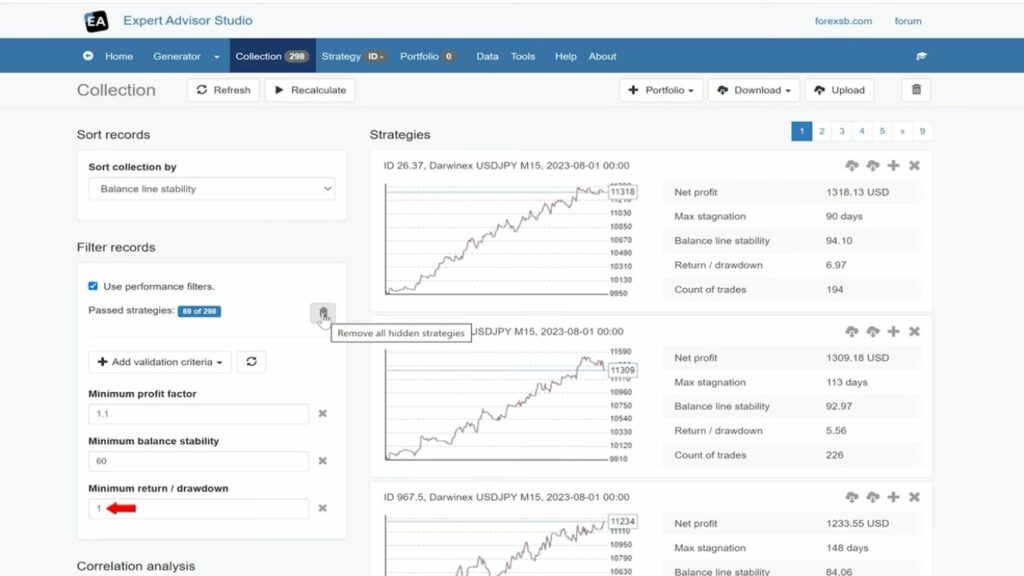
At this stage, you’ve collected an initial set of strategies, and now it’s time to refine them. So the first step we’re going to do is we’re just going to use the performance filter to kind of choose the best strategies.
- Profit Factor: Set the minimum profit factor to 1.1 (and later increase to 1.2 if necessary), filtering out any strategies with low profitability.
- Balance Stability: Adjust balance stability to ensure strategies have been consistently profitable. We have set a minimum balance stability of 60 here.
- Return over Drawdown (RoD): This metric helps identify strategies that offer high returns with minimal risk. Set a threshold for RoD to focus on strategies that are worth pursuing. In our case, we are using 1.
By adjusting these filters, you can reduce the collection to the best-performing strategies that meet your criteria for a moving average crossover strategy. And you can now download the collection.
Validating Strategies with Monte Carlo Testing
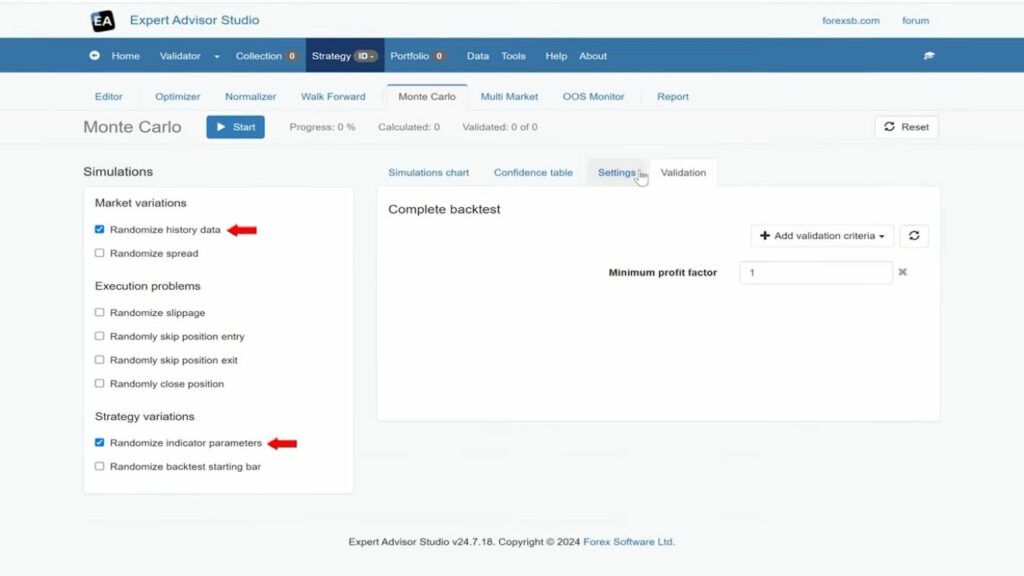
After filtering, it’s crucial to validate the strategies to ensure robustness. EA Studio’s Monte Carlo feature allows you to do this efficiently. Go to the validator and import the collection that we downloaded.
- Monte Carlo Settings: Randomize the history data and indicator parameters to test the strategies under different market conditions. This step ensures that the moving average crossover strategies will perform well even in unpredictable market environments.
- Validation Criteria: Run 20 tests, and aim for at least 80% of them to be profitable. If a strategy passes this validation, it shows high robustness and a better likelihood of succeeding in live markets.
Manually Reviewing and Selecting the Best Moving Average Crossover Strategies
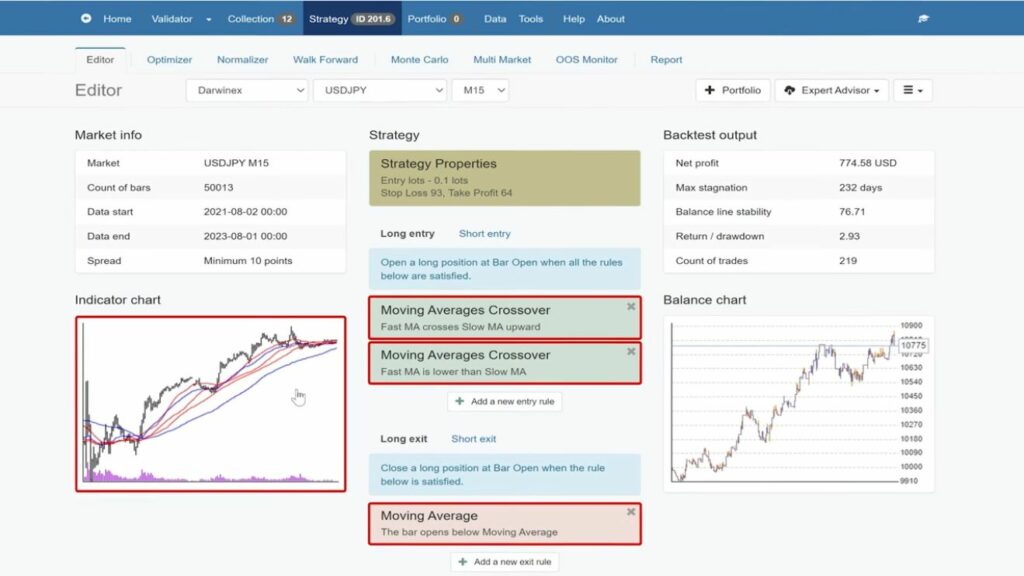
Once the strategies pass Monte Carlo testing, we are going to manually inspect them very quickly to ensure they fit the moving average crossover strategy criteria. So the next thing we are going to do is once these have all gone through, we are going to go through the collection manually and just quickly look at the strategy and add any of the ones that we want to investigate further to the portfolio. Some of the strategies may not even be a moving average crossover, which is of course what we are targeting here. And we are also going to do a couple of quick manual checks as we go.
So we review each strategy and confirm that it uses a moving average crossover as the entry/exit rule. And we eliminate strategies that rely on other indicators like Bollinger Bands that don’t align with the desired approach. We have narrowed down the strategies to around 12-15 solid options, which can be further analyzed in the next step. Also, we check the strategies on different data source. Sometimes it can be a bit different, and it can be a bit of a flag that it’s maybe not going to suit any brokers.
Final Testing and Optimizing Out-of-Sample Performance
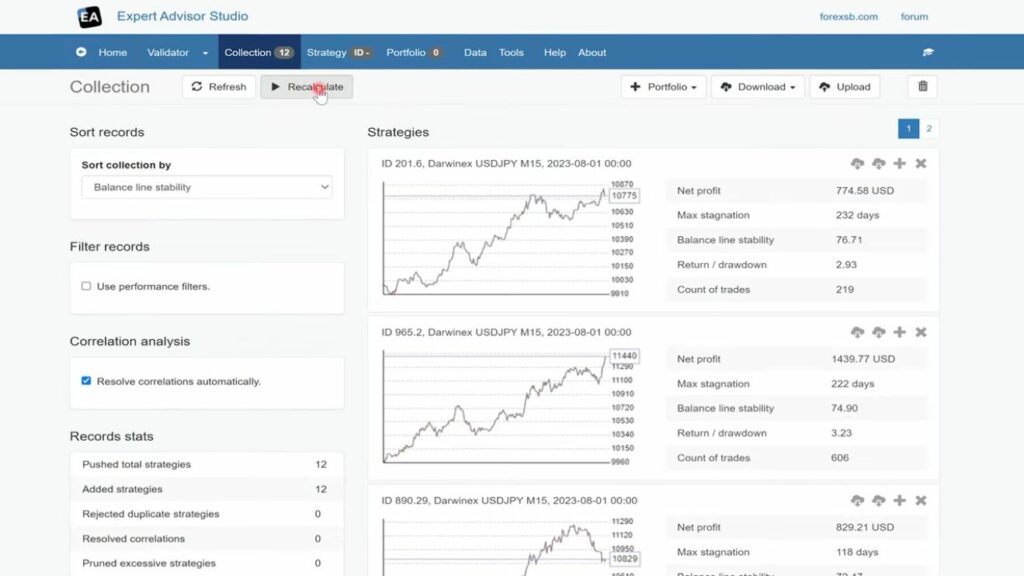
With a refined list of moving average crossover strategies, it’s time to test their out-of-sample performance. This is kind of the last check. We recalculate for Out-of-Sample Period and we set the out-of-sample period for 6 months. This ensures that the strategies can perform well in market conditions they haven’t been exposed to during initial testing. We are going to eliminate poor performers. If any strategy underperforms in this phase, we are going to remove it from our portfolio. The remaining strategies should show consistent performance.
Of course the reactor can be used to do all this, however, we are just doing it in a kind of more broken down way just for demonstration, especially for people who are new to EA Studio.
Deploying Strategies to a Demo Account
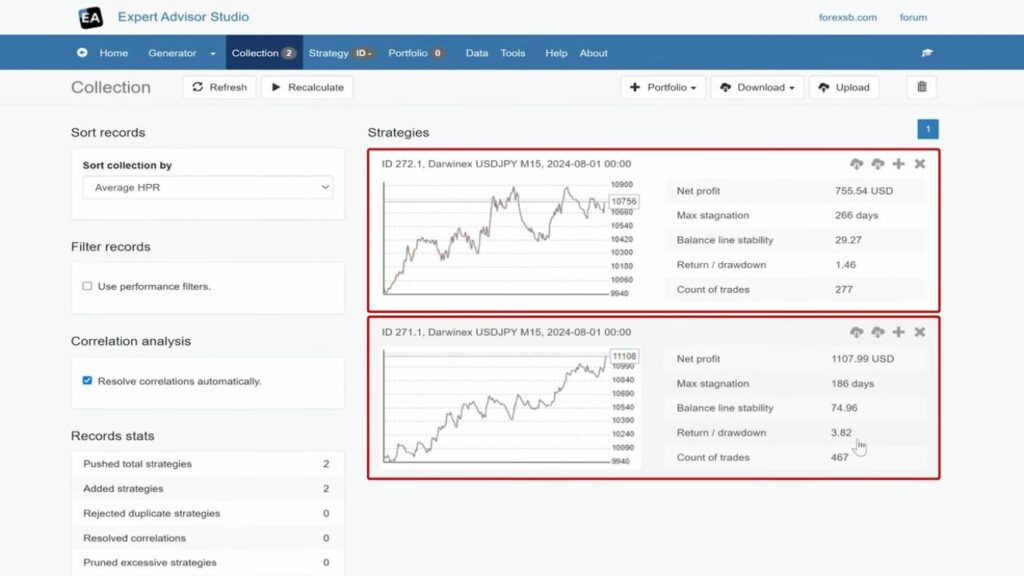
Finally, the last step involves downloading the expert advisors (EAs) for the best moving average crossover strategies and deploying them on a demo account.
- Incubation: Run the strategies in a demo environment for an extended period to assess real-time performance. Only after consistently positive results should they be moved to a live account.
You can get the ready-to-use expert advisor from this link.
Conclusion
By following these steps, you can effectively use EA Studio to create a robust moving average crossover strategy. The software’s combination of automated generation, performance filters, and Monte Carlo testing ensures that the strategies you deploy have been thoroughly vetted and optimized.
If you find this guide useful, you might be also interested to see how to create a Stochastic trading robot – watch Sam’s video here.
Or if you are new to algorithmic trading and looking for possibilities to create trading robots, make sure to check out our FREE course for EA Studio below.

