Forum Replies Created
-
AuthorPosts
-
 Alan NorthamParticipant
Hi Samuel,
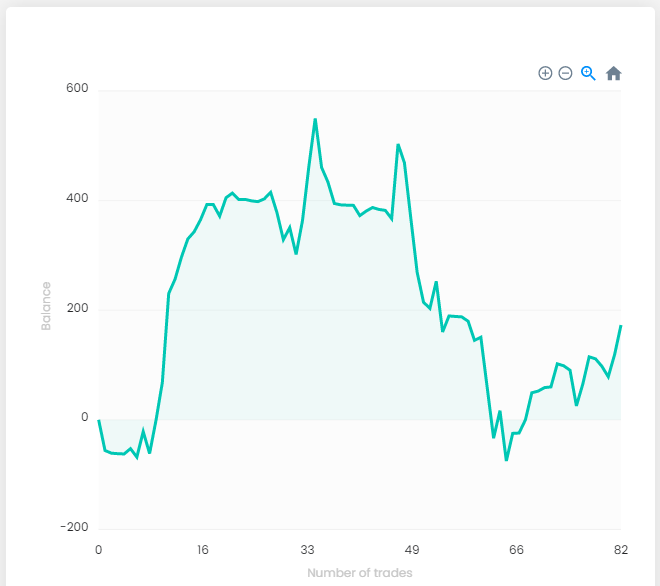
Yes I am doing the free FTMO Challenge. Notice at the peak of the chart above $500. At this point I had passed all the challenges. All trading before the peak was done by manual trading. Once I passed all the challenges I then switched to a Portfolio of EA Studio strategies. Actually it was a Portfolio of 3 EA’s of EURUSD strategies, 3 EA’s of GBPUSD strategies, and 3 EA’s of USDJPY strategies. All 3 portfolio’s were 15 minute time frames. So after the peak in the chart all trading was done with these 3 Portfolio’s. The challenge ends on October 2nd. I will show the complete results at the end of the challenge.
 Alan NorthamParticipant
Hi Samuel,
Hurray!!! So, a course on how to pass the FTMO challenge, as mentioned by Petko, should be of interest to traders in the U.S. as it would allow these traders to use EA Studio Portfolio’s.
Alan NorthamParticipantHi Samuel,
A portfolio of strategies used in the FTMO challenge would be exempt from the FiFO rules for traders in the U.S. taking part in the challenge.
Alan NorthamParticipantPetko and Samuel,
I think you are misunderstanding what I was saying. Petko made a comment about creating a course to help traders pass the FTMO challenge. I just thought it was a good idea especially to those traders in the States. The reason I said this is because if such a course were to include a portfolio of strategies it would help traders in the states to be able to use such a portfolio of strategies which we cannot do now because of the FIFO rule.
Alan NorthamParticipantHi Petko,
I was referring to your comment on creating a course to pass FTMO challenge. This way traders in the States could use EA’s that contain multiple strategies as the FIFO rule would not apply.Alan NorthamParticipantHi Alex C,
I wanted to comment on your confusion as posted above “After posting it only went down, no positive weeks anymore… still in profit but I’m confused …” If I am off base I hope Samuel or Petko will correct me.
When we create a strategy the balance line does not go straight up and will have periods of drawdowns. So it makes sense to me that the strategy will have periods of draw downs in the future. For example my portfolio of 10 strategies from 02/19/2022 through 08/19/2022 has a drawdown of 1.65%. When I move my strategy forward from 03/19/2022 through 09/19/2022, which includes the most recent price action of the market, it has a current drawdown of 2.47%. The current draw down is a little less than 1% greater (2.47% – 1.65%). I attribute the current draw down I am experiencing at due to the current increased volatility in the market as due to recent economic conditions which is worse than the previous six months. It is my belief that as we go through the months ahead there will be periods when my portfolio’s balance line will continue to move higher along with future periods of draw down. So, while it may be frustrating to watch my portfolio go through the current drawdown I am not giving up. I believe that my portfolio will continue to increase in value as I go through the months ahead. So, in my opinion, I don’t think I would be confused yet. I would give it more time.
Alan NorthamParticipantHi Petko,
A course and an EA Studio portfolio could be a solution for traders in the States in order to get around the FIFO rule!
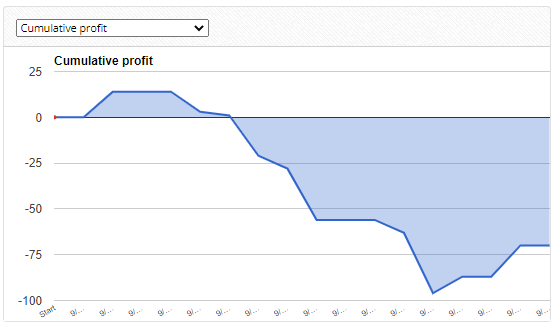
Alan NorthamParticipantHi Samuel, I did some investigating this morning and here is what I did. I the 10 strategies I chose at the beginning of September and put them into the EA Studio portfolio. I then recalculated for Sept 1 through Sept 16. These dates are outside the dates used to determine the strategies. Now I can see how my portfolio of 10 different EURUSD strategies should have behaved going forward in time. The following chart shows the results from EA Studio:

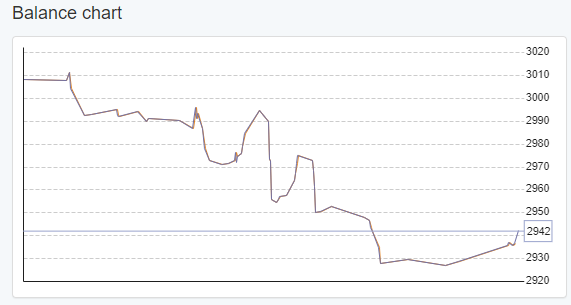
I then compared the resulting chart from EA Studio to the chart of my actual trading portfolio. The following chart is from FXblue:

As can be seen the results are similar. FXblue, however, shows about 10 dollars more in loss over the first half of September but does not include the plus 10 dollar float. So, overall loss is about the same.
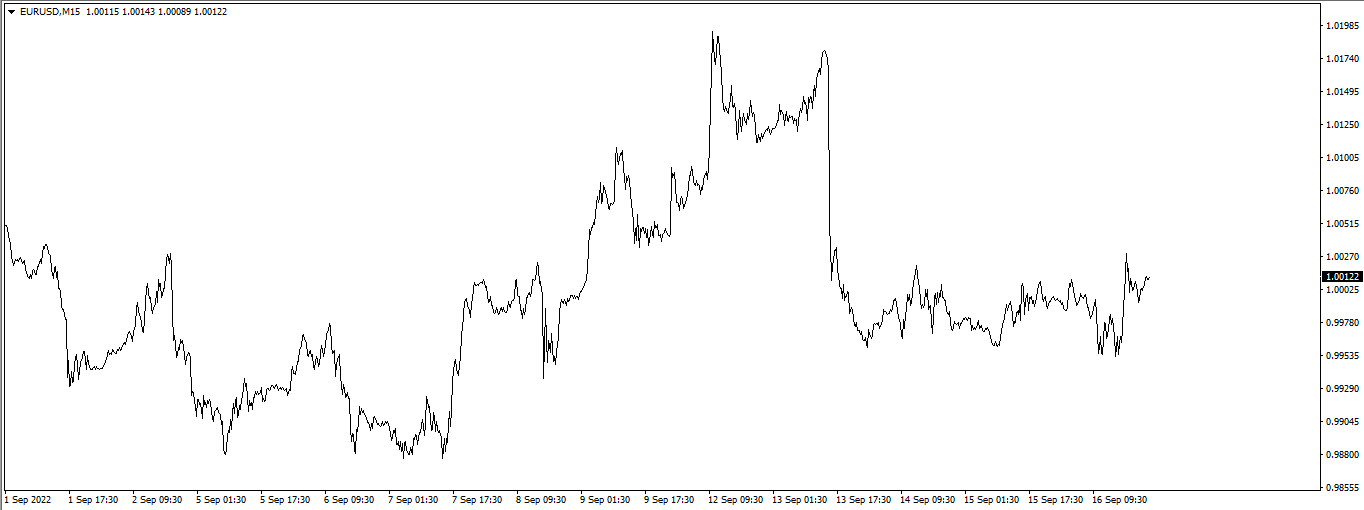
Now here is the interesting thing. The following chart shows a screeshot of MT4 EURUSD window:

What I find interesting this that the big drawdown in my portfolio seems to be happening at about the same time EURUSD is actually moving higher. It’s like when the market is going up my portfolio is taking Short trades. I don’t think this would be possible but it is quite interesting to see this negative correlation but I cannot say I understand why this would be happening.
I will continue until the end of the month to see what the overall results look like for the month.
Alan NorthamParticipantHi Samuel,
The following comment from you confused me:
“Also, in my opinion focusing on a single asset like this is not the way to go at all. Could be really good for a period if it’s doing well but the reverse is also true.”
The reason it confuses me is because Petko has a whole trading course just using EURUSD. And, also somewhere in the courses I have taken from Petko I believe I learned it was best to use different EURUSD strategies to reduce risk. So if it is not advisable to just use EURUSD then why the course on just trading EURUSD. Further what other currencies would I then need to use to make a correct trading portfolio and how many difference currencies is the correct amount? So this is now all confusing to me.
Alan NorthamParticipantMinimum count of trades: 300
Selection of 10 Best Strategies: I followed EA Studio Professional Course Lecture 5.3 which is as follows:
First I filter my collection of EURUSD Strategies as follows:
Validator
Historical data (Adjusted to last 6 months)
Data source Premium Data
Period M15
Loaded EURUSD; M15 – 12768 bars.
From 2022-03-01 00:00, to 2022-09-01 16:45.Validator settings
Out of Sample: 20%
Common Acceptance Criteria
Complete backtest
Minimum count of trades: 200
Minimum profit factor: 1.2
In Sample (training) part
Minimum profit factor: 1.1
Out of Sample (trading) part
Minimum profit factor: 1.1Optimize strategies:
Normalization
Remove Take Profit unchecked
Remove needless indicators checked
Reduce Stop Loss checked
Reduce Take Profit checked
Normailize indicator paramenters checked
Out of Sample: 20% OOS
Numeric values steps: 20 steps
Search best: Net balance
Normalize Preset Indicators unchecked
Acceptance Criteria checked
Monte Carlo validation
Count of tests: 20
Validated tests: 80%Perform robustness testing:
Monte Carlo validation
Count of tests: 20
Validated tests: 80%The results are then further filtered
Historical data (Adjusted for last one month)
Data source Premium Data
Period M15
Loaded EURUSD; M15 – 2280 bars.
From 2022-08-01 00:00, to 2022-09-01 17:45.Validator settings
Out of Sample: not used
Acceptance Criteria
Complete backtest 1.2 pf
In Sample 1.1 pf
Out of Sample 1.1 pfNone of the other filtering is used as Petko says its all been done before and don’t need to do it again.
The results are then filtered in the Collections tab as follows:
Profit factor adjusted until about 15 to 20 strategies are left
Count of trades is then adjusted to minimum of 10 trades (this is about one trade every other day).Finally the resulting strategies are eyeballed looking for best 10 strategies balance line with no downward trends showing over approximately last one week.
Alan NorthamParticipantDid you manual trade or did you use a portfolio of EA’s?
Alan NorthamParticipantHow often can you do the free trial?
Alan NorthamParticipantI have collected over 1000 EURUSD strategies using the following criteria:
REACTOR
DATA HISTORY: 2017 TO PRESENT
Premium Data adjusted to use with Oanda USA
Validator settings
Out of Sample 20% OOS
Acceptance Criteria
Complete backtest 1.2 pf
In Sample 1.1 pf
Out of Sample 1.1 pf
Normalization
Remove Take Profit unchecked
Remove needless indicators checked
Reduce Stop Loss checked
Reduce Take Profit checked
Normailize indicator paramenters checked
Out of Sample: 20% OOS
Numeric values steps: 20 steps
Search best: Net balance
Normalize Preset Indicators unchecked
Accemptance Criteria checked
Monte Carlo validation
Count of tests: 20
Validated tests: 80%Then I determined best 10 strategies for my portfolio using LECTURE 5.3 as guideline
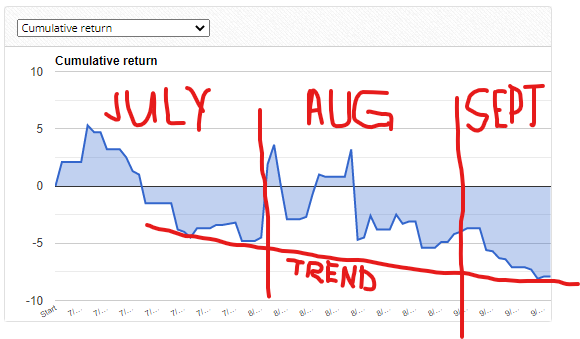
The following chart shows results for July thru mid-September. At the start of each month new best 10 strategies were selected:

As can be seen the trend is down and not up!
Alan NorthamParticipantEA Studio Pro Course will explain exactly how EA Studio works.
Alan NorthamParticipantThank you!
-
AuthorPosts