In today’s challenging economic climate, investors face difficult decisions when it comes to trading on the markets. Cryptocurrencies like Bitcoin struggle to regain their footing, and indices like the S&P 500 show a clear downtrend. There is one asset that performs well while everything else crashes – Gold. In this blog post, we’ll be discussing the Best TradingView Strategy that you can use to trade Gold.
As you can see below, Gold has broken through the $1,800 mark and is forming new higher highs and higher lows on a daily chart. In this article, I will share with you my best TradingView strategy for Gold, which you can apply easily no matter the state of the economy.
The current recession is an excellent time to invest in Gold. Central Banks are increasing interest rates to fight inflation, making it difficult for investors to make a profit in other asset classes. However, with my TradingView strategy for Gold, you can make a profit on both sides of the market – even when the market drops.
Gold was in a clear downtrend for almost a year, forming lower highs and lower lows until the 22nd of November. This was the first time I traded Gold on the long side. Let me show you my setup, which has worked for me time and time again.
Best TradingView Strategy: Identifying Trends
The first step in developing a successful Forex trading strategy is to identify trends. TradingView offers a wide range of tools to help traders analyze trends. One of the most popular is the trendline tool. To use this tool, simply draw a line connecting the highest point of a trend to the next lowest point. If the price attempts to break through the trendline and fails, it may indicate a trend reversal. Conversely, if the price breaks through the trendline and continues in that direction, it may indicate a trend continuation.
Using Support and Resistance Levels
Support and resistance levels are also critical components of any successful Forex trading strategy, and this TradingView Strategy is no exception. Support levels are areas where buyers have previously entered the market and prevented the price from falling further. Resistance levels are areas where sellers have previously entered the market and prevented the price from rising further. When a support or resistance level is broken, it may indicate a trend reversal.
One key thing to keep in mind when using support and resistance levels is that they can change over time. A support level that was previously strong may become weaker as more buyers enter the market, while a resistance level that was previously weak may become stronger as more sellers enter the market.
Best TradingView Strategy: Entering Trades
Once you have identified a trend and support and resistance levels, it’s time to enter a trade. One common strategy is to enter a trade when the price breaks through a resistance level. However, it’s important to wait for confirmation before entering a trade. This can help you avoid false breakouts, where the price breaks through a resistance level but quickly falls back below it.
Another important factor to consider when entering trades is your risk management strategy. Always set a stop loss to protect your account from significant losses. You should set your take profit level should at a realistic level based on the current market conditions.
An Example Trade
Let’s look at an example trade to see how this TradingView Strategy can be applied in practice. In this example, we will be trading gold.
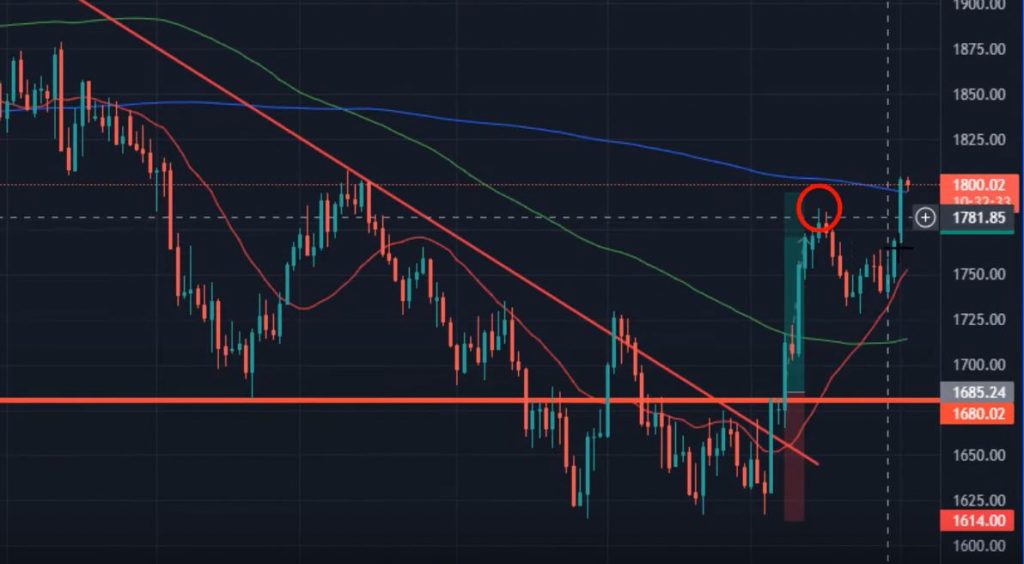
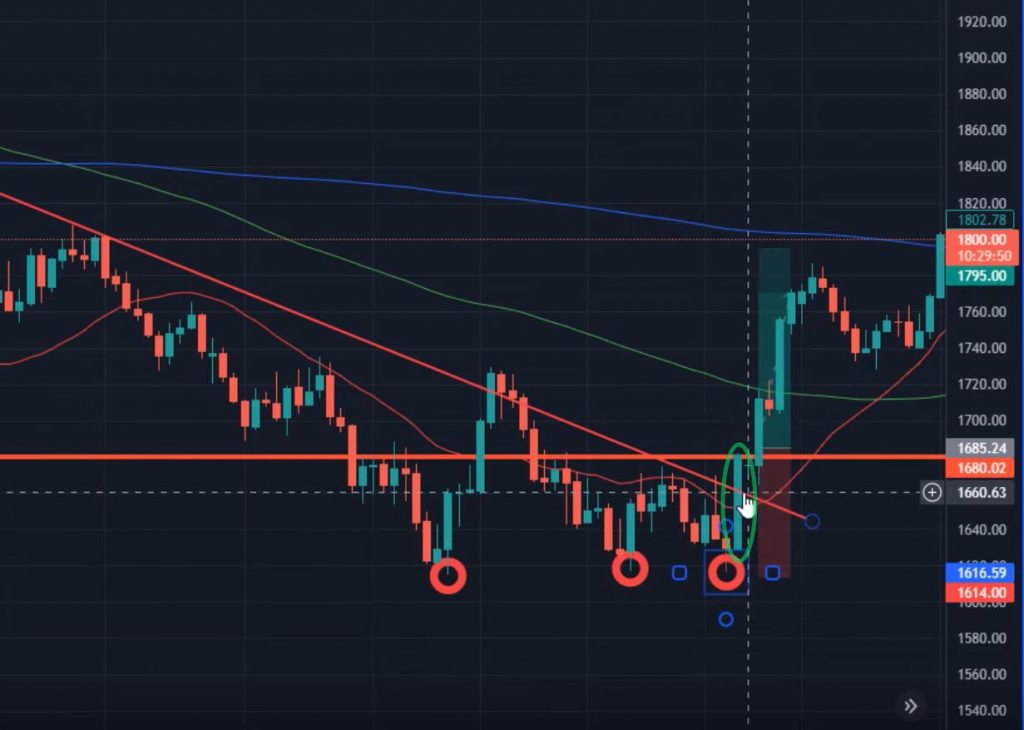
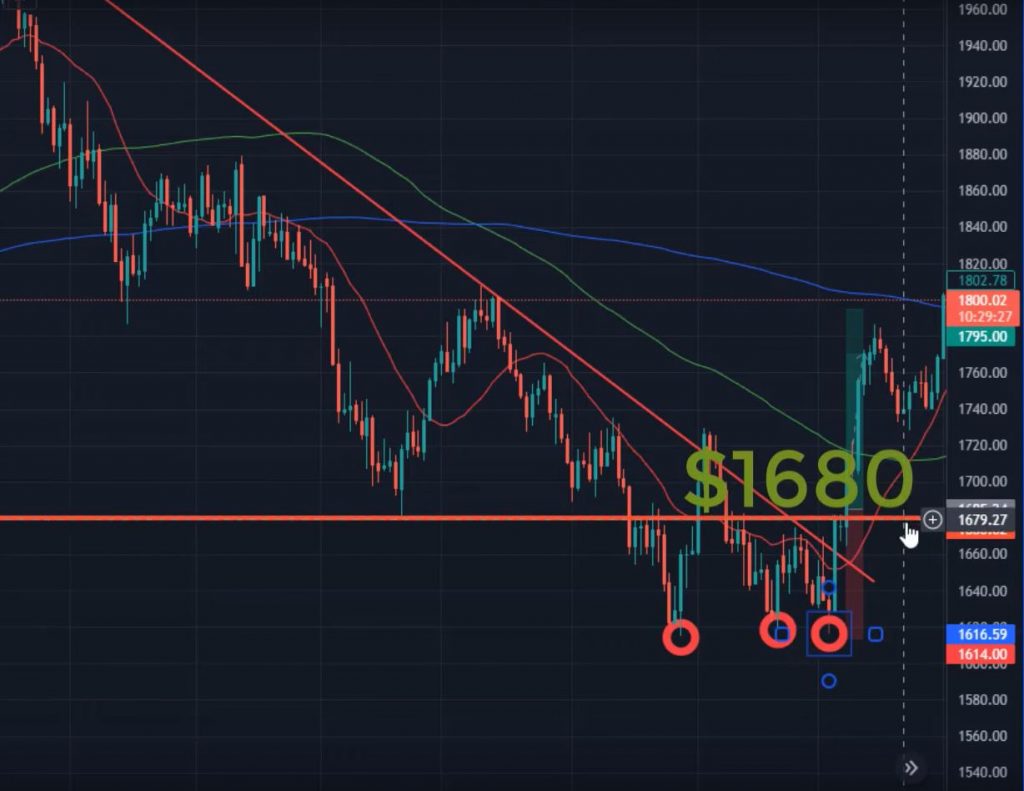
First, we identify a trendline connecting the highest point of a trend to the next lowest point. We see that the price attempts to break through the trendline but fails, indicating a potential trend reversal. We also identify a support level at $1600, which has been tested three times in the past and held each time.
Once the price breaks through the resistance level at $1680, we enter a long position. We set our stop loss below the support level at 1600. We set our take profit just below the previous resistance level at $1795. However, the price fails to reach our take profit level, and we exit the trade once it falls below the 20, 100, and 200 moving averages.
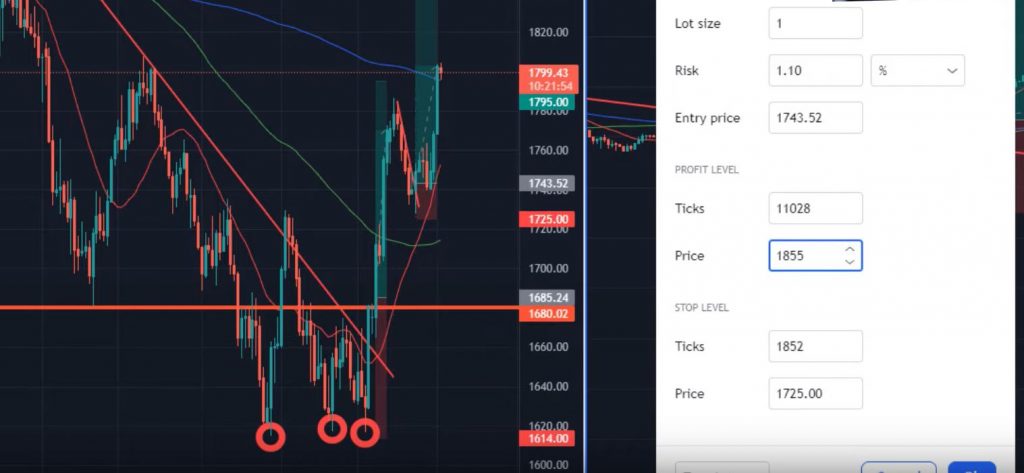
According to this TradingView Strategy, we then re-enter the trade once the price breaks through a counter trendline and the 20 moving average crosses above the 100 and 200 moving averages. We set our stop loss just below the previous bottom at $1728 and our take profit at $1855.
Conclusion
In conclusion, TradingView offers a wide range of tools and features. These can be used to develop a successful Forex and Gold trading strategy. By identifying trends, support, and resistance levels, and entering trades with a solid risk management strategy, traders can increase their chances of success. Remember to always wait for confirmation before entering trades. And set realistic take profit levels based on the current market conditions.