Walk forward analysis is a pivotal tool for Forex traders seeking to enhance the reliability and performance of their strategies. This advanced validation method goes beyond traditional backtesting by addressing critical challenges like over-optimization, which can lead to strategies that fail in live trading. By simulating trading across segmented historical data, walk forward analysis ensures that a strategy is not just profitable in hindsight but robust enough for future market conditions.
As a safeguard against fitting strategies to past data, this process provides a clearer perspective on a strategy’s stability and adaptability. Whether you are refining Expert Advisors or building custom trading systems, incorporating walk forward analysis into your workflow can help mitigate risks and improve long-term profitability. Discover how this essential tool can elevate your Forex trading game.
Table of Contents:
- The Importance of Walk Forward Analysis in Forex Trading
- Key Features of Walk Forward Analysis
- Step-by-Step Process of Walk Forward Analysis with EA Studio
- Comparing Walk Forward Analysis with Other Robustness Tools
- Common Challenges in Walk Forward Analysis
- Best Practices for Walk Forward Analysis in Forex Trading
- Applications of Walk Forward Analysis in Forex Trading
- Advantages and Limitations of Walk Forward Analysis
The Importance of Walk Forward Analysis in Forex Trading
Unlike basic backtesting, which evaluates strategy performance on historical data, walk forward analysis introduces a more rigorous approach by dividing data into segments for optimization and validation. This ensures that the strategy performs well not only in past data but also in unseen, out-of-sample periods, mimicking real-world conditions.
A major advantage of walk forward analysis is its ability to identify over-optimized strategies—those fine-tuned to historical data but prone to failure in live markets. By testing performance across multiple data segments, traders can filter out unreliable strategies and focus on those with consistent results. This process provides confidence in a strategy’s ability to adapt to changing market conditions.
Traders seeking long-term success benefit from walk forward analysis as it promotes robust, future-proof trading systems. It also complements other validation tools like Monte Carlo simulations and multi-market testing to deliver a comprehensive assessment of strategy performance. Whether you’re a beginner or an experienced trader, integrating walk forward analysis into your trading toolkit is a strategic step toward achieving sustainable profitability in Forex markets.
Key Features of Walk Forward Analysis
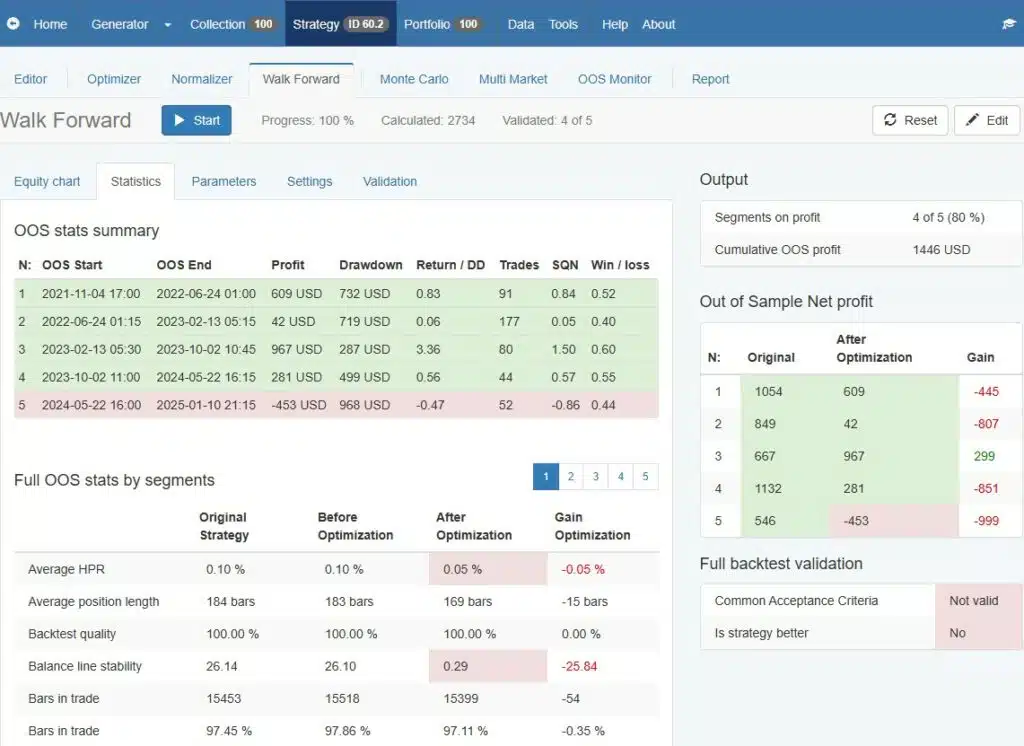
Walk forward analysis relies on two key types of data segmentation: In-Sample and Out-of-Sample. In-Sample data is used to optimize the strategy, while Out-of-Sample data simulates real-world trading conditions to ensure the strategy performs beyond historical patterns.
Visualization of Parameter Changes
In EA Studio, parameter changes are visualized using color coding: green indicates improved performance, while red highlights declines. This helps traders quickly identify how adjustments affect the strategy’s equity line and overall outcomes. Such visual feedback is essential for making informed decisions about refining a strategy’s parameters to ensure optimal performance.
Testing Over Multiple Periods
One of the standout features of walk forward analysis is its ability to test strategies over multiple periods, providing a detailed view of their performance under varied market conditions. By analyzing each segment individually and collectively, traders can identify consistent patterns or weaknesses in their strategies. This segmented approach reduces the risk of overfitting—a common issue where strategies are tailored too closely to historical data, making them ineffective in live markets.
Validation Criteria
Validation criteria in walk forward analysis play a pivotal role. Strategies must demonstrate consistent profitability across all segments while avoiding sharp performance drops. These criteria help traders filter out unreliable setups, focusing instead on those with the potential for long-term success.
By leveraging walk forward analysis, traders can enhance strategy robustness and confidence, ensuring they are well-prepared for dynamic Forex markets.
Are you ready to take your trading strategies to the next level? Enroll in the 21-Day Free Algo Trading Course and gain hands-on experience with Walk Forward Analysis and other cutting-edge techniques. Learn how to optimize, validate, and refine your strategies for real-world success—all guided by industry experts. Start your journey today at EA Trading Academy and master the art of algorithmic trading.
Step-by-Step Process of Walk Forward Analysis with EA Studio
Walk forward analysis is a systematic method used to test and validate Forex trading strategies, ensuring their robustness and adaptability in live markets. This step-by-step process involves the segmentation of historical data and iterative optimization, providing a detailed framework for evaluating strategy performance.
1. Set Up Your Strategy in EA Studio
Generate or import a strategy into EA Studio using historical data exported from your broker. Define optimization parameters, including indicator ranges and step sizes, for precise control over testing. This setup allows traders to tailor their strategy development process to their specific goals and market conditions.
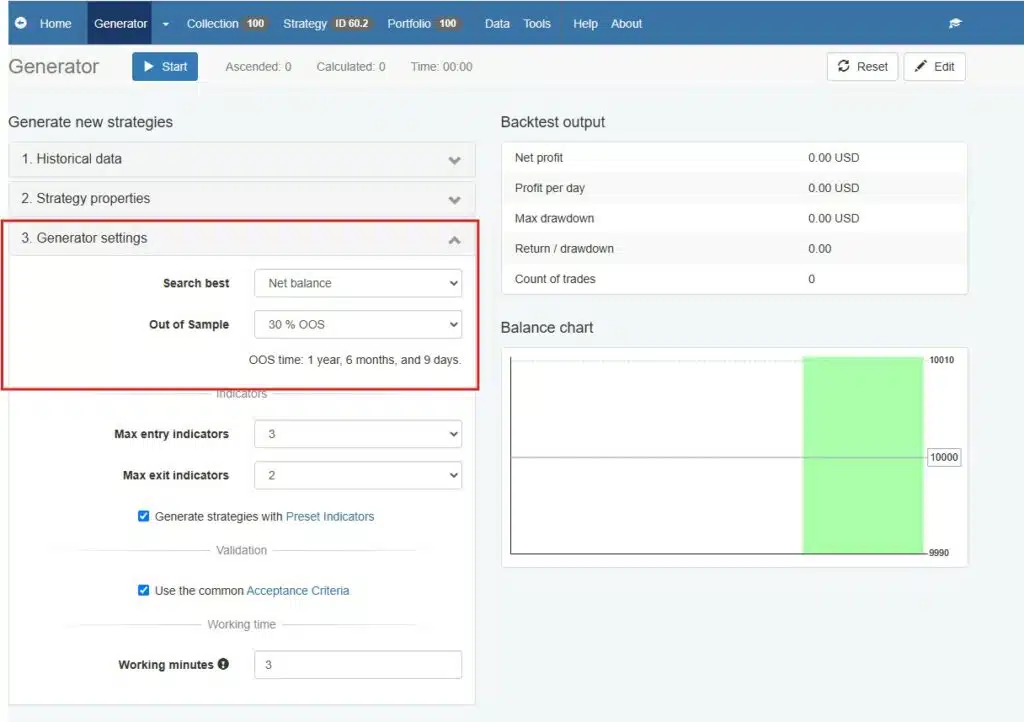
2. Enable Out-of-Sample Data Segmentation
In the generator settings, select the Out-of-Sample option (e.g., 20%-30%). This divides your data into In-Sample (optimization) and Out-of-Sample (validation) periods. For example, with 20% Out-of-Sample, the tool optimizes the strategy on 80% of the data and tests its performance on the remaining 20%. Such segmentation ensures that the strategy’s robustness is assessed across varied market scenarios.
3. Run Walk Forward Analysis
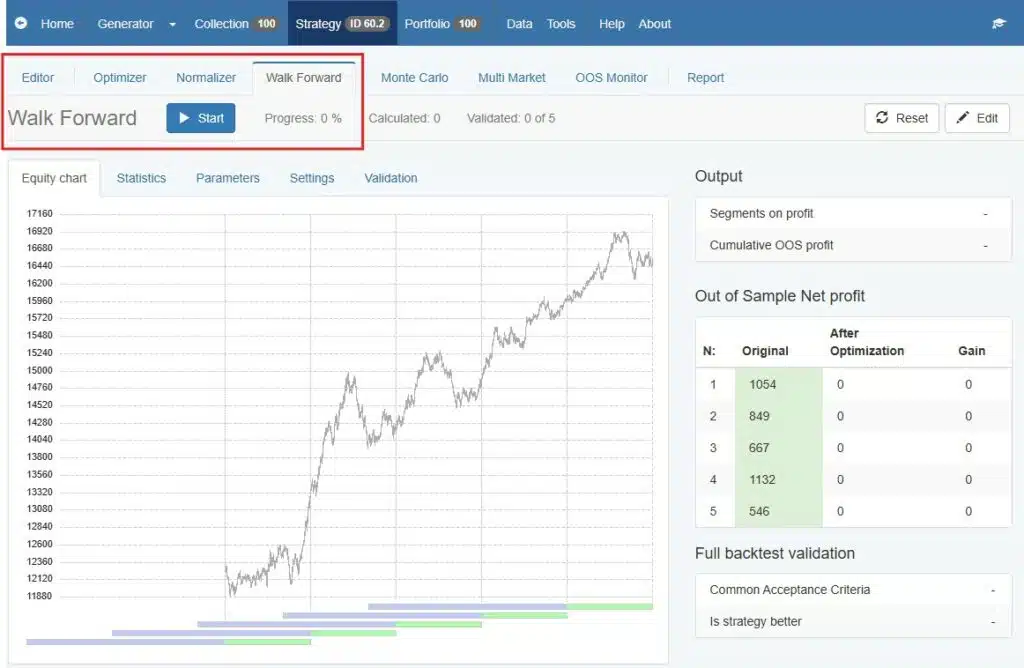
Navigate to the “Walk Forward” section in EA Studio and start the process. The tool divides the historical data into segments (e.g., five segments), optimizing and testing each sequentially. This iterative approach allows traders to pinpoint periods of inconsistency and adjust their strategies accordingly.
4. Interpret the Results
Review equity charts and performance metrics. Successful strategies should show consistent profitability across all segments. Look for validation indicators like net profit, profit factor, and drawdown. Additionally, use these insights to determine whether the strategy’s parameters need further refinement.
To say that the strategy passes the Walk Forward optimization, it needs to have three things:
- One is the strategy to be better.
- Second is the standard Acceptance criteria to be validated.
- Third, to have all segments validated.
5. Refine Your Strategy
If a strategy fails validation, adjust its parameters or acceptance criteria. Combine Walk forward analysiswith tools like Monte Carlo simulations for further robustness checks. This iterative refinement process ensures that the final strategy is both reliable and adaptable to changing market dynamics.
Walk forward analysis provides traders with a structured framework to test their strategies thoroughly, minimizing the risk of over-optimization and increasing confidence in future performance. By adhering to this step-by-step process, traders can develop robust strategies that stand up to the unpredictable nature of Forex markets.
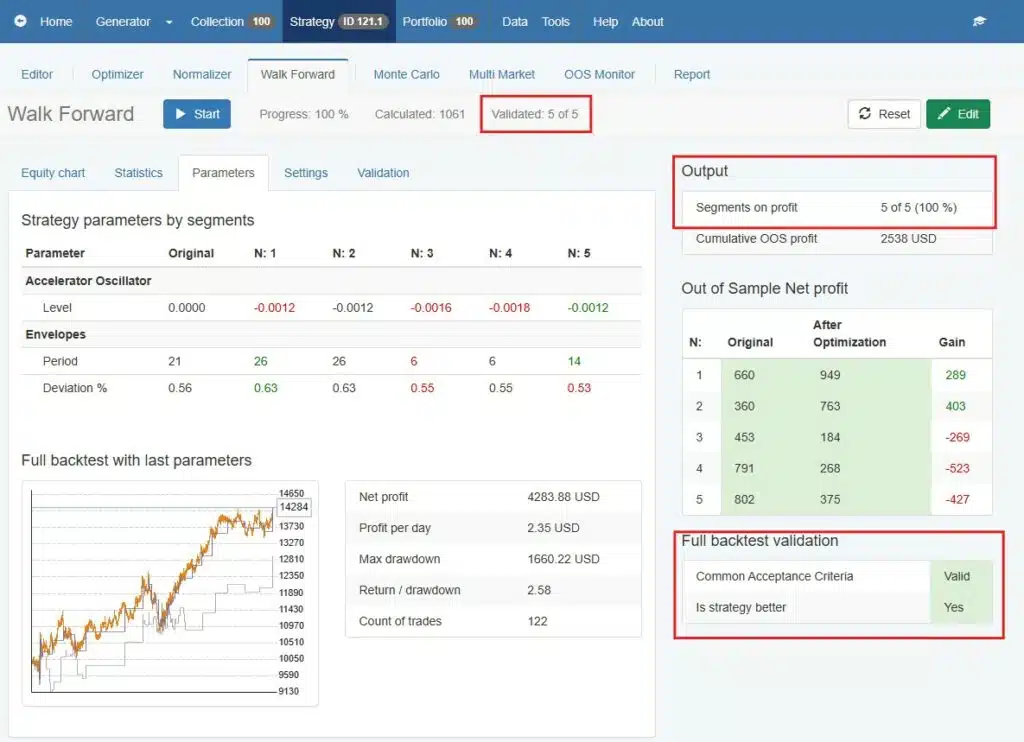
Gain is the difference between Before Optimization and After Optimization.
Comparing Walk Forward Analysis with Other Robustness Tools
Walk forward analysis stands out as a critical robustness tool in Forex trading, complementing other methods like Monte Carlo simulations and multi-market testing. While all three aim to evaluate the reliability of trading strategies, each offers unique benefits suited to different scenarios.
Complementary Tools

- Monte Carlo Simulations: Assess strategy stability by introducing random variations in input parameters and market conditions, providing a probabilistic view of performance. This adds another layer of robustness testing to Walk Forward Analysis.
- Multi-Market Testing: Evaluates strategies across various instruments and conditions to ensure adaptability. By testing performance in diverse markets, traders can confirm their strategies are not overly dependent on specific conditions.
Unique Benefits of Walk Forward Analysis
Walk forward analysis, however, excels in its iterative approach to optimization and validation. By dividing historical data into In-Sample and Out-of-Sample segments, it tests strategy performance under conditions that closely mimic real-world trading. This segmented approach helps identify over-optimized strategies and ensures adaptability to changing market dynamics.
Compared to Monte Carlo simulations and multi-market testing, walk forward analysis is particularly effective for strategies that rely on precise parameter tuning. It provides a more structured and sequential evaluation, making it ideal for traders looking to build long-term, robust systems. Together, these tools offer a comprehensive framework for strategy validation in Forex trading.
Common Challenges in Walk Forward Analysis
While walk forward analysis is a valuable tool for validating Forex trading strategies, it comes with challenges that traders must address to ensure accurate results. One common issue is the risk of misinterpreting results due to small sample sizes. Segmentation of historical data into too few periods can lead to unreliable conclusions, as each segment may not fully represent diverse market conditions. Traders should ensure adequate data coverage and multiple segments for robust testing.
Another challenge is over-reliance on backtesting results without sufficient real-world validation. Walk forward analysis can only simulate market conditions based on historical data, which may not fully reflect future price behavior. Strategies validated through this process should still be monitored closely during live trading to confirm their adaptability.
Lastly, traders often encounter discrepancies between backtested and real-world performance. Factors such as slippage, trading costs, and execution delays can significantly impact a strategy’s profitability in live markets. These discrepancies highlight the importance of using walk forward analysis as part of a broader validation framework that includes live testing under realistic conditions.
By recognizing these challenges and integrating complementary tools like Monte Carlo simulations, traders can enhance the effectiveness of walk forward analysis and develop robust, future-proof strategies.
Best Practices for Walk Forward Analysis in Forex Trading
To maximize the effectiveness of walk forward analysis in Forex trading, adhering to proven best practices is essential. These practices ensure that your trading strategies are robust, reliable, and ready for real-world performance.
1. Set Realistic Out-of-Sample Percentages
A balanced division between In-Sample and Out-of-Sample data is crucial for accurate validation. A common and effective ratio is 70% for In-Sample (optimization) and 30% for Out-of-Sample (validation). This split allows for sufficient data to fine-tune the strategy while testing its performance in unseen conditions, mimicking live trading scenarios.
2. Use Well-Defined Acceptance Criteria
Establish clear criteria for evaluating strategy success during walk forward analysis. Examples include consistent profitability across segments, low drawdown, and a minimum profit factor. These criteria help filter out over-optimized or unreliable strategies and ensure only the most robust systems are used for trading.
3. Combine Walk Forward Analysis with Other Tools
To strengthen your validation process, integrate walk forward analysis with additional robustness tools like Monte Carlo simulations and multi-market testing. Monte Carlo simulations assess strategy stability under variable conditions, while multi-market testing evaluates performance across different instruments and market environments.
By following these best practices, traders can reduce the risk of over-optimization and improve their strategies’ adaptability to changing market conditions. Walk forward analysis, when used strategically, is a powerful tool for building long-term success in Forex trading.
Applications of Walk Forward Analysis in Forex Trading
Walk forward analysis has versatile applications in Forex trading, making it an essential tool for traders seeking reliable and adaptable strategies. By integrating this method into trading platforms like MetaTrader 4 and EA Studio, traders can enhance the robustness of their Expert Advisors (EAs) and reduce the likelihood of strategy failure.
In platforms like MetaTrader 4, walk forward analysis helps optimize and validate trading algorithms by dividing historical data into In-Sample and Out-of-Sample segments. This segmentation ensures that strategies are not overfitted to past data, providing more accurate performance predictions for live trading. EA Studio, another popular platform, streamlines this process with advanced tools that automate walk forward analysis, saving time while maintaining precision.
Check out this video to find out more how to apply Walk Forward in MetaTrader4.
A practical application of walk forward analysis can be seen in testing a trend-following EA. By segmenting historical data into five periods, traders can validate the strategy’s adaptability across varying market conditions. If the strategy demonstrates consistent profitability across all segments, it indicates a high likelihood of performing well in future markets.
Additionally, walk forward analysis is invaluable for improving the robustness of existing EAs. By identifying weaknesses during the testing phase, traders can refine their strategies, adjusting parameters to enhance reliability.
This method not only minimizes risks associated with over-optimization but also builds confidence in deploying strategies, making walk forward analysis a cornerstone for successful Forex trading.
Advantages and Limitations of Walk Forward Analysis
Walk forward analysis offers Forex traders a powerful method to validate and enhance their trading strategies, but like any tool, it comes with its own set of advantages and limitations. Understanding these aspects helps traders use this technique effectively.
Advantages
One of the key benefits of walk forward analysis is its ability to mitigate over-optimization risks. By testing strategies across multiple In-Sample and Out-of-Sample segments, traders can identify those overly tuned to historical data and unlikely to perform well in live markets. This process ensures the development of robust strategies capable of adapting to future market conditions.
Another significant advantage is the clear insight into strategy reliability. Walk forward analysis allows traders to simulate real-world performance under varied conditions, providing a realistic picture of a strategy’s potential. It also complements other robustness tools like Monte Carlo simulations, offering a comprehensive validation framework.
Limitations
Despite its strengths, walk forward analysis cannot guarantee future profitability, as it relies on historical data to make predictions. Markets are inherently unpredictable, and even robust strategies may face unforeseen challenges in live trading.
Additionally, the process can be computationally intensive and time-consuming, particularly for strategies requiring extensive optimization over large datasets. This complexity might discourage novice traders or those with limited computational resources.
By balancing these advantages and limitations, traders can use walk forward analysis strategically, combining it with other tools to build reliable and adaptable trading systems.
Conclusion
Walk forward analysis is an indispensable tool for Forex traders aiming to develop robust and adaptable trading strategies. By validating performance through segmented testing of historical data, it minimizes the risks of over-optimization and ensures strategies are better suited for real-world conditions. This method provides traders with a clearer understanding of their strategy’s reliability, enhancing confidence in its long-term potential.
To achieve optimal results, walk forward analysis works best when combined with other validation tools like Monte Carlo simulations and multi-market testing. Together, these methods offer a comprehensive framework for building and refining trading strategies.
If you’re looking to enhance your trading performance, experimenting with walk forward analysis tools on platforms like MetaTrader 4 or EA Studio is a great starting point. Incorporate this robust method into your trading toolkit to stay prepared for the ever-changing Forex market.

