Trend following indicators – the first group of indicators in MetaTrader.
Trend following indicators is what we will talk about here. Hello, dear traders and welcome to the trend following indicators section.
In this section, I will go through all the indicators, that are available in MetaTrader, and I will show you the very important from each one. And I will not go to theories and formulas and very, very complicated things.
Because you really don’t need to know what is the formula, for example, behind the indicator. What you need to know is how to put it on the chart, how to read it and what signal the indicator gives us and how it helps our trading. And we need the indicators because if we don’t have indicators, if we just look at the plain chart over the candlesticks or the bars, we cannot understand and we don’t have an idea where or when to enter or to exit from the market.
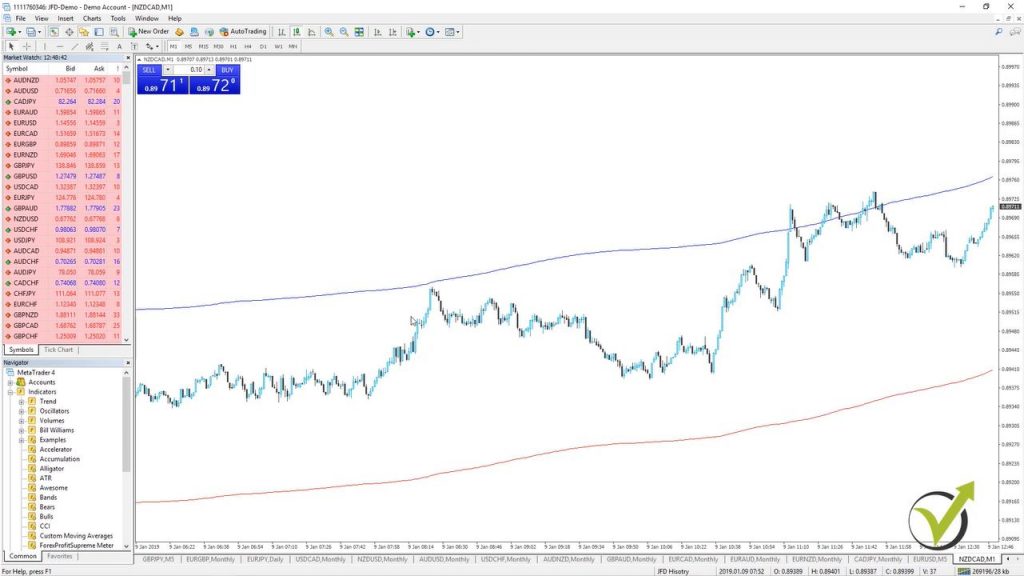
Now, the indicators in MetaTrader are grouped and I will start in this first lecture with the Trend following indicators. If you look at my chart, I have just made my chart bigger by removing the terminal. And actually, from view, you can remove the terminal, the navigator, the data window, the market watch or you can choose to see the strategy tester.
This is for the Expert Advisors and you see on the right side there are the combinations. So, for example, the Navigator is Ctrl + N. And you see if I press Ctrl + N it will disappear, and then it will appear again. And it is the very same for the others.
So just now I want to have a little bit bigger chart in front of me where I will demonstrate to you how to place the trend following indicators over the Meta Trader chart.
Now basically, you have two options.
One is from the navigator. You need to click on the plus in front of the indicators and here you will see all indicators. They are grouped in Trend following indicators, Oscillators, Volumes, Bill Williams and then we have the custom indicators below. Or you can place them on the chart:
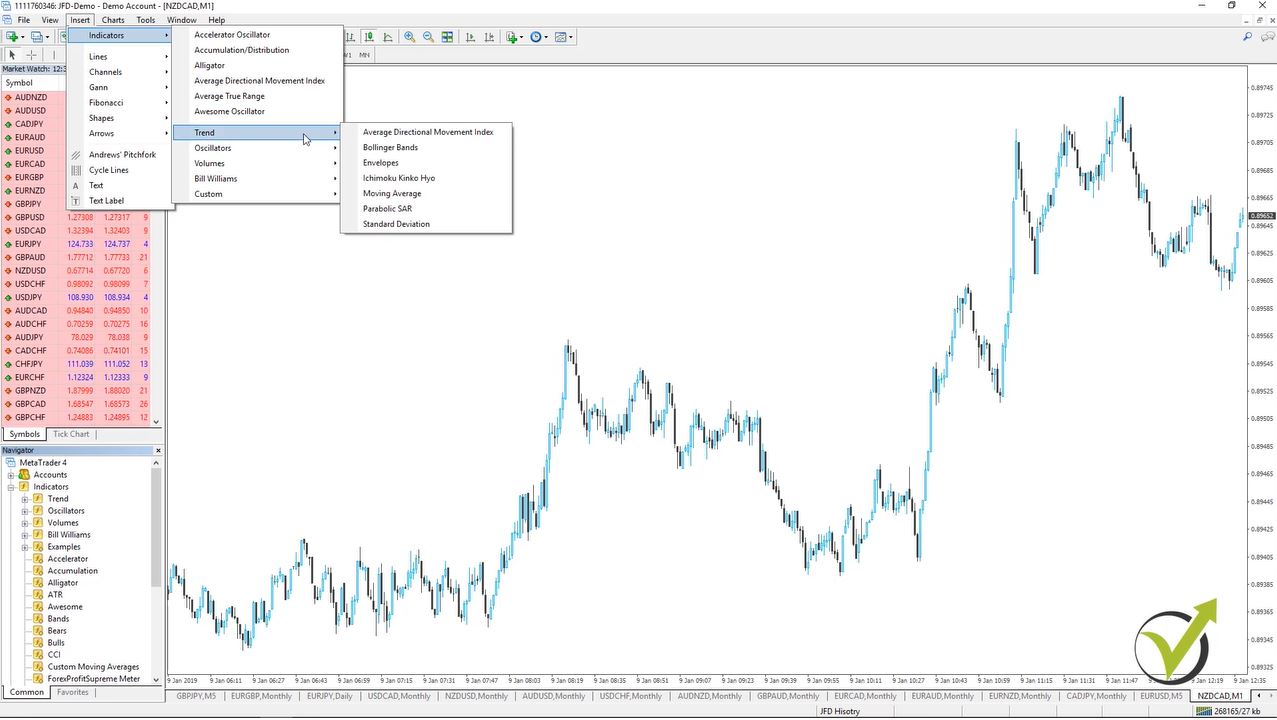
If you go on the top menu and you go on insert, indicators and you see here we have some of the trend following indicators.
What groups of indicators we have in Meta trader?
- Trend following indicators
- Oscillators
- Volumes
- Bill Williams
- custom indicators.
So the good thing with the Meta Trader as we said at the beginning of the course is that you can place custom indicators. If you have bought some or if you have found them somewhere online. You can place them over here.
Let’s have a look now at the first group. Where are the trend following indicators, and I will go to the Average Directional Movement Index?
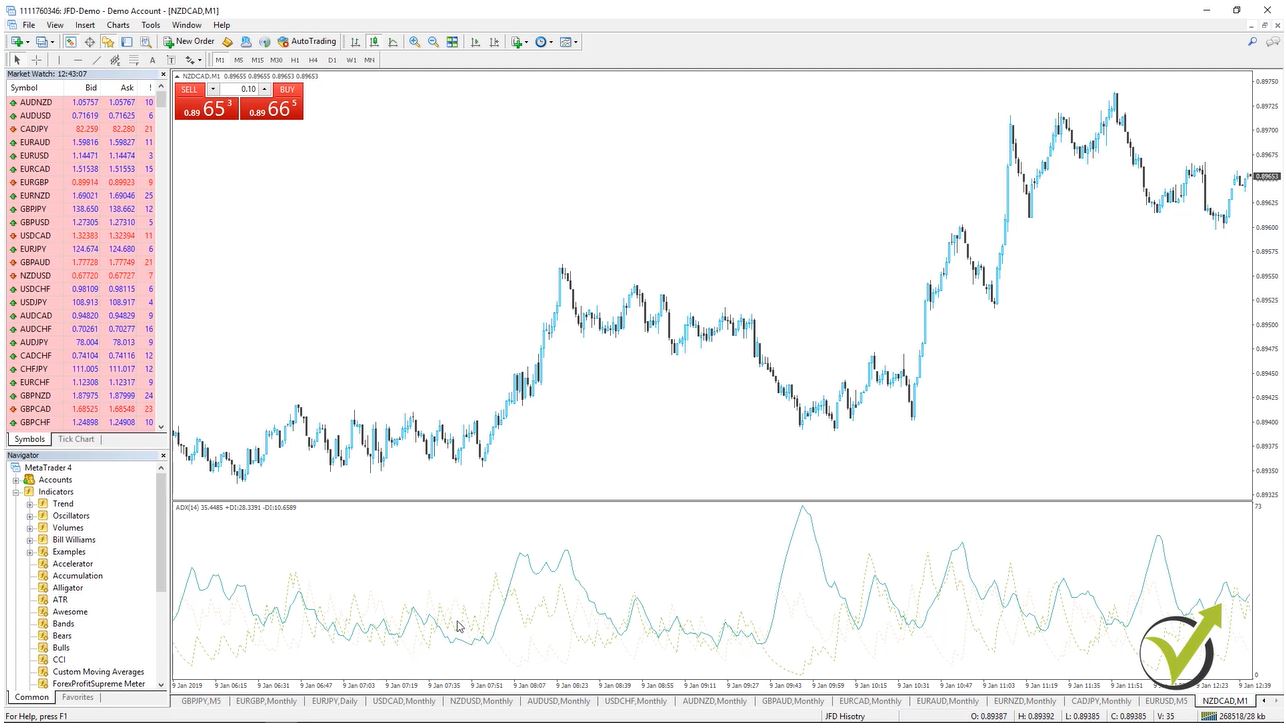
This is a trend indicator that comes from Mr. Wilder, a very famous trader during the last century. The basic strategy that we have over here is that he recommended to buy when the positive DI is higher than negative DI. And selling when the positive sinks below the negative. If I put the mouse exactly on it you will see this is the negative one, which is in this bright yellow color, and then I have the green one which is positive.
And all trend following indicators in Meta Trader, you can customize. If I go to indicators list and here is the Average Directional Movement Index I go to edit. You can see there are the colors so you can change it to any other color, which will make it more visible.
You will see now, it is red so it’s much more visible where is the line. And with very simple words here this trend indicator helps to determine if there is a price trend or not on the market. And by crossing he said that we will filter, actually, the entries and we will have fewer entries there. This is the very, very basic theory of this indicator.
Now, let’s go to the second trend indicator.
This is the Bollinger Bands. This is one of my favorite trend following indicators in Algorithmic Trading. It is represented by two lines, which are going over the price and the other one is going under the price and then there is one middle line as well:
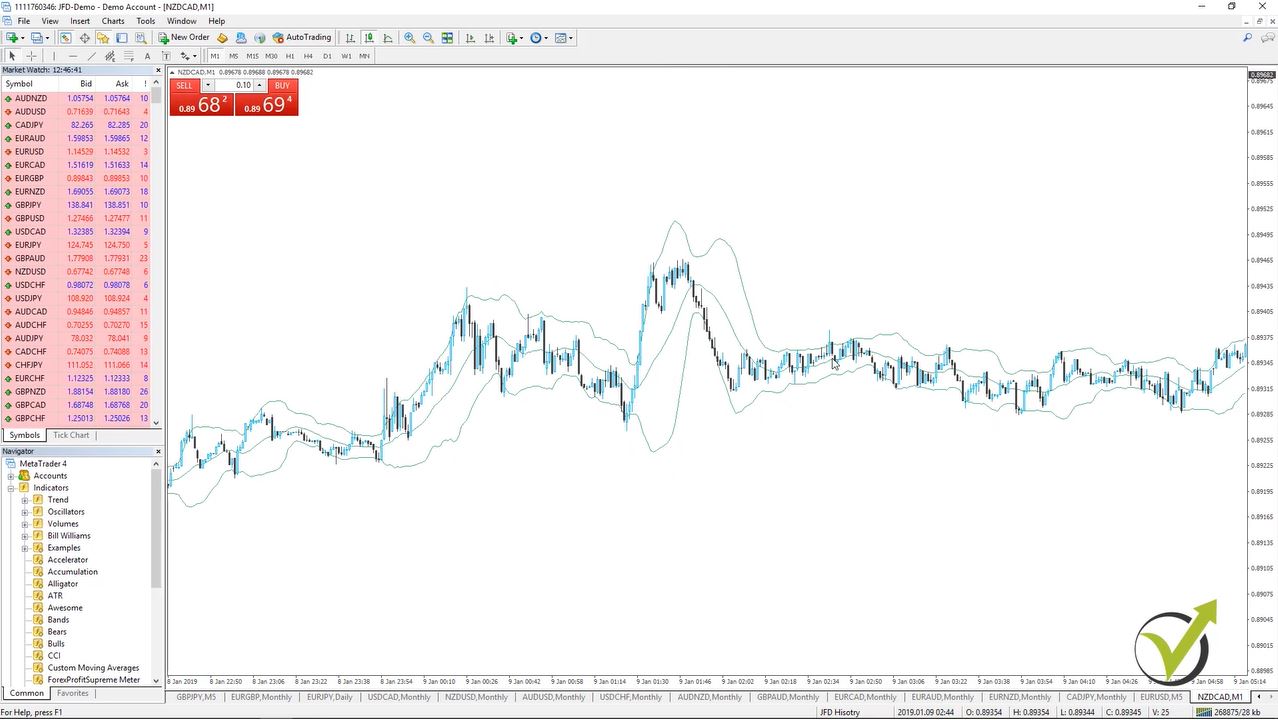
This indicator is very, very similar to the envelopes, another indicator we will look at. And the main difference is that envelopes are having constant distance between the upper and the lower line and the Bollinger Bands are having a certain number of standard deviation away from the middle moving average line.
And if I just move the chart a little bit you will see what’s going on when there is volatility. Actually, when the price makes a huge move the Bollinger Bands are getting far from each one. And when the market is calm there is no huge movement. They are getting much closer.
So there are different strategies here as well.
For example, one is that if the price break through one of the bands. We can expect that the price will continue in this direction or just the very opposite that, if the price gets out of the band or if we have a closing below the band. And then we have a closing above the band we might expect to reverse or the third strategy over here.
Which is a very simple move starting from one of the band always reaches to the other band. So there are many variations using this Bollinger Band trend indicator. Which as I said I am using a lot in Algorithmic Trading.
And of course, as said already you can change or customize the indicator same as all trend following indicators in Meta Trader just to make it more visual or comfortable for you.
The third among all trend-following indicators is actually the Envelopes:
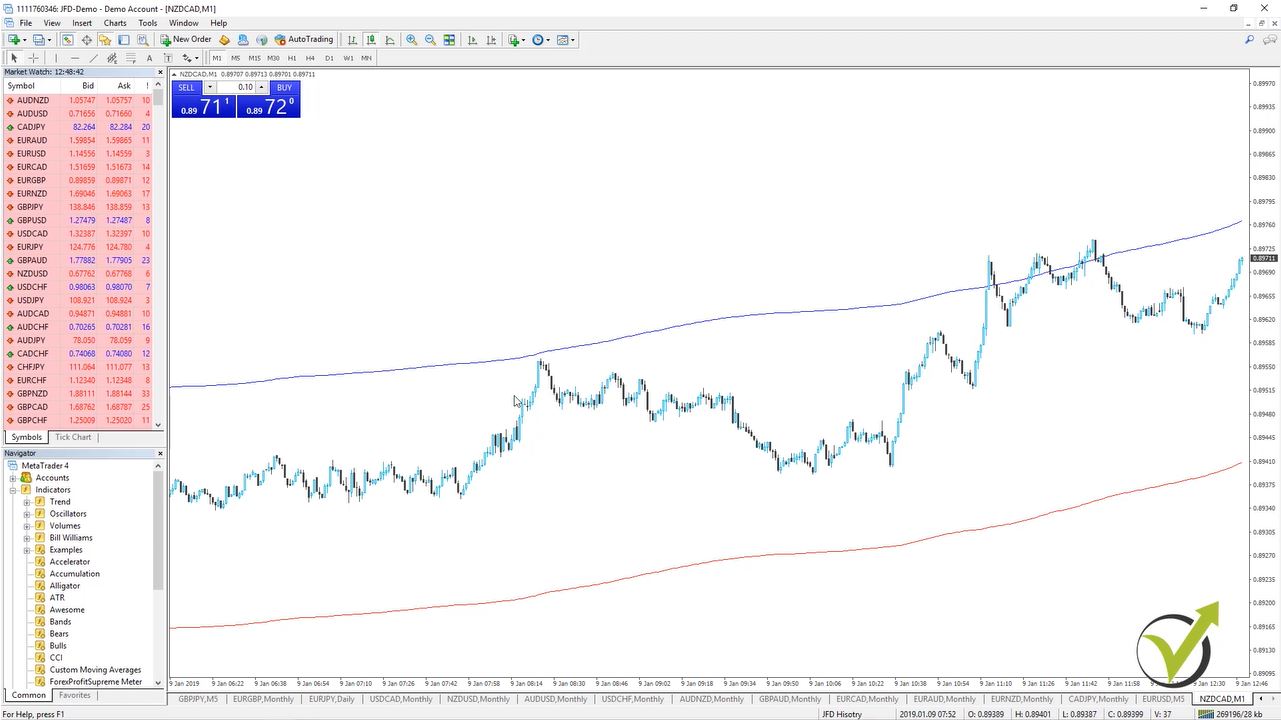
So what I’ve said is that the two lines here are keeping a constant distance between each other and you can see they form kind of trend direction when the price is going up. Now, you can see on M1 on NZDCAD (I just picked random here) the chart, guys, doesn’t matter I just want to show you the trend following indicators.
Let’s go to a higher time frame like H1. So what you will see here is that this indicator is lagging after the price. So the price went below it then it’s changing direction downwards, and then the price broke above. And then the Envelopes are getting higher. If I continue you will see that simply the Envelopes are following the price. And from the inputs of the Envelopes, if you change the deviation percentage.
So for example, if I go to 1% there will be a bigger distance between these two lines. And these two lines are simply moving averages. Which are shifted upwards and downwards and the very, very simple strategy here as well is that when the price touches one of the Envelopes it will go in the other direction. So we need to buy. And this I can say is for the range market when the market is in range.
But when it is trending you can see when the price broke this Envelope, moved above the upper band actually of the Envelopes. So again I say there are different variations of the strategies but this is how the envelopes look in Meta Trader.
Now, let’s remove this indicator and proceed to the next one.
And the fourth between all trend following indicators here is Ichimoku indicator. Which is a very interesting indicator. Very colorful on your chart it has this cloud that normally plays the role of support and resistance. So when the price is above the cloud, the cloud is support. And when the price is below the cloud, the cloud is resistance and we have these lines:
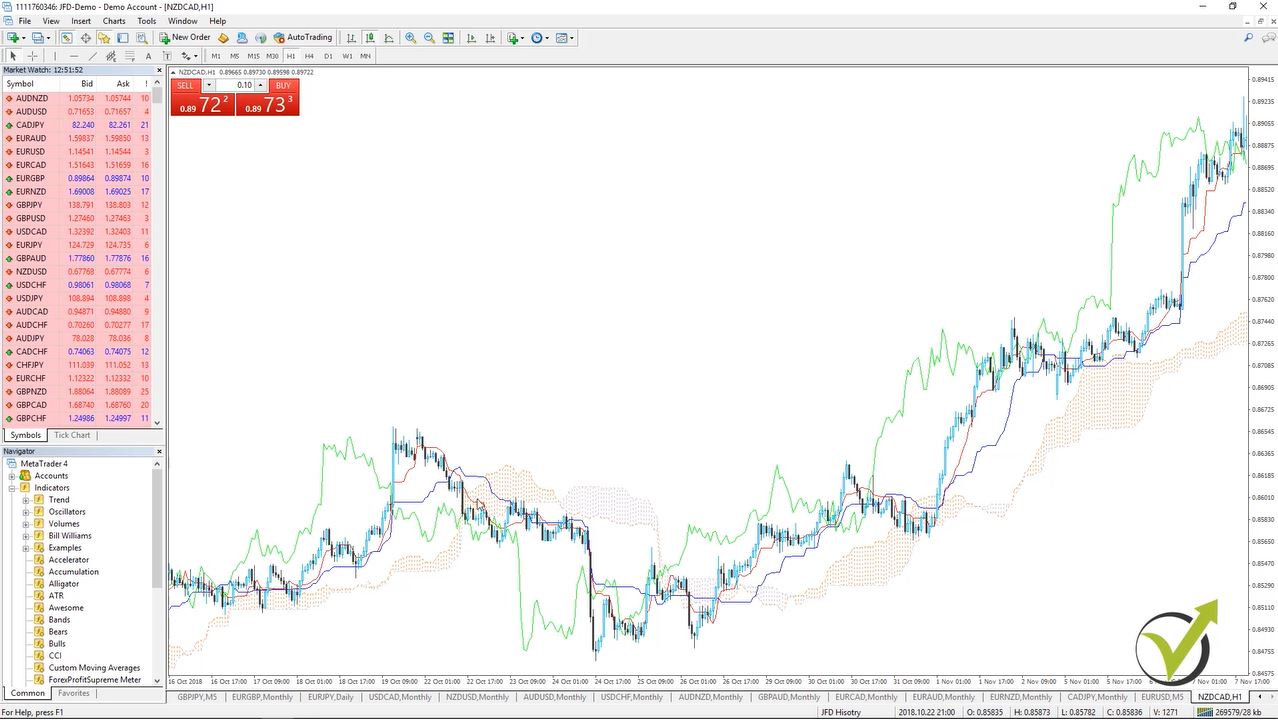
One is the Tenkan-sen, the other one is the Kijun-sen, Senkou-sen span A and Senkou span B. Which are actually forming the cloud. And again here for the strength indicator, there are many strategies that could be used. Normally, we have a standard strategy for each indicator and with the time, of course, many more were invented.
Now, going to the fifth indicator.
Which is the Moving Average, probably one of the most famous trend following indicators in all times. It is just a line that follows the trend. We can say with very very simple words. There are different methods to calculate the moving average.
What are the different methods to calculate the Moving Average?
- Simple MA – the base in many trend-following indicators
- Exponential – is the one that many manual traders prefer
- Smoothed – goes together with the price
- Weighted – gives more weight to the current price
These are the four methods that are used in Meta Trader. Let’s place a simple moving average period of 50 on our chart and you will see how this moving average follows the price. So here again many strategies that we could buy when the price goes above the Moving Average:
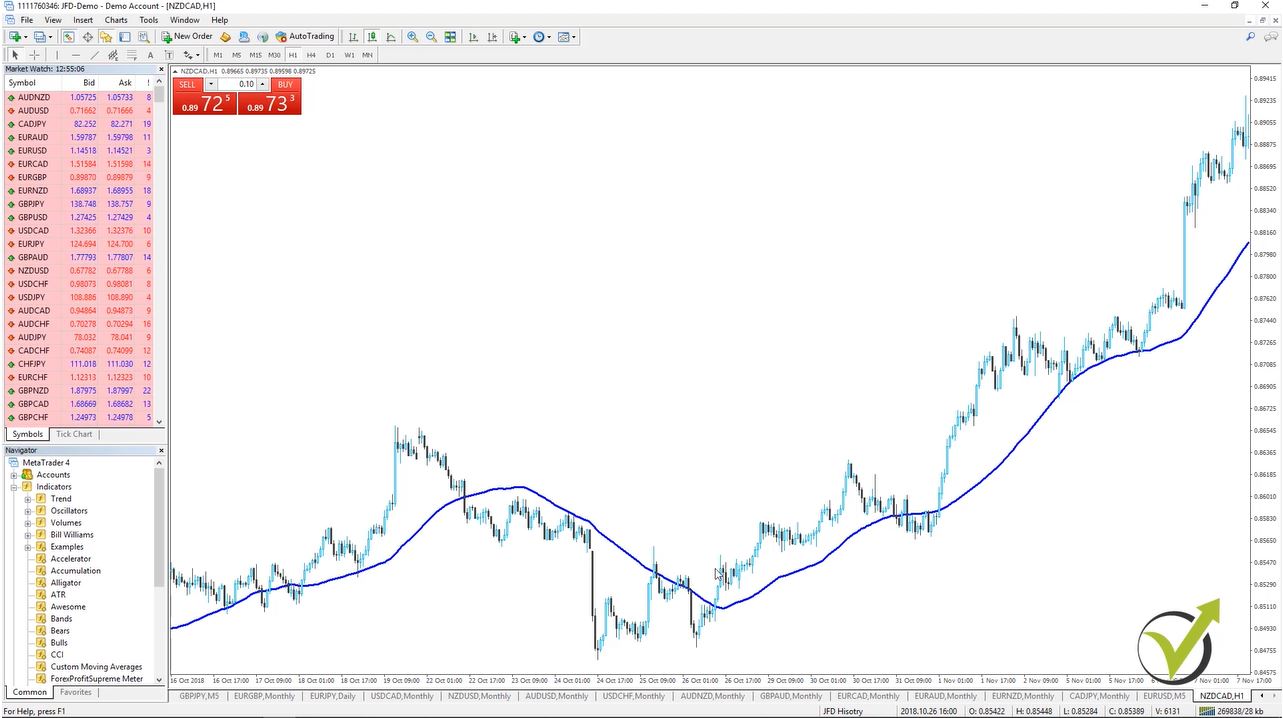
We can sell when it goes below, we can buy again. But if you have already experienced you will know that the Moving Average works well when we have a trend, when we have a strong move. But when the price is in range, so for example if we concentrate over here we will buy, we will sell, we will buy, we will sell so many times that most probably at the end you will end up losing for this period of time.
That is why when we combine trend following indicators the best results are coming. That is why later on in the course I will show you how it is best to combine a couple of indicators instead of using only one indicator. And actually combining indicators make the entry on the market stronger and simply this way we filter the entries.
I will continue with the sixth between all trend-following indicators that we have here.
This is the Parabolic SAR:
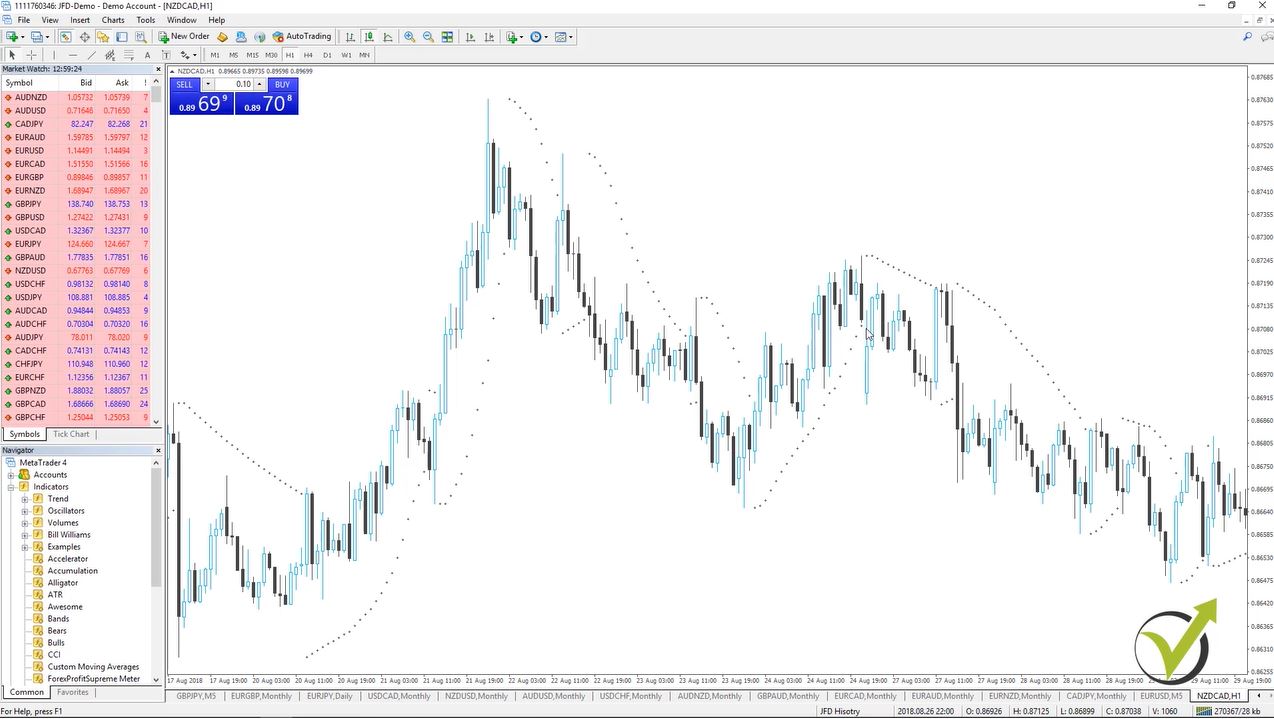
I will click on OK and actually not really visual with my white background so let me just edit it. I will change it to black. And you will see I have these dots that are on the top of the price, then we have dots that are below the price and actually this indicator is very, very similar to the Moving Average indicator but looks different from the other trend following indicators.
Let me just zoom it. But it looks really different because it’s displayed above the candlesticks and below the candlesticks. It shows when the price is in a bullish market, so meaning that the price is going up.
So we have the indicator below each candlestick and when the price crosses you can see here I have one, two, three the price crossed and it changed. So the market changed and here again the price crossed and the dots came under. And then when the price crossed again they came above. Actually, this indicator gives great signals for exits.
If we are on the market, let’s say we have bought somewhere here for any reason, and when the price breaks this SAR indicator, the Parabolic SAR trend indicator. It is time to take our profit because probably the market will change direction after that? So it gives us great exit signals.
And the last indicator that I will talk about in this lecture for the trend indicators, this is the Standard Deviation.
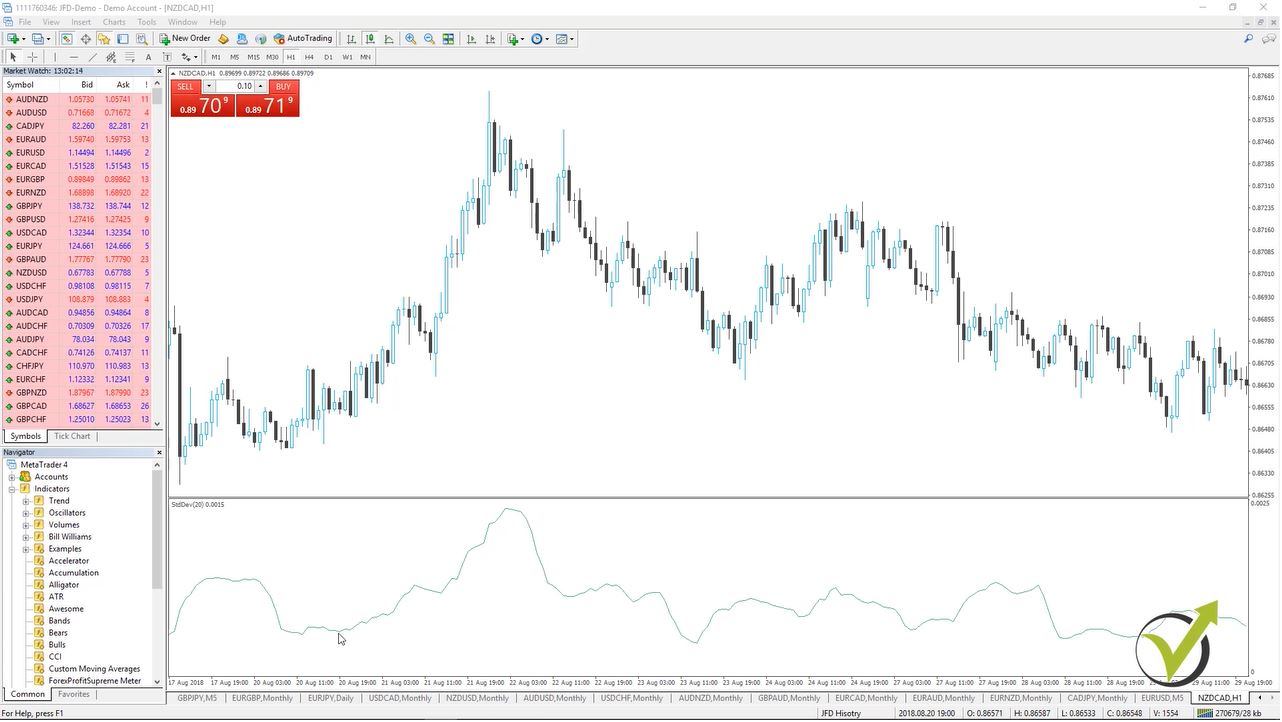
I will just use the standard inputs as I have used in the previous examples. Now, with very, very simple words here, if the value of this indicator is low it means that the market is not volatile, it’s inactive. And we can expect some volatility. Or when we are having high value for the indicator we can expect the market to calm down and to get into range for some time.
And if I switch, for example, on M15 you can have a look at the indicator as well. And actually, all trend following indicators are used on different time frames. So it really depends on your strategy, what strategy you have and how you are using these indicators.
So these were the trend following indicators on the Meta Trader platform. And in the next lecture, I will continue with the Oscillators indicators in Meta Trader.
Thank you very much for reading.
If you have any questions, please write in our forum!
All of these you can find on our website.
Cheers!

