Support and resistance – the most important levels on the market
Support and resistance are the most popular price action techniques. Hello, dear traders, this is Petko Aleksandrov, head trader at Forex Academy and I continue now with the support and resistance, which are the critical levels on the market where we need to be careful. And if the price goes towards those levels, we need to pay a little bit more attention.
This is a free lecture from the course Price action trading course: Bitcoin and the Cryptos.
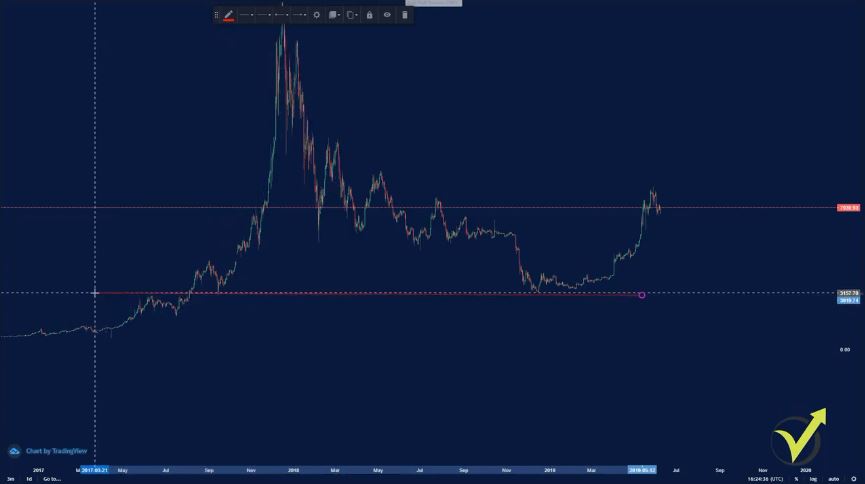
I will make the chart big so you can see better. I will place one support level just below the lowest price where the Bitcoin reached during 2019. So here it is just below the price.
Now, keep in mind that I always draw the support and resistance lines on a daily chart. Now, let me increase this line, and I will go before the huge move in 2017 and the beginning of 2018, this one over here. And you can see that right here we have a significant level.
So how a support line should be drawn?
- it should have been first a resistance
- impulsive break
- it should have been a support
It should have been first resistance, and as you can see in the picture above, it was resistance. Then the price should break it impulsively. We have here the impulsive break.
Do not look for the perfect support and resistance because you will not find it
The impulsive break is when the price breaks the price with a huge candle and it closes on extreme.
After that, it was support. You can see that the price retested this level, and then it continued higher. And now this level is a support again nearly after one year.
We want to draw it just where the price stopped, and this level became resistance, and after that, the price retested it, and this line became support. So I will move it right precisely at the spot.
You can see in the picture below this is an excellent example of critical support and then resistance line. First, the price stopped this level at about $3,000, and then it went below.
We have an impulsive break, this is an impulsive break, and then the price retested this level again and continued higher. And 3,000 is a psychologically important level because it’s 3,000.
Round numbers always matter.
It’s a round number, and every round number matters on the market.
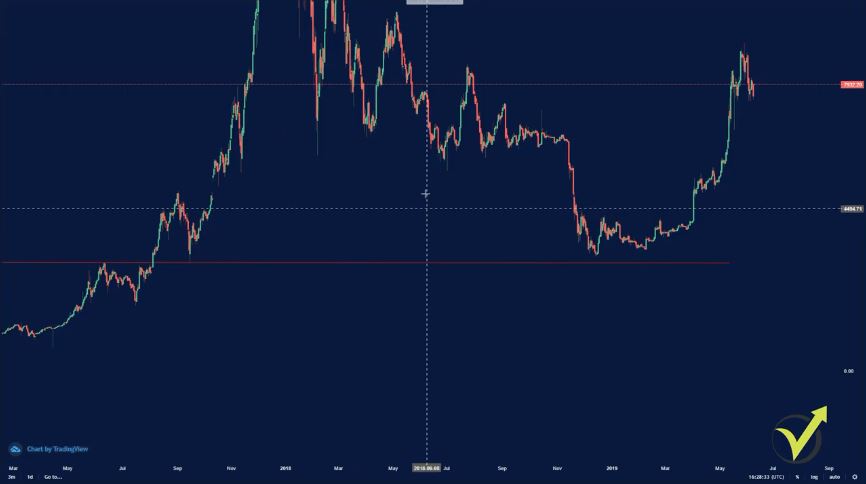
And you can see that this year the price failed to take this level. Let me look now for a couple of more examples.
I will copy this line, you can copy a line on the platform by pressing control + C and then control + V, and you’re just pasting it. We said an critical level is where the price first was support, then it was resistance. So somewhere here we can place another level, let me zoom in a little bit.
You can see in the picture below the price first failed to take this level, and then it pulled back, it tested the other support line that I have placed and then broke aggressively, retested it again. So if you don’t see exactly the place between where the price failed from below and where the price failed from above, you just place it in the middle.
So I will leave the line right over here. It is another round number of 5000, so I can leave it to 5,000. Even not precisely on the place, but I will leave it this way.
With the recent market conditions, it changed from support to resistance.
And you can see the price failed, and then went below down to 3,000, and then went above, retested, and continued higher. Now, let’s have a look at how this line affected the current market conditions. And you can see now with the recent move where the price went higher.
Here, it had a hard time breaking the level. When it did, still the price retested and continued higher. So you can see that even after some time, nevertheless, this level is essential. It was at one time important. It is important again.
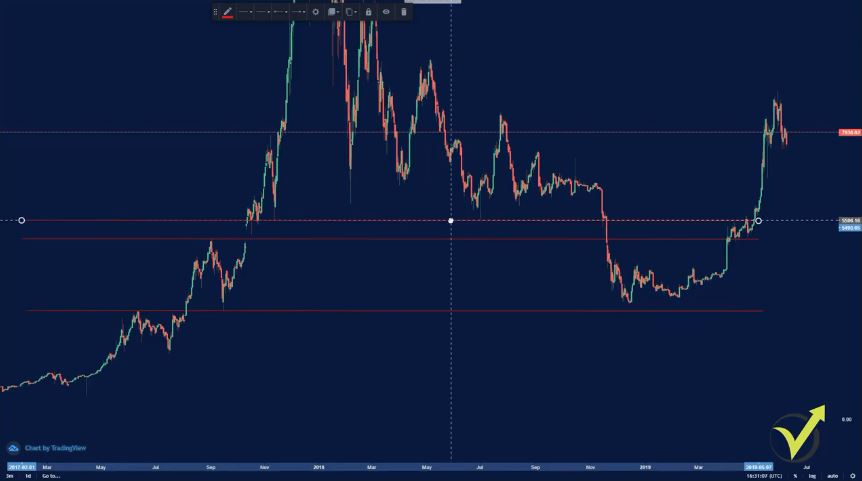
And then I can see another level right over here. Let me take one more line. It is just over here. So you see at this level of 5,500 where we have one time, two times, three times, four times, being support, now with new market conditions it was resistance.
Let me zoom in and try to make it in a better place. So it’s right over here, just a little bit higher. At 5,500. Another round number.
These are the 3 important support lines for the market.
As I’ve said even the hundreds matter and you can see that we have support a couple of times, it breaks impulsively lower, and then when the price went again higher it failed at this moment to take this level.
Then it broke, failed again, retested the other line that I placed, and continued higher. So these are three essential support lines that we have for the market. Of course, you can draw more.
You can see at this moment there is a new top, this is just above the level of 6,000 closer to 6,200. Then you can see the price broke, it retested it, but more it retested 5,500. And then you can see here it retested it one more time, the second time, third time, fourth time, fifth time, on the sixth it broke below, and here with the recent market conditions, it just broke back.
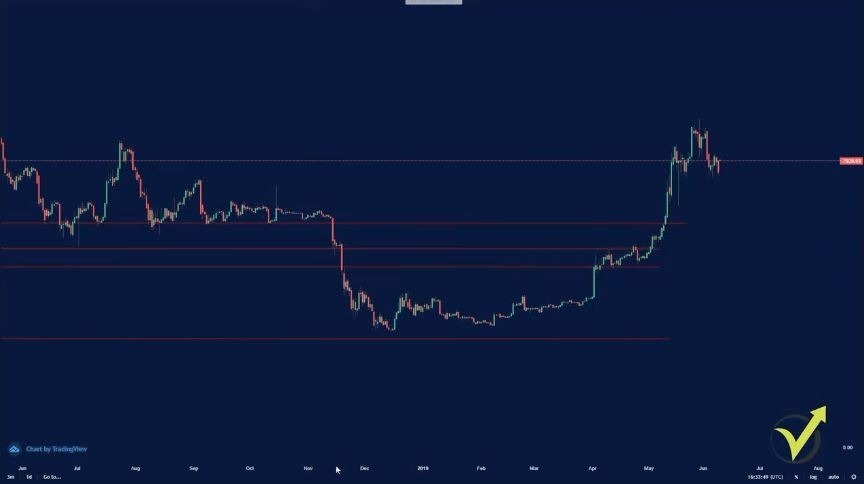
I keep the support lines red and the resistance lines green.
Now, to make it clear, when we put these lines, it doesn’t mean that every time the price should stop there. But we’re looking for these lines, for these levels where the price stopped at least two times. One time is a resistance, one time being a support, and one time having an impulsive break.
So you can leave a line as a support or as resistance if you see the level being one time support, one time resistance, and we have an impulsive break through this line. And of course, if it has more touches like this one over here, it makes this level even stronger. And getting closer to the current price, I don’t see a place right now where I might want to have another support.
You can see they don’t match, and I don’t see a place where I have support and resistance at the same time, and where we have an impulsive breakthrough. So on the other side is the same. On the top, we have the resistance lines, and they’re drawn in the very same way.
But in this case, I will make the line just green. And here we’re looking for the level where the price might stop if it is going up. While in the support lines, we are looking for the levels where the price might stop if it goes down.
An impulsive break is what I am always looking for
So I will place now one resistance line at about the $9.000, we can see that the price recently stopped. Let me put it precisely at 9.000. Let me try to put it a little bit closer to where the price stopped.
Very close to the 9,000, actually closer to the 9,100. And so let’s have a look if this level was important in the past. Right here, we can see that this level was resistance. And right here we can see that this level was support.
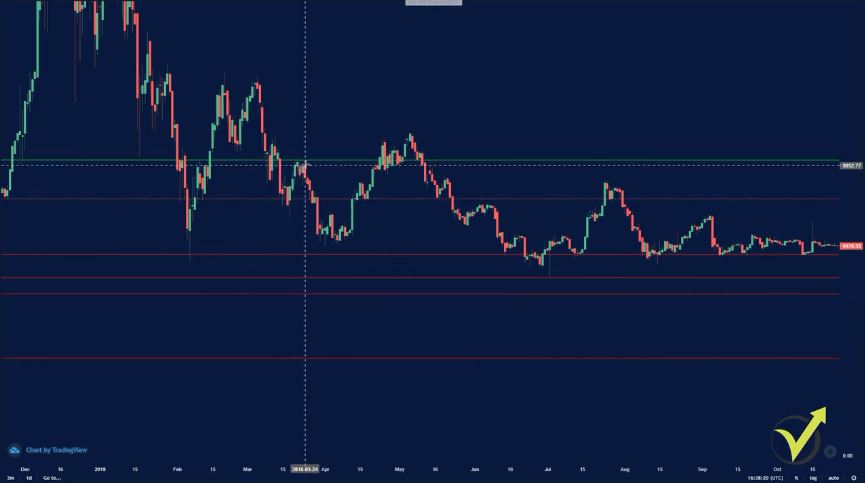
And going back, we can see that we have an impulsive break.
So you can see the price stopped when it was going down in January 2018. And then we have an impulsive break right here, after being support. This level became a resistance. Another break, then the price failed.
So we have a couple of times, and I can leave this level, which is just a little bit higher than the recent high that we had, and this is just fine. Now, I will leave only one resistance level, and I will leave it on you to build on your chart the other resistance lines.
Usually, I keep about 3 to 4 resistance lines above, and 3 to 4 support lines below. Now, you don’t need to draw the lines that are very far from the current price. Because obviously, the price will not reach there in the next days. Or when the price goes towards these levels, you can add another resistance level.
What you can do is to send me some pictures, how you draw them, and I can tell you if this is fine or not. But one more time, look for the levels where the price was support, was the resistance, and we have an impulsive break.
You can post some support and resistance levels to our Forum, so I can tell if they are fine or not.
If you want to learn more Price Action trading techniques, have a look at our Price Action trading course, Bitcoin and the Cryptos.
Cheers.



I really enjoyed that lecture. I always keep support and resistance on my charts. Even when I trade with Experts, I just want to know where the price is, where it might stop and reverse.