Petko Aleksandrov is a seasoned trader, is known for his expertise in developing trading strategies and robots. In this blog post, he shares a fantastic strategy for trading Oil and introduces an Oil Trading Robot that can be downloaded for free at the end of this blog post.
Understanding Robots
Many traders make the mistake of buying expert advisors or robots from the marketplace without understanding how they work. They rely solely on the backtests they see in pictures or videos, which can lead to significant losses in the long run. As a trader, it’s crucially important to know how robots work and what conditions they use to open and close trades.
Money Management
To avoid blowing up an account, the most important thing you need to keep in mind is to keep good money management or to trade a very small portion of your capital. Petko recommends trading a small portion of your capital and avoiding risking too much for the sake of greed.
Petko’s Trading Accounts
Petko shows his two trading accounts to demonstrate his strategy. The first is on MetaTrader, where he has five top stocks he’s trading. These five robots are shared in his Top Five Stocks course. In a $10,000 account, he has a few trades open, and his margin is $575, which means he has only used $500 out of the $10,000.
The second account is on MetaTrader 4, where Petko trades Bitcoin. Here, he’s trading 1 complete lot in 10k, which is risky. He has nearly doubled his account, but it could have gone the other way around, and he could have blown his account. Petko advises against risking too much and recommends trading a small portion of your capital instead.
Oil Trading Strategy (included in the Free Robot for Oil)
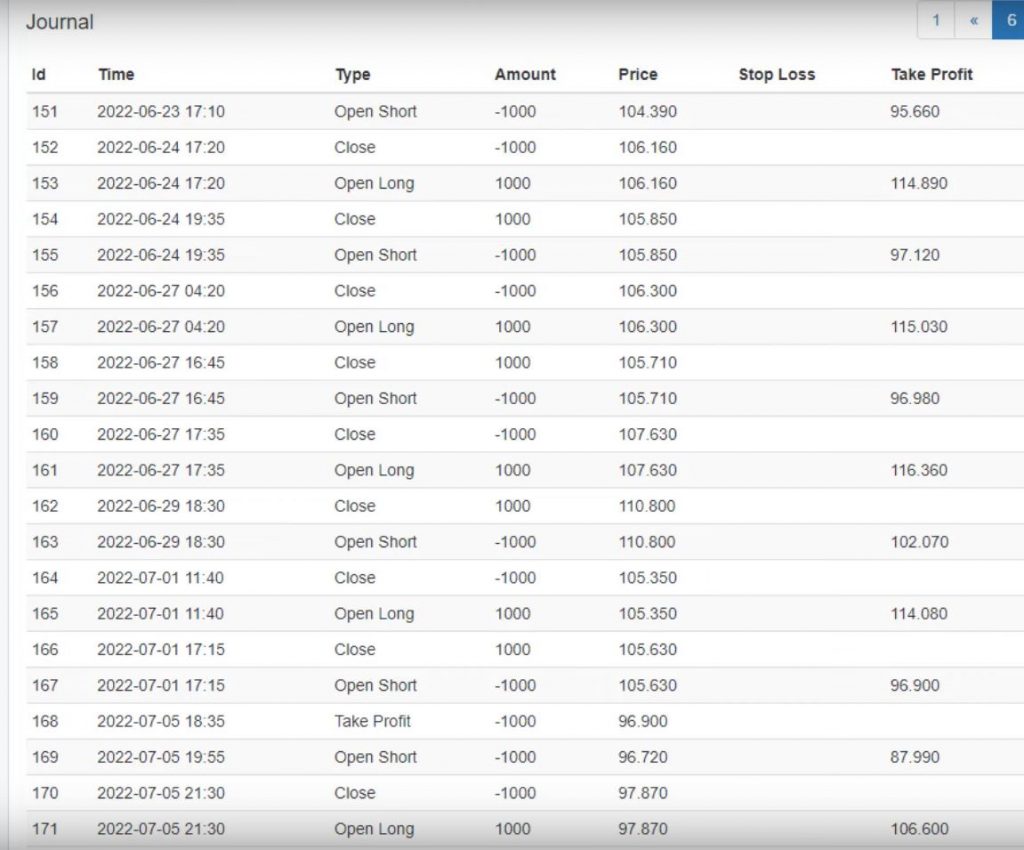
Petko’s Oil Trading Robot has performed well for the last year and a half. The backtest on EA Studio shows that it brings in over $100 on average per day when trading with 1 lot. If he increases the lot size to 10, he could potentially earn $1000 of profits per day, but it’s super risky. Petko advises deciding how much you want to risk and sticking to that amount.
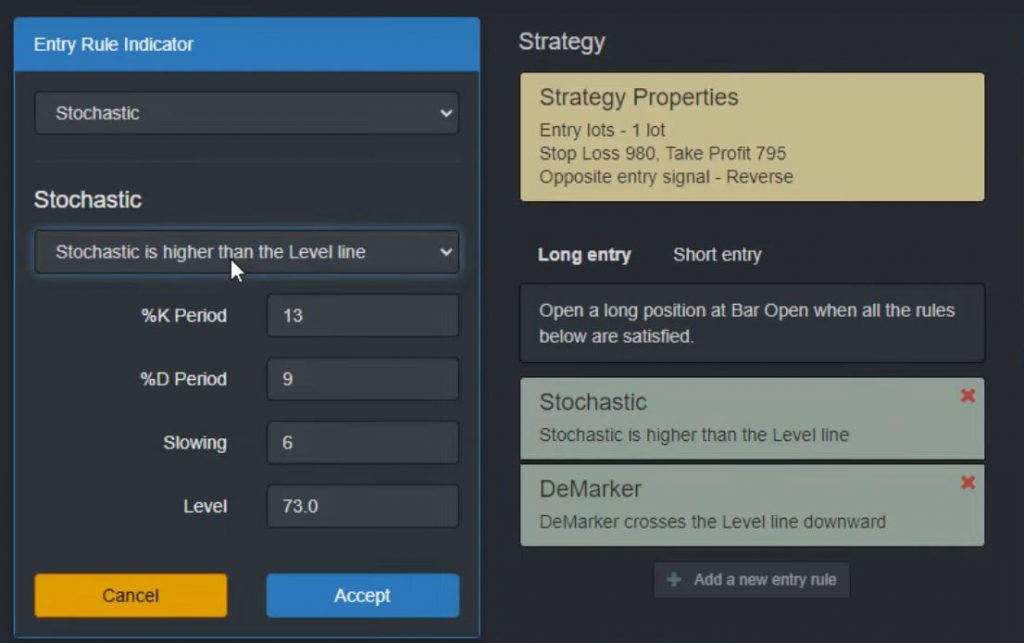
Using the Stochastic Indicator for Entry on the Oil Trading Robot
One of the key features of the Oil Trading Robot is its use of the Stochastic indicator for entry. To use this feature, you’ll need to set the K period to 13, the D period to 9, and the slowing to 6. You’ll also need to set the level to 73.
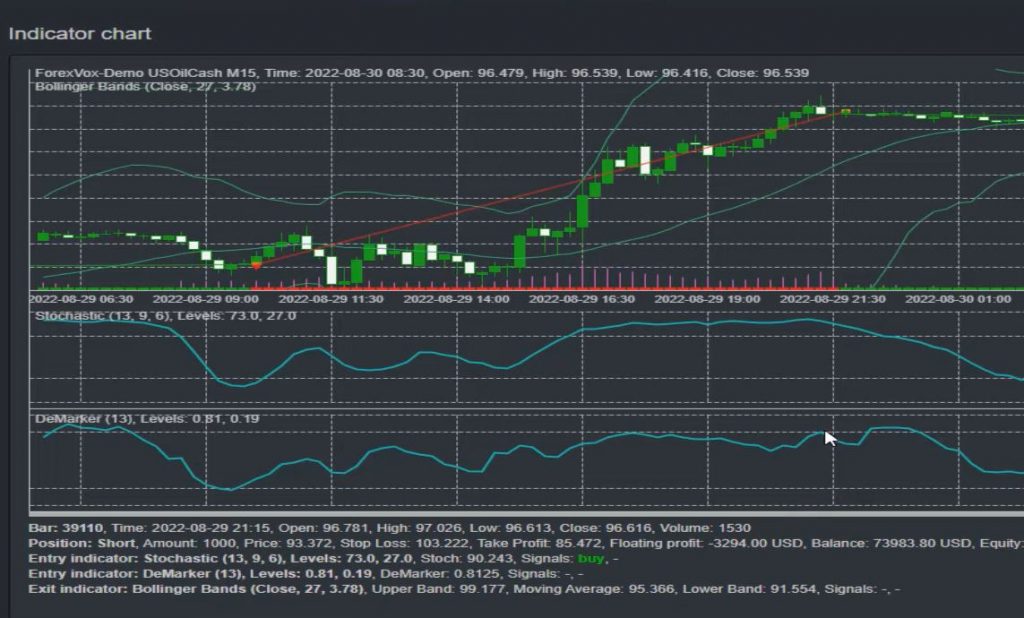
When you open the indicator chart, you should see the Stochastic indicator above the level line of 73. This is the signal that you can open long trades. When the Demarker crosses the level line downwards, you’ll have confirmation that it’s time to open a long trade.
Managing Risk with Reverse Trades
The Oil Trading Robot also has a reverse feature that helps you manage risk. If you open a short trade and it’s not going well, the reverse feature will automatically close the short trade and open a long trade. This can help you limit your losses and maximize your profits.
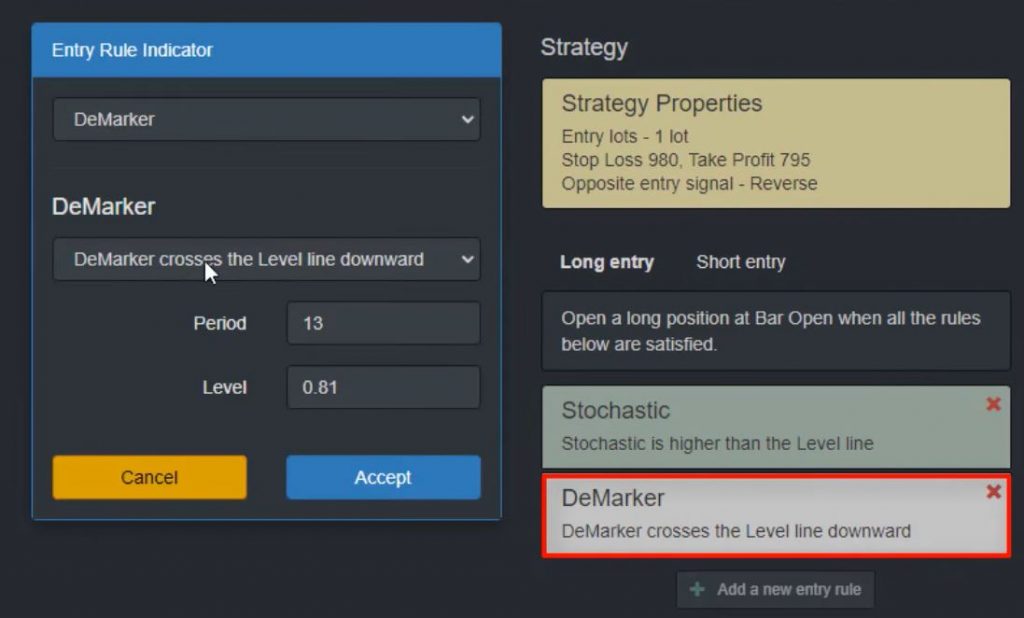
Using the Demarker Indicator for Entry Confirmation, included in the Oil Trading Robot
While the Stochastic indicator is the primary entry tool for the Oil Trading Robot, the Demarker indicator is used for confirmation. When the Demarker crosses the level line downwards, you’ll have confirmation that it’s time to open a long trade. The period should be set to 13, and the level should be set to 0.81.
Balancing Profit and Equity
When using the Oil Trading Robot, it’s important to balance your desire for profit with your need to maintain a healthy equity line. While it may be tempting to pursue bigger profits, it’s important to consider the long-term health of your trading account. By using a balanced approach to trading, you can maximize your profits while minimizing your risk.
Using Bollinger Bands within the Free Robot for Oil
To begin with, let’s take a look at how we can use Bollinger Bands for trading. The Bollinger Bands are a technical indicator that is used to measure market volatility. When the market is volatile, the bands widen, and when the market is quiet, the bands narrow.
To use Bollinger Bands for trading, we need to look for the bar opening above the upper band after opening below it. The period should be 27, and the deviation should be 3.78. To simplify this rule, we should see the Bollinger band going above the upper band if we are in a long trade.
Exit Conditions for Long and Short Trades
We should exit the long trade when the price goes above the upper band. On the other hand, we should exit the short trade when the price drops below the lower band of the Bollinger band. Usually, Bollinger Bands are crossing one or the other line whenever there is a volatility. So, this strategy aims to grab the profits right after the volatility.
Stop Loss and Take Profit Levels in the Oil Trading Robot
We need to set a Stop Loss of $9.80 and a Take Profit of $8. This way, we can minimize our losses and maximize our profits.
Exporting the Strategy as an Expert Advisor
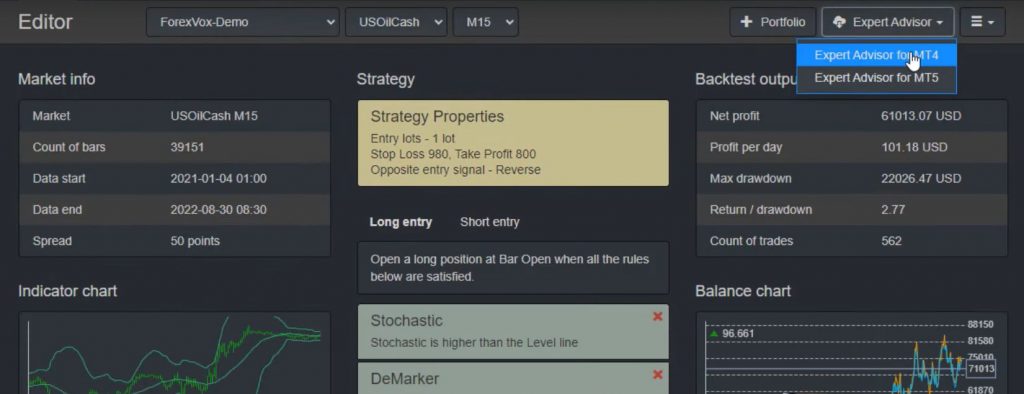
Now that we have our strategy in place, we need to export it as an Expert Advisor for MetaTrader 4. You can find the code for the Expert Advisor in the description. If you have programming skills, you can go through the code. Otherwise, it’s better to avoid it.
Once you put the Expert Advisor on MetaTrader and compile it, you will get the ex files, which are ready-to-use Robots.
Trading on a Demo Account
Before trading live, it’s essential to practice on a Demo account to learn and gain confidence in the results. You can use any of the Robots that are shared on YouTube for live trading, but it’s your personal decision and risk.
Remember, trading live involves risks, and you need to embrace them. Even experienced traders lose money sometimes. But that’s how we learn and improve our trading skills.
Conclusion
Using an Oil Trading Robot can save you time and effort while trading. By following the simple steps mentioned above, you can start using a free robot for oil (WTI) trading. But remember, practice on a Demo account before trading live and always use risk management strategies like stop loss and take profit levels.
If you want to learn more about trading strategies and get free Robots, make sure to subscribe and check out the links in the description. Happy trading!

Hello
I have attached the EA on XTIUSD chart M15 on Mt5 it did not do any thing. are there a set file to use with it.
Thanks
Shawky
my email is: go*************@***il.com
Hello, you need to put the EA on MT5 chart. Also be sure you put it on the BRENT.CMD/USD pair. Check the Journal and Experts tabs in MetaTrader 5 for any messages that might give you a clue if you’re setup is not correct. If you find such and still don’t understand what is the problem, please post the screenshots and your setup in the dedicated support forum for EA Studio robots here.