Home › Forums › EA Studio › Portfolio EAs › EA Studio vs My Portfolio Results So Far

- This topic has 8 replies, 1 voice, and was last updated 2 years, 2 months ago by
 Anonymous.
-
AuthorPosts
-
-
September 16, 2022 at 13:58 #123523
 AnonymousInactive
I have collected over 1000 EURUSD strategies using the following criteria:
REACTOR
DATA HISTORY: 2017 TO PRESENT
Premium Data adjusted to use with Oanda USA
Validator settings
Out of Sample 20% OOS
Acceptance Criteria
Complete backtest 1.2 pf
In Sample 1.1 pf
Out of Sample 1.1 pf
Normalization
Remove Take Profit unchecked
Remove needless indicators checked
Reduce Stop Loss checked
Reduce Take Profit checked
Normailize indicator paramenters checked
Out of Sample: 20% OOS
Numeric values steps: 20 steps
Search best: Net balance
Normalize Preset Indicators unchecked
Accemptance Criteria checked
Monte Carlo validation
Count of tests: 20
Validated tests: 80%Then I determined best 10 strategies for my portfolio using LECTURE 5.3 as guideline
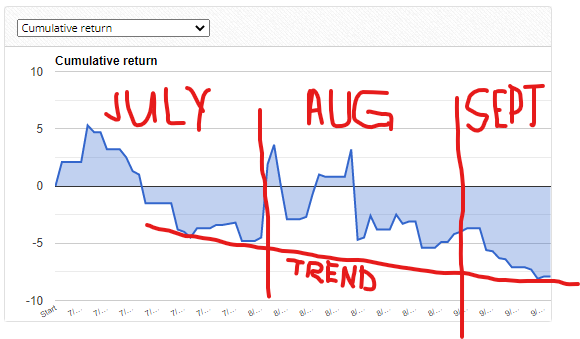
The following chart shows results for July thru mid-September. At the start of each month new best 10 strategies were selected:

As can be seen the trend is down and not up!
-
September 16, 2022 at 14:00 #123580AnonymousInactive
Hey Alan,
I’m not seeing a minimum count of trades in your acceptance criteria. Also selected best 10 according to what criteria?
Also, in my opinion focusing on a single asset like this is not the way to go at all. Could be really good for a period if it’s doing well but the reverse is also true.
-
September 16, 2022 at 21:34 #123603AnonymousInactive
Minimum count of trades: 300
Selection of 10 Best Strategies: I followed EA Studio Professional Course Lecture 5.3 which is as follows:
First I filter my collection of EURUSD Strategies as follows:
Validator
Historical data (Adjusted to last 6 months)
Data source Premium Data
Period M15
Loaded EURUSD; M15 – 12768 bars.
From 2022-03-01 00:00, to 2022-09-01 16:45.Validator settings
Out of Sample: 20%
Common Acceptance Criteria
Complete backtest
Minimum count of trades: 200
Minimum profit factor: 1.2
In Sample (training) part
Minimum profit factor: 1.1
Out of Sample (trading) part
Minimum profit factor: 1.1Optimize strategies:
Normalization
Remove Take Profit unchecked
Remove needless indicators checked
Reduce Stop Loss checked
Reduce Take Profit checked
Normailize indicator paramenters checked
Out of Sample: 20% OOS
Numeric values steps: 20 steps
Search best: Net balance
Normalize Preset Indicators unchecked
Acceptance Criteria checked
Monte Carlo validation
Count of tests: 20
Validated tests: 80%Perform robustness testing:
Monte Carlo validation
Count of tests: 20
Validated tests: 80%The results are then further filtered
Historical data (Adjusted for last one month)
Data source Premium Data
Period M15
Loaded EURUSD; M15 – 2280 bars.
From 2022-08-01 00:00, to 2022-09-01 17:45.Validator settings
Out of Sample: not used
Acceptance Criteria
Complete backtest 1.2 pf
In Sample 1.1 pf
Out of Sample 1.1 pfNone of the other filtering is used as Petko says its all been done before and don’t need to do it again.
The results are then filtered in the Collections tab as follows:
Profit factor adjusted until about 15 to 20 strategies are left
Count of trades is then adjusted to minimum of 10 trades (this is about one trade every other day).Finally the resulting strategies are eyeballed looking for best 10 strategies balance line with no downward trends showing over approximately last one week.
-
September 16, 2022 at 22:00 #123605AnonymousInactive
Hi Samuel,
The following comment from you confused me:
“Also, in my opinion focusing on a single asset like this is not the way to go at all. Could be really good for a period if it’s doing well but the reverse is also true.”
The reason it confuses me is because Petko has a whole trading course just using EURUSD. And, also somewhere in the courses I have taken from Petko I believe I learned it was best to use different EURUSD strategies to reduce risk. So if it is not advisable to just use EURUSD then why the course on just trading EURUSD. Further what other currencies would I then need to use to make a correct trading portfolio and how many difference currencies is the correct amount? So this is now all confusing to me.
-
September 16, 2022 at 22:16 #123617AnonymousInactive
Hey Alan, that all seems sensible enough, it sounds like you are running the normalizer one the validator? I would remove that personally as it’s already been run in the reactor. Monte Carlo a second time is fine
Also in the validator I would remove the OOS = 20% as it should be in sample.
Further to this I would suggest using an mt4 demo account to validate that your selection of EAs using EA studio matches your selection using FXBlue to make sure you have things set up properly.
-
September 17, 2022 at 23:03 #123689AnonymousInactive
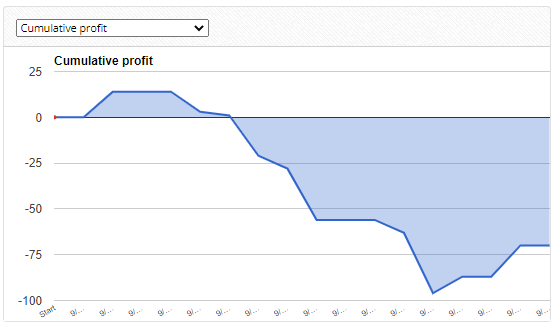
Hi Samuel, I did some investigating this morning and here is what I did. I the 10 strategies I chose at the beginning of September and put them into the EA Studio portfolio. I then recalculated for Sept 1 through Sept 16. These dates are outside the dates used to determine the strategies. Now I can see how my portfolio of 10 different EURUSD strategies should have behaved going forward in time. The following chart shows the results from EA Studio:

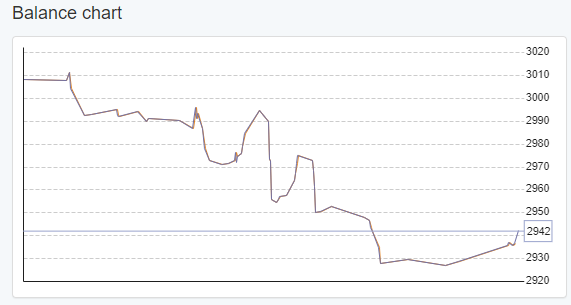
I then compared the resulting chart from EA Studio to the chart of my actual trading portfolio. The following chart is from FXblue:

As can be seen the results are similar. FXblue, however, shows about 10 dollars more in loss over the first half of September but does not include the plus 10 dollar float. So, overall loss is about the same.
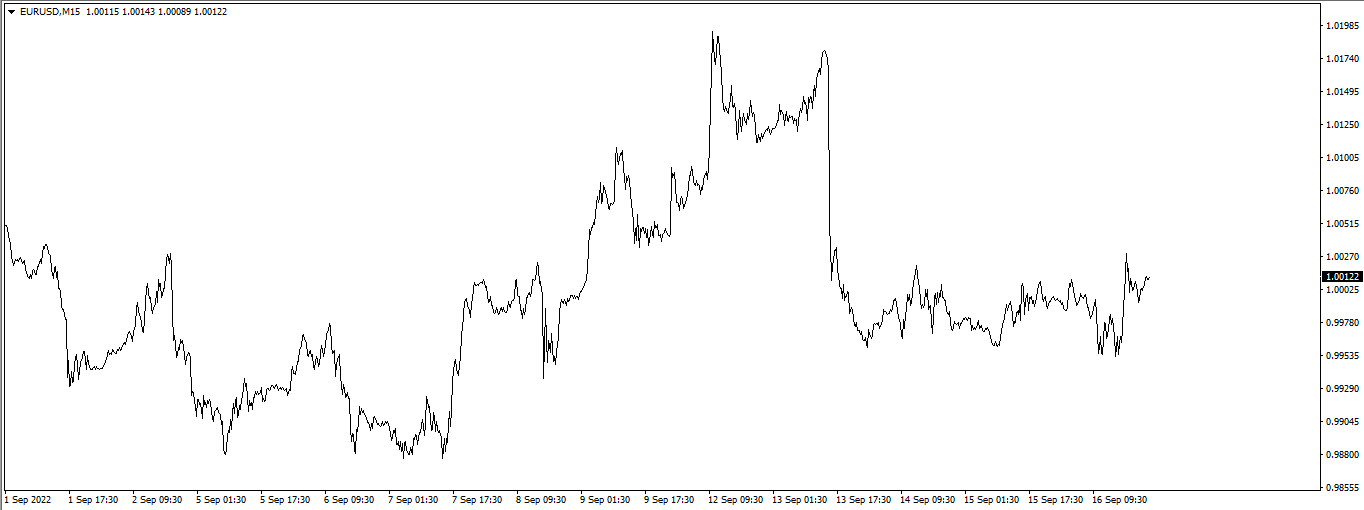
Now here is the interesting thing. The following chart shows a screeshot of MT4 EURUSD window:

What I find interesting this that the big drawdown in my portfolio seems to be happening at about the same time EURUSD is actually moving higher. It’s like when the market is going up my portfolio is taking Short trades. I don’t think this would be possible but it is quite interesting to see this negative correlation but I cannot say I understand why this would be happening.
I will continue until the end of the month to see what the overall results look like for the month.
-
-
September 16, 2022 at 22:23 #123619AnonymousInactive
Regarding the different Assets suggestion this is just my opinion.
Trading a portfolio of a single asset can work provided correlation between strategies is low, although I would be mixing timeframes personally.
Also certain reactor settings will work better for different assets so I expect that’s why Petko has courses focusing on a single Asset.
Additionally you could combine portfolios from different assets. I personally just trade single EAs but would definitely be happy with converting Ea Ea to a portfolio Ea that combines several strategies for a single asset, time is the only reason I don’t do it at the moment/I don’t feel it’s necessary even if it would be good.
-
September 16, 2022 at 22:27 #123620AnonymousInactive
Doesn’t need to be complicated regarding combining assets Alan, 3 or 4 different assets is plenty.
Try EURUSD, EURJPY and USDJPY for example or EURUSD, EURGBP and GBPUSD
-
September 17, 2022 at 23:08 #123728AnonymousInactive
Hi Alan,
Take a look at the long/ short balance curves for your strategies in EA studio.
You may find that they are strategies that have performed best taking short trades but not so well for long trades?
Also you could run a backtest in MT4 with visual mode turned on to see clearly where on that chart you are making your trades for each EA in order to get a better understanding of how things have been trading.
Good job on comparing your EA studio results with FXBlue.
-
-
AuthorPosts
- You must be logged in to reply to this topic.