CCI Indicator strategy
Hello traders, today I will show you CCI indicator strategy that I created recently for my Automated Forex Trading course + 99 Expert Advisors. And I really like that CCI indicator strategy because of the great statistic it showed me.
If I go to Report, you will see what are the statistics that we have, the balance chart is really great.
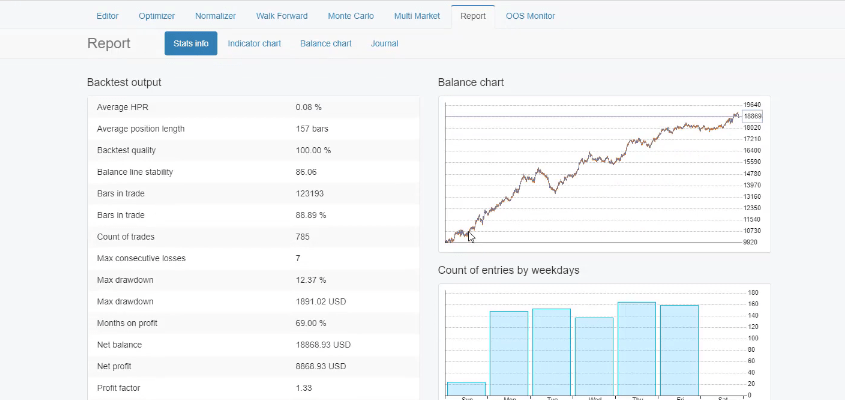
There is a drawdown which is at 12.37% but that is an acceptable drawdown for me because the rest of the backtest is really nice.
And as well, this CCI indicator strategy is balanced. Through the week from Monday till Friday it has a very stable number of entries and as well the profits and the losses in currency by weekdays are quite stable.
And below are the profit and loss in currency by entry hour,
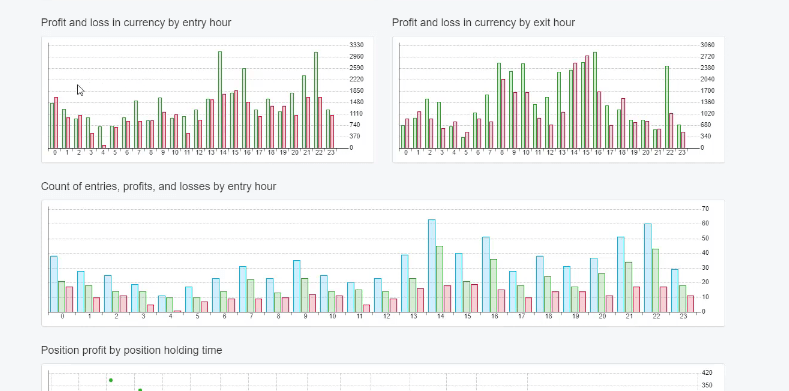
which show us that the strategy is most active during the European session, the American session, and at the beginning of the Asian session.
And this is a strategy for the EURJPY so it combines the EUR which is most important active during the European stock exchange session and the JPY which is most active during the Asian stock exchange.
And below are the positions profit by position holding time,

which shows us that most of the profits are at about $70 and the monthly performance shows us which months are profitable and which are losing for this CCI indicator strategy. And it is very normal for every strategy to have losing months.
The Commodity Channel Index (CCI)
Now, going back to strategy, let’s have a look at the entry indicator which is the Commodity Channel Index. This is why I say it is a CCI indicator strategy because the entry on the market happens when the CCI crosses the level line downward.
And we have period of 25 and level of -23. What I like to do with the parameters of the strategies is to make it a round number so I will change it to -25 and when I click on Accept,
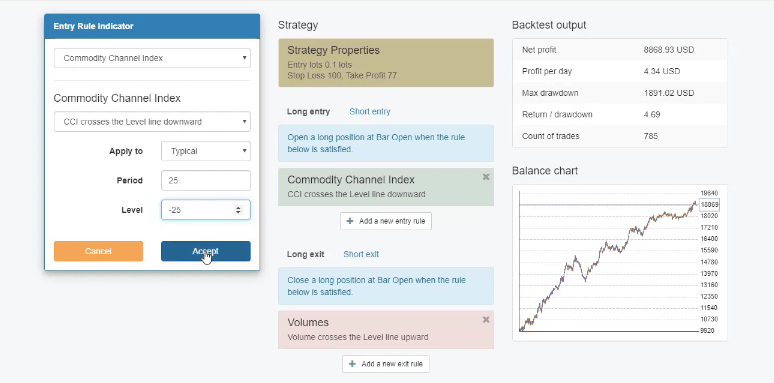
you will see that there is not a huge difference in the balance chart which allows me to leave the round number.
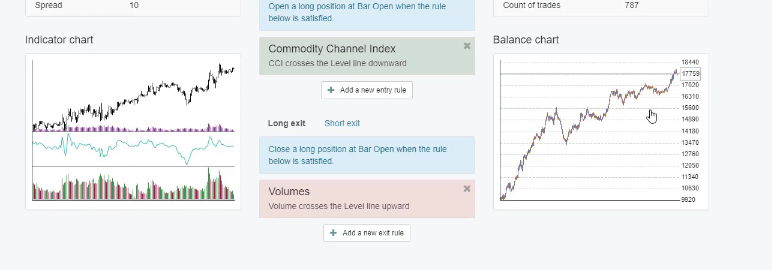
And having round numbers in the indicators makes the Expert Advisor faster, the calculations are faster and if you like to trade the CCI indicator strategy manually, it will be easier for you to remember that the period of the CCI indicator is 25 and the level is -25.
As an exit condition for this strategy, we have the volumes and the condition here is volume crosses the level line upward. As a level, we have 27,655, I will make it round to 28,000 and I check for any change.
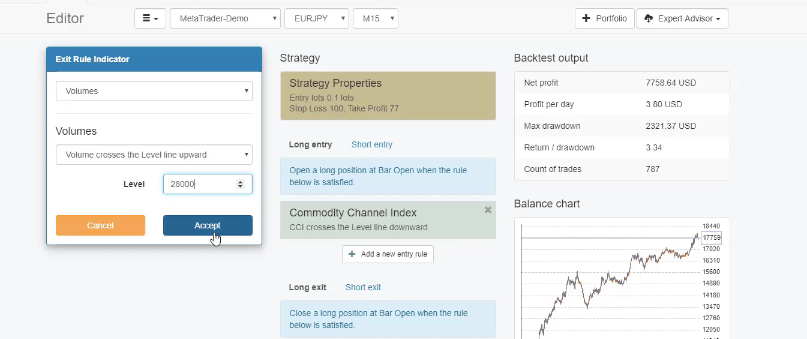
No change in the backtest which allows me to leave it this way. As a Stop Loss and Take Profit, I have a Stop Loss of 100 pips and Take Profit of 77 pips for this CCI Indicator strategy.
And again I will make it a round number, Take profit of 80, I will click on Accept.
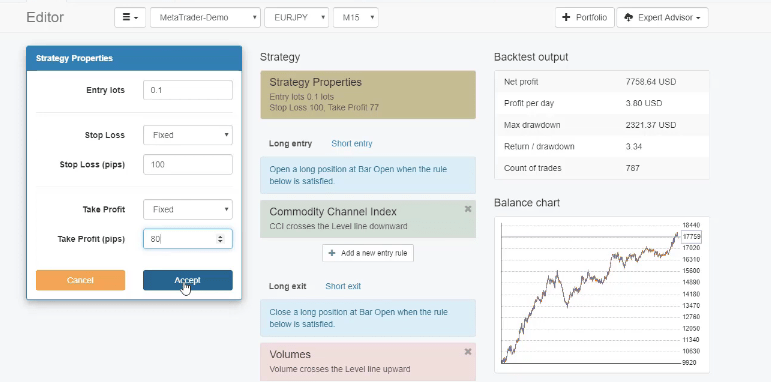
The balance chart didn’t change a lot but we have a lower balance at the end. So I will decrease it to 75 which is again a round number for me in trading.
Yes, this is much better, 70,917. So this strategy has a really good return to a drawdown ratio of 3.38. And the simulation here is if we are trading with 0.1 lot size starting at a $10,000 of account, with this CCI indicator strategy we had 17,917 as a result and this is for the period from October 2014 until the moment.
Advantage of more count of trades
What I liked the most with this CCI indicator strategy is that we had over 800 count of trades. For beginner traders, the more count of trades we have, the more robust strategies we are using.
Because when we are backtesting a strategy, if we have just 20 or 30 trades for such a period like 5 or 6 years, it means first that the strategy is not active because if it opened just 5, 6 trades for 6 years. Basically it will be trading once a year.
The Profit factor of the CCI Indicator Strategy
But when it opens 800 trades, this means that’s really an active strategy. And if I show you the report, one more time, you will see that we have Profit factor of 1.28 and the Profit factor is the profit divided by the losses.
And by changing the parameters, the maximum drawdown increased to 15% which is below my maximum of 20% so I avoid trading strategies that have more than 20% drawdown in their backtest. So this is a really simple CCI indicator strategy.
As I said, the entry is when the CCI crosses the level line downward. And if I click on the indicator chart, the CCI line is Illustrated in blue. And let me show you an example of an entry.
The CCI crosses the level line downwards at this moment.
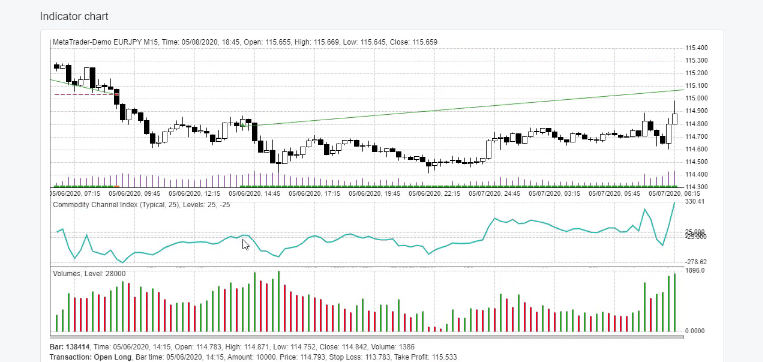
And this is why we have a buy signal which goes on a profit and hits the Take Profit a little bit later. Below is another example that went on a negative. The CCI crossed the level line downwards,
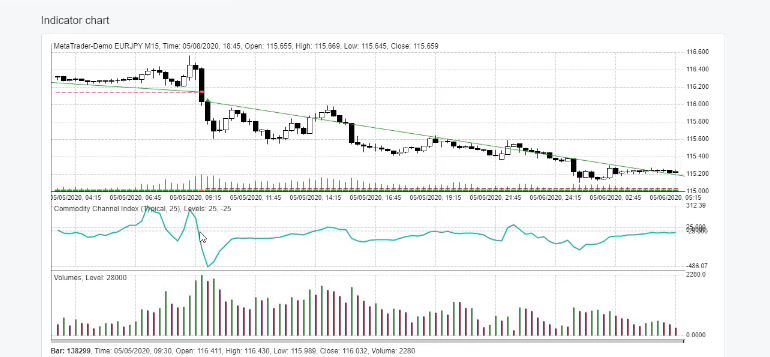
we had a buy position or a long position and it hit the Stop Loss.
So there are losing trades, profitable trades with every strategy, but the most important thing, of course, is to have more profitable trades than losing trades.
Let’s have a look at this short trade.
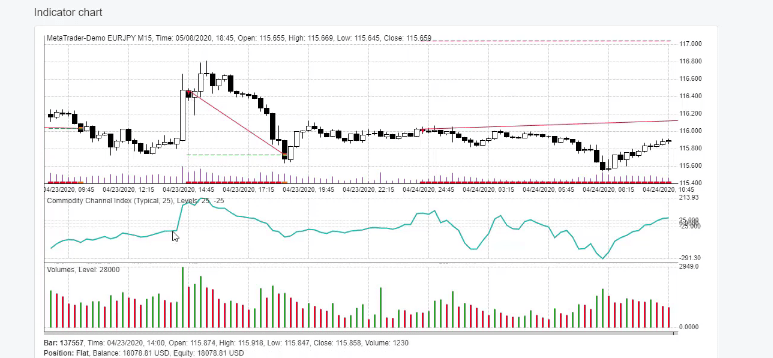
The CCI crossed the level line upwards, we had a short trade right after the cross and it hit the Take Profit.
The magic number of the CCI Indicator strategy
Now, I will export this strategy from EA Studio as an Expert Advisor for Meta Trader 4,
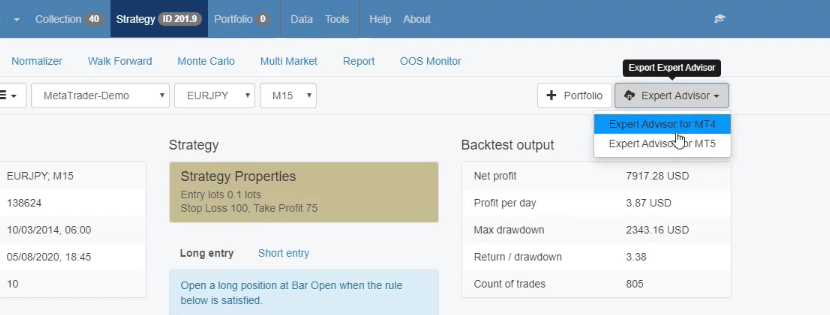
I will copy it, and I will open Meta Trader. I will go to File, Open Data Folder,
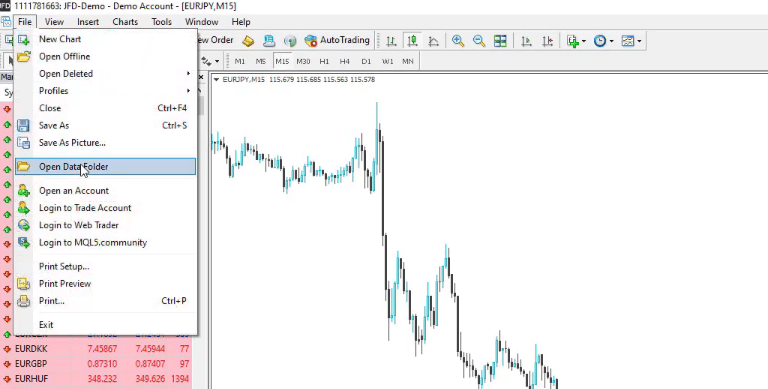
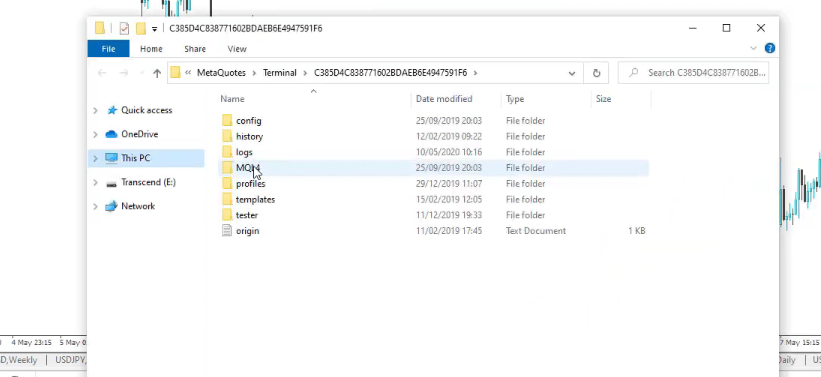
MQL4,
Experts,
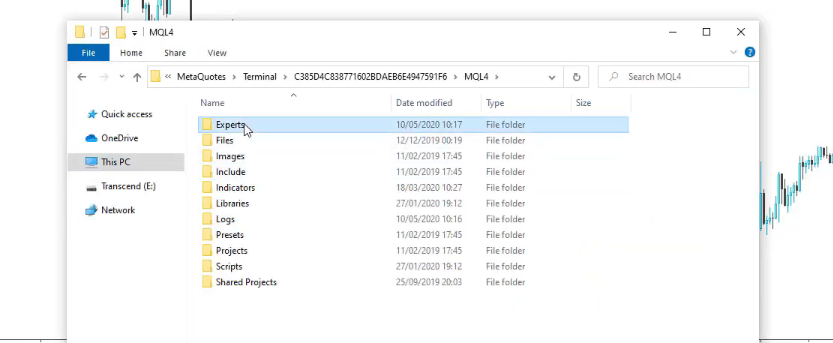
and I will paste here the Expert Advisor.
So this is the unique thing with EA Studio that with one click, we can export any strategy as an Expert Advisor and trade it automatically in Meta Trader. After that, I will click right mouse on Expert Advisors, Refresh,

and it will display the Expert Advisor below.
Then I will drag it over the chart and here are all the inputs that we have from the strategy,
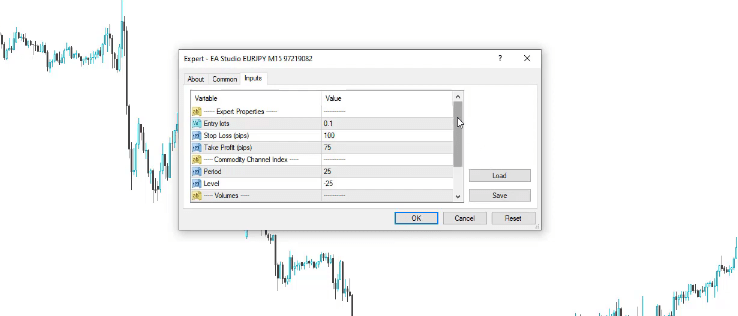
the Stop Loss, Take Profit, the period, the level of the CCI indicator, the volumes, and the magic number which is a unique number for the strategy that we use when trading many Expert Advisors to recognize which ones are profitable and which ones are losing.
Click on OK and the Expert Advisor is attached. I didn’t allow the old trading because it is Sunday, the market is not open. Simply, I just want to show you the backtest. I will click on Expert Advisors, right mouse over the chart and go to strategy tester.
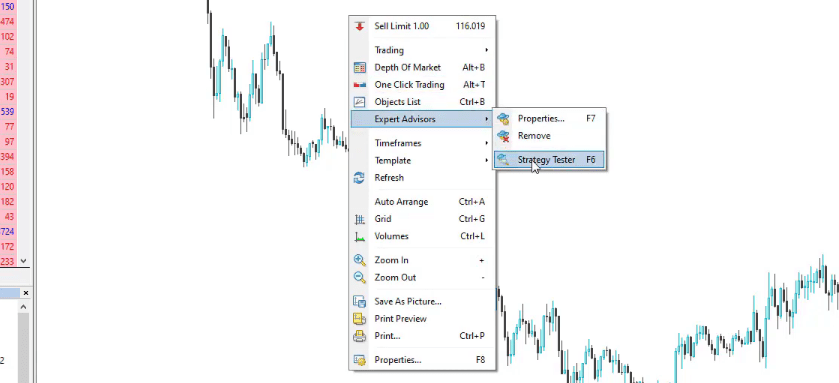
And usually, it will fulfill all the settings automatically so it sets the Expert Advisor, the symbol.

As a model, it’s very important to use Open prices only because the Expert Advisors that are created with EA Studio work on the bar opening.
The graph for the backtest of this CCI Indicator strategy
So when a new bar comes it will check if the entry condition is met in the previous bar. In our case, this was the CCI indicator.
In our CCI indicator strategy, this was when the CCI crosses the level line upwards or downwards and on the opening of the next bar if this event is true, it will open the trade.
And then I will click on Start and I will see what are the results, all trades that opened and closed.
And then we have the graph which you can notice is the very same as what we had with EA studio just that it is in a wider window.

And in EA Studio the strategy did above 17,900 but in Meta Trader it did about 17,200.
But this is because the historical data is a little bit different in Meta Trader, I don’t have that much data as I have in EA Studio.
And as well, if you compare the results in the Meta Trader backtest and the backtest in EA studio, if I go to Journal, there are the very same trades that happened or the very same events which this CCI indicator strategy executed.
Select a reliable broker to test any strategy
So if you want to practice this whole process I would suggest you to build this strategy for your broker. So no matter which broker you are using and actually if you have difficulties with the brokers, recently we launched the brokers page where we placed a lot of tips of how to choose a regulated and reliable broker.
As well we have listed some brokers which we have tested with many of our students and traders. What you can do is just export the historical data from your broker in data for EA Studio.
You have the two scripts.
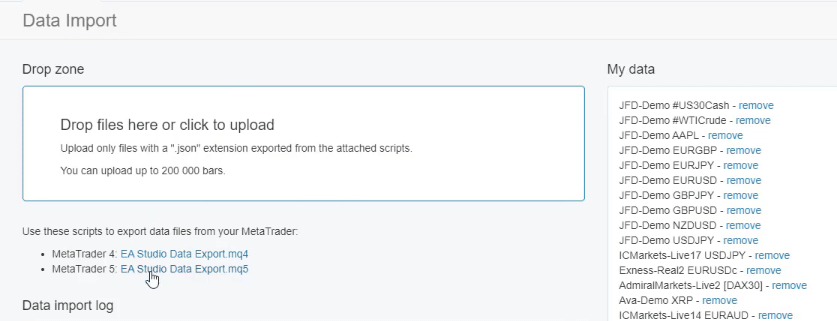
Just download them, paste them to the Scripts folder just as I showed for the Expert Advisors. Go to File, Open Data Folder, and then you go to MQL4, Scripts, and paste it there.
Close the folder, refresh scripts and the script will appear right here. After that drop it over the chart and for maximum count of bars I would suggest you to do 200 000 and then enter the spread and the commission that you have for the broker and click on OK and this will export all the data that you have for this currency pair.
And if you don’t have a lot of data just press the HOME key on your keyboard so it will load more data and so all the data can be exported. Then what you need to do is go to File, Open Data Folder, and you go to MQL4, Files, and you will see the data.
Different brokers offer different historical data
What you need to do is simply drop these files in the data import tab and you will see the data on the right side. Let me demonstrate it to you, I will drop the files,
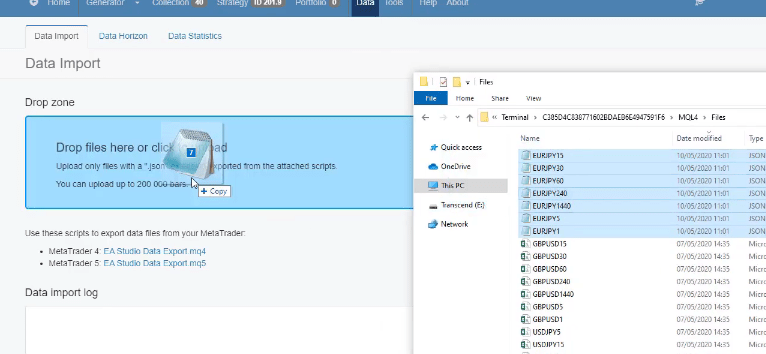
they will be imported and uploaded and then when you go to Strategy you will see your broker listed here.
And in this case I have many different data from different brokers because I always compare which one provides better trading conditions. And then what you can do is build the strategy from scratch.
So what this CCI indicator strategy has is the CCI indicator or the Commodity Channel Index, applied to typical method, CCI crosses the level line downwards is the entry condition, period 25, level -25. And then we have the volumes, volume crosses the level line upwards, level of 28,000 for this strategy.
And we have the strategy properties, Stop Loss of 100 pips, Take Profit of 75 pips. Build the strategy for your broker and see what is the performance. You can play around with the parameters to round it or change it a little bit to see a better balance chart for your broker.
And keep in mind that the brokers offer quite different historical data. This is why sometimes in my courses I show great backtests and results with my strategies and students often say that the strategy didn’t show the same result with them and the only reason for that is the spread.
The Generator that created the CCI Indicator strategy
If I go to Meta Trader and I do a backtest for this strategy one more time and I increase the spread to 15, for example, and I click on Start, it fell below 16,000.
And if I increase it to 30 or this is 3 pips which many brokers offer for EURJPY and I click on Start, the graph goes below 15,000. So the spread really matters in algorithmic trading and if your broker has a huge spread you better change your broker.
So, one more time, you can build this strategy in EA Studio and you can export the Expert Advisor to see how the backtest will be on Meta Trader. But I am pretty sure it will be the same because I have checked it hundreds of times.
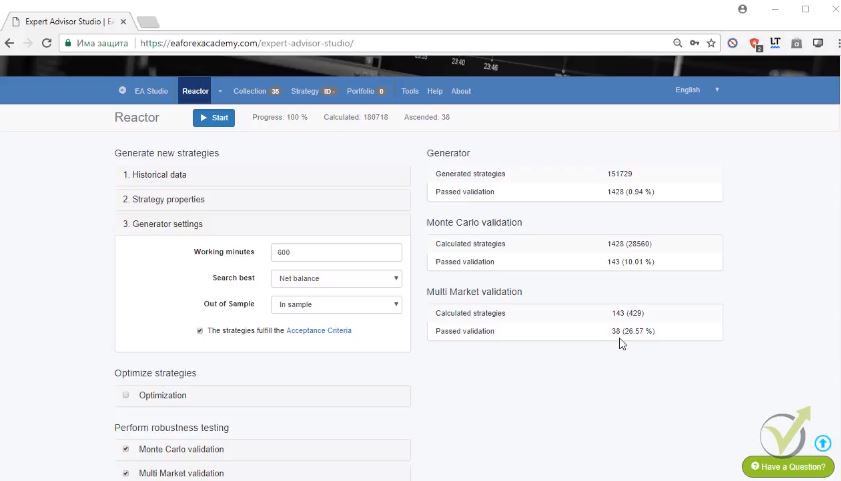
And if you haven’t used EA Studio yet, what you can do is to register for a free trial that is available, for 15 days you can export and build as many strategies as you wish. As well there is the Generator which allows you to generate new strategies.
And we have the EA Studio free start-up course which I have recorded,
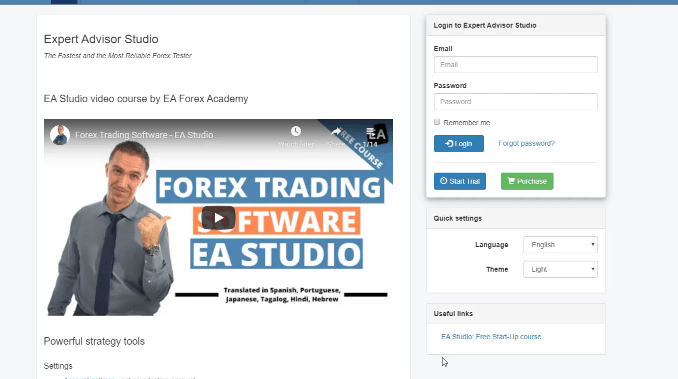
it’s a free course. It will teach you how to use the software and you will be able to generate, create, and automate many trading strategies such as this CCI indicator strategy.
If you have any questions, let me know in our Forum.
Thank you for reading.
Safe trading.

