Understanding Metatrader 5 Backtesting
Metatrader 5 is not just a trading platform; it’s a gateway to testing and refining your trading strategies. This section will introduce you to the basics of Metatrader 5 Backtesting. We’ll explore how to set it up, choose your trading instruments, and select the right strategies and timeframes. It’s a process that allows you to simulate your strategy against historical market data, offering invaluable insights.
Metatrader 5 Backtesting: Leveraging Historical Data for Effective Strategy Analysis
Backtesting trading strategies in Metatrader 5 heavily relies on historical data. This data is crucial as it encompasses detailed bar information, including open, high, low, and close prices. Such comprehensive data allows traders to meticulously analyze how a strategy would have performed in the past, spanning months or even years. Historical data in Metatrader 5 provides an indispensable foundation for backtesting. It acts as a lens through which traders can view and understand market behaviors during different periods.
This historical perspective is vital for traders to evaluate the profitability and feasibility of their strategies based on how they would have fared in past market conditions. However, it’s essential to bear in mind that past profitability does not necessarily predict future outcomes. Therefore, continuous evaluation and adaptation of strategies are crucial for sustained success in trading. Metatrader 5’s advanced backtesting tools, combined with extensive historical data, empower traders to refine their strategies with a higher degree of precision and confidence.
In Metatrader 5, accessing extensive historical data is key for a thorough backtest. To achieve this, simply press the HOME key on your keyboard. This action prompts Metatrader 5 to load additional bars, effectively extending the range of your backtesting data. The more data you have, the longer and more comprehensive your backtest can
EA Studio, which will be discussed later in this post, includes vast amounts of historical data from several reliable brokers, and is customisable to your broker’s fees, spreads, commissions and swaps. Getting adequate historical data from your broker has always been one of the biggest challenges when backtesting or creating strategies. This is why we created our FREE Historical Data App.
Enhancing Metatrader 5 Backtesting with Comprehensive Historical Data App
Complete and Reliable Forex Historical Data
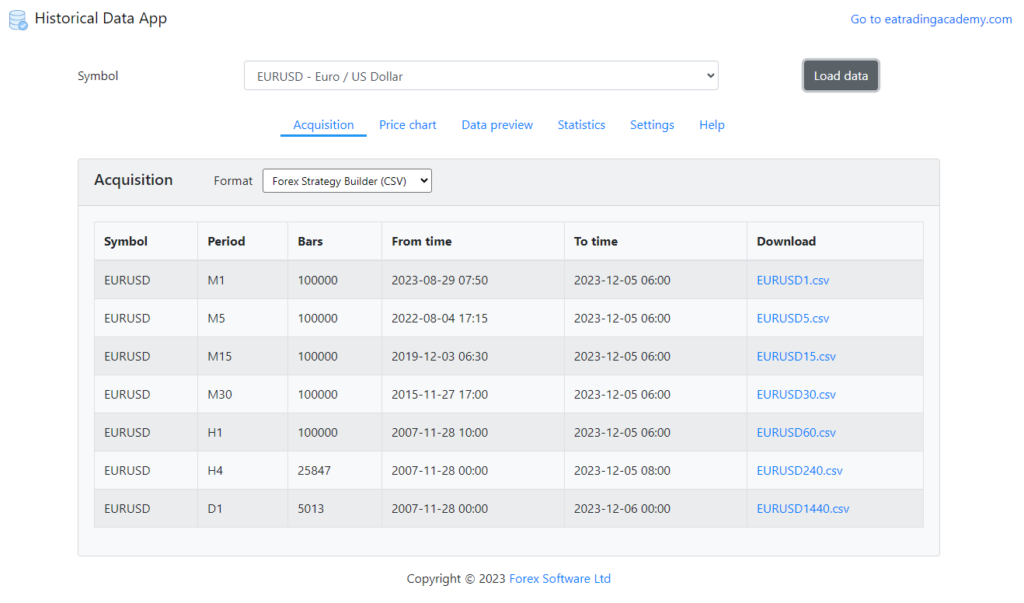
For traders using Metatrader 5, the availability of quality Forex historical data is crucial for accurate backtesting. This proprietary Historical Data App offers data sourced from DukasCopy Europe, renowned for its precision. The data is collected from accurate tick data and then compiled into bar data, ensuring no gaps or missing bars. This completeness is vital for traders who rely on thorough backtesting in Metatrader 5.
Versatile Data Formats for Diverse Needs
The Forex Historical Data in this app is tailored to suit various platforms, including Metatrader 5, EA Studio, and FSB Pro. This versatility means that traders can choose the format that best fits their specific backtesting needs. Additionally, there’s an option to export this DukasCopy Europe Historical data into Excel, offering flexibility and convenience for data analysis.
Rapid Download Capability
Recognized as the fastest data app on the market, the Forex Historical Data App ensures efficiency in backtesting preparation. It allows for the swift download of historical data, with the capability to download up to 200,000 bars for each asset in mere seconds. This speed is a significant advantage for Metatrader 5 users who require quick access to extensive historical data.
Regularly Updated Data for Up-to-Date Analysis
One of the unique features of this app is its regular updates. The historical data is refreshed every 24 hours, ensuring that traders have access to the most recent information. This feature is particularly beneficial as it eliminates the need to rely on MetaTrader or other trading platforms for the latest data updates. Traders using Metatrader 5 can confidently backtest their strategies with the assurance that they are using the most current and comprehensive data available.
Setting Up Your Backtest
Setting up a backtest in Metatrader 5 is simpler than you might think. We’ll walk through the steps of selecting your trading instrument, the specific strategy you want to test, and the appropriate timeframe. This setup is crucial as it lays the foundation for accurate backtesting results. For the purposes of this blog post, we’ll focus on Stocks, specifically, Tesla.
Setting Up the Expert Advisor
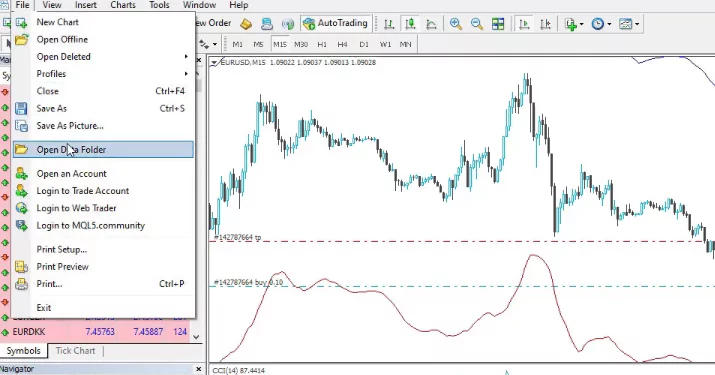
Now we will walk you through placing an Expert Advisor on MetaTrader for backtesting. The first step in this process is to navigate to the ‘File’ menu and select ‘Open Data Folder’.
Navigating to the Right Folder
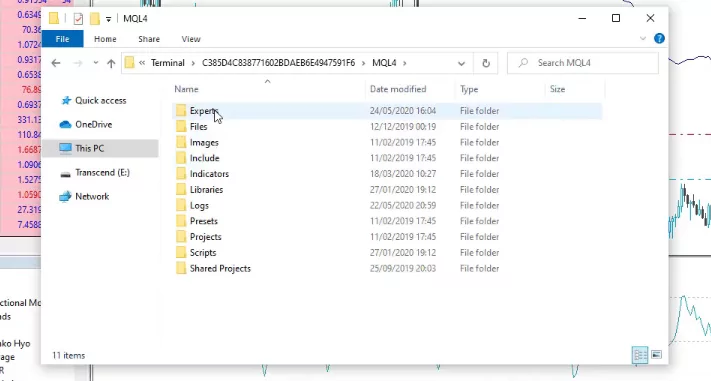
Once you’re in the ‘Open Data Folder’, proceed to the ‘MQL4’ folder and then to the ‘Experts’ folder. This is where you’ll paste your Expert Advisor. After doing so, close the folder to move on to the next step.
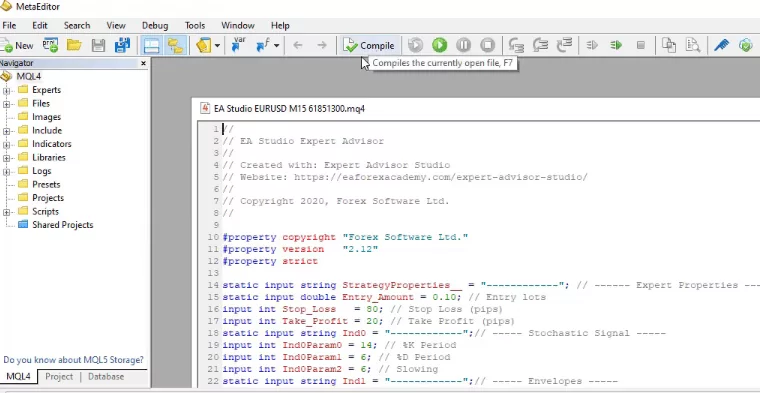
Compiling the Expert Advisor
The next crucial step involves going to the ‘Navigator’ tab. Here, right-click on the Expert Advisor and select ‘Modify’. This opens the MetaEditor, where you can compile the Expert Advisor and check for any errors or warnings that might affect your trading strategy backtest.
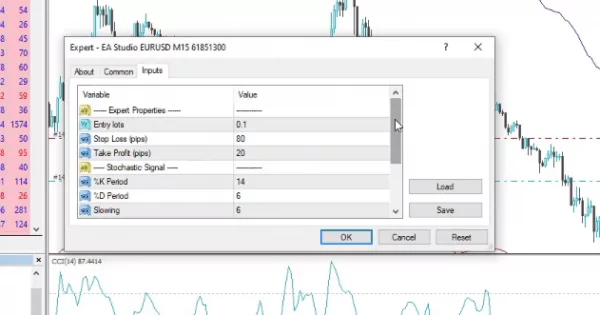
Setting Up the Expert Advisor on the Chart
After compiling the Expert Advisor, drag it over to the chart and drop it. A small menu will pop up, displaying the inputs of the Expert Advisor, the parameters of the indicators, and the strategy properties. At the bottom of this menu, you’ll find the ‘magic number’. This number is essential as it helps you track the performance of multiple Expert Advisors on a single account.
Enabling Algo Trading and Testing on a Demo Account
Remember to enable Algo Trading if you intend to trade with the Expert Advisor. However, if you’re conducting a trading strategy backtest, Algo Trading can be turned off. It’s also recommended to test any Expert Advisor on a Demo account before using it on a real account. This step is crucial for adjusting trading quantities, Stop Loss, and Take Profit settings without risking real money.
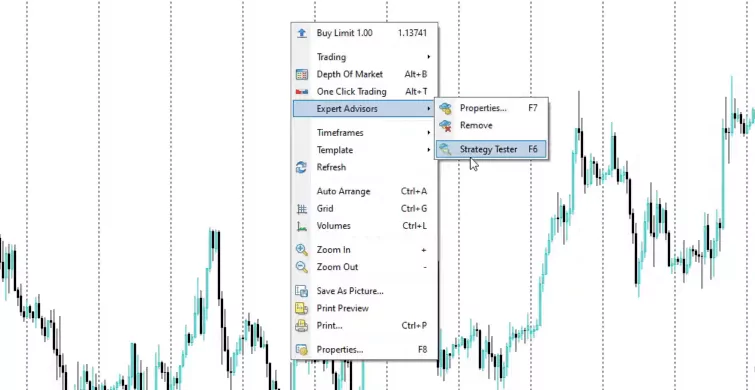
So right-click and go to Expert Advisors and then click on Strategy Tester.
Fine-Tuning Your Metatrader 5 Backtesting: Selecting the Right Period and Model
Choosing the Right Timeframe for Backtesting
In Metatrader 5 Backtesting, setting the right symbol is just the beginning. You have the flexibility to use the entire historical data available or opt for a custom period. This choice is crucial as it determines the scope of your backtest. To begin the backtest, right click on your chart, select Expert Advisors and then Strategy Tester. Next, select a custom period, simply access the ‘Date’ dropdown menu. Here, you’ll find two boxes that become editable, allowing you to specify the exact timeframe you wish to analyse. This feature is particularly useful if you’re looking to focus on a specific period in history for your backtest.
Understanding Modeling Options in Metatrader 5
The ‘Modelling’ section in Metatrader 5 is where you choose how your strategy will be tested. If your strategy is based on the opening prices of bars, like the Tesla stock trading strategy mentioned here, then ‘Open prices only’ is the ideal choice. This option ensures that the strategy checks for entry and exit conditions precisely at the opening of each new bar. It’s a straightforward and efficient method, especially suited for strategies that rely on the opening market conditions.
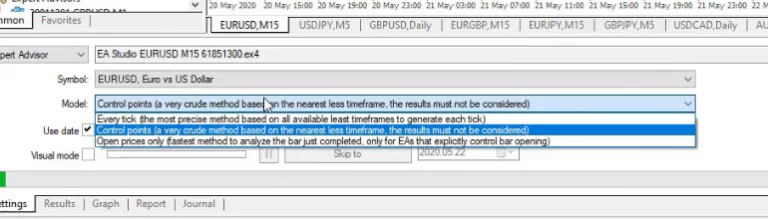
Tailoring the Model to Different Strategies
However, Metatrader 5 Backtesting is versatile enough to accommodate various types of strategies. If you’re working with a strategy that involves stick patterns or complex mathematical calculations, you might need to select a different modelling option. Each option caters to different strategy requirements, ensuring that you can backtest a wide range of strategies effectively. For the purpose of this guide, though, the focus remains on ‘Open prices only’, which is a widely applicable and efficient method for many trading strategies.
Optimizing Strategies in Metatrader 5 Backtesting
Setting the Initial Balance and Leverage
In Metatrader 5 Backtesting, the ‘Optimizing the strategy’ section follows ‘Modelling’. Here, you first encounter the option to set your initial balance. This balance can be any amount, ranging from 10,000 to 100,000 or more, depending on your preference. Next, you have the flexibility to adjust the leverage. Leverage is a critical aspect as it can amplify both gains and losses in trading.
To Optimize or Not to Optimize
The crucial decision in this section is whether to use optimization. Optimization in Metatrader 5 Backtesting involves the software automatically finding the most suitable parameters for your strategy. However, a word of caution is necessary here. Over-optimization is a real risk. It means making your strategy too perfect, based on past data, which might not always translate well into future market conditions. Therefore, unless you are experienced in handling such tools, it might be safer to avoid optimization in your backtesting process.
Visual Mode in Metatrader 5 Backtesting
Engaging the Visual Mode
After setting up your strategy, Metatrader 5 Backtesting offers a ‘Visual mode’. This mode allows you to see the backtesting process in action. By checking this option and clicking the ‘Start’ button, a new tab opens up, displaying the results of your strategy’s performance. One of the advantages of this mode is the ability to adjust the speed of the simulation, giving you control over how quickly you view the backtesting results.
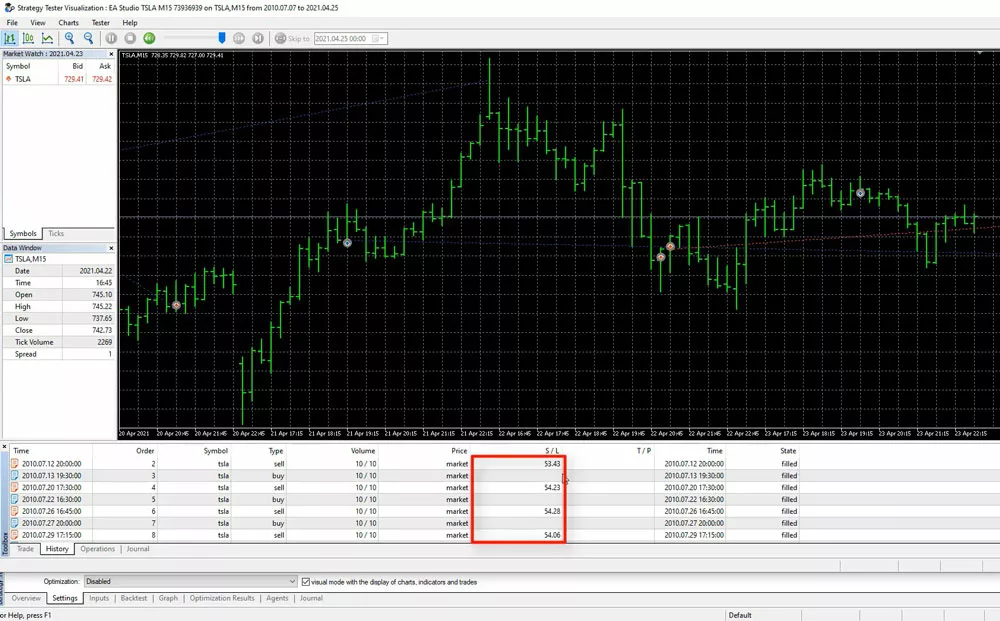
Analyzing Trade History and Operations
In the ‘History’ tab, you can clearly see important details like where the Stop Loss was set for each position. This tab provides a historical view, showing data availability from the selected broker, sometimes going back as far as 2010. To access more historical data, you can use the ‘Home’ key on your chart in Metatrader 5. This action loads as much data as available, which is especially useful before starting your backtesting.
Understanding the Strategy Tester Visualization
Operations Tab for Detailed Trade Analysis
Adjacent to the ‘History’ tab is the ‘Operations’ tab. This section is where you can see where each trade was opened and at what price. For instance, if you are analyzing a strategy involving Tesla stocks, you can observe how the stock price has evolved since 2010. These tabs display all trades executed with the chosen Expert Advisor.
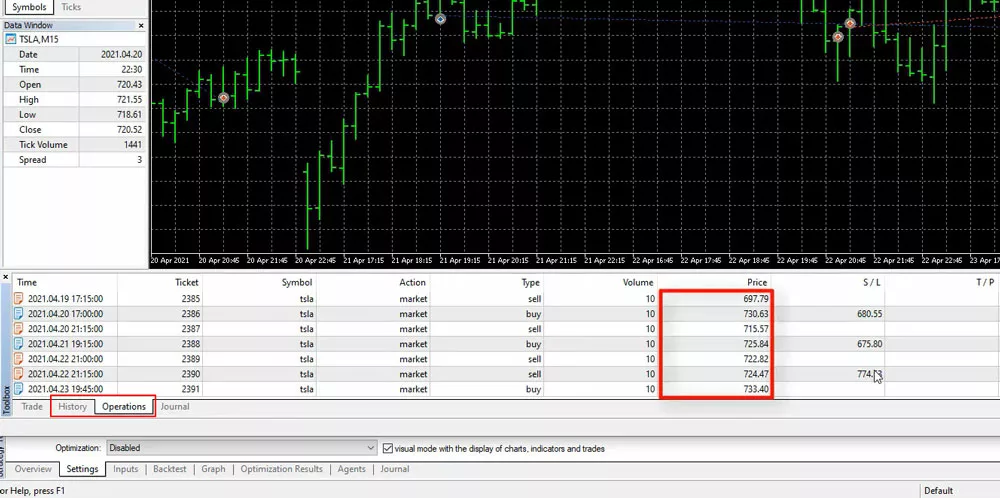
Navigating Between History and Operations Tabs
A notable aspect of Metatrader 5, which differs from Metatrader 4, is the separation of the ‘History’ and ‘Operations’ tabs. In Metatrader 5, these tabs are distinct, with one showing the Stop Loss and the other displaying the open price and Stop Loss. This separation can be slightly confusing for new users. If you need to compare specific trades, you might find yourself switching between these two tabs, which can be less convenient compared to the more integrated approach in Metatrader 4.
Analyzing Backtesting Results in MetaTrader 5
Understanding the Strategy Tester Visualization
In MetaTrader 5, backtesting a strategy using the Strategy Tester visualization is a straightforward process. This feature allows you to get a visual representation of how your strategy performs. However, to delve deeper into the performance of your strategy, you need to navigate to the ‘Backtest’ section. This is where MetaTrader 5 showcases its robust analytical capabilities.
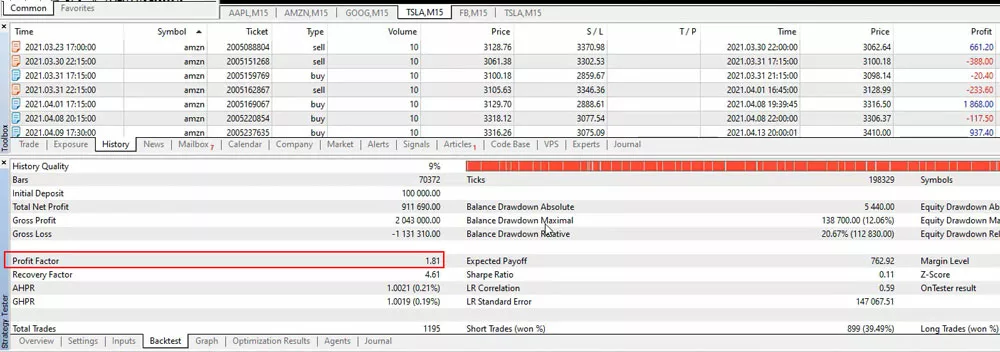
Key Metrics in Backtest Results
In the ‘Backtest’ section, you will encounter several crucial statistics that provide insights into your strategy’s performance. These include the overall balance, the drawdown, and the expected payoff. One of the key metrics here is the ‘Profit factor’, which in this instance is above 1.81. This figure is significant as it represents the ratio of all profits to all losses. A Profit factor greater than 1 indicates that the strategy is profitable, as it means the profits exceed the losses.
Comparing MetaTrader 5 and MetaTrader 4 Backtesting
When it comes to backtesting statistics, MetaTrader 5 offers a more comprehensive set compared to its predecessor, MetaTrader 4. This enhanced capability allows for a more detailed analysis of the strategy’s performance.
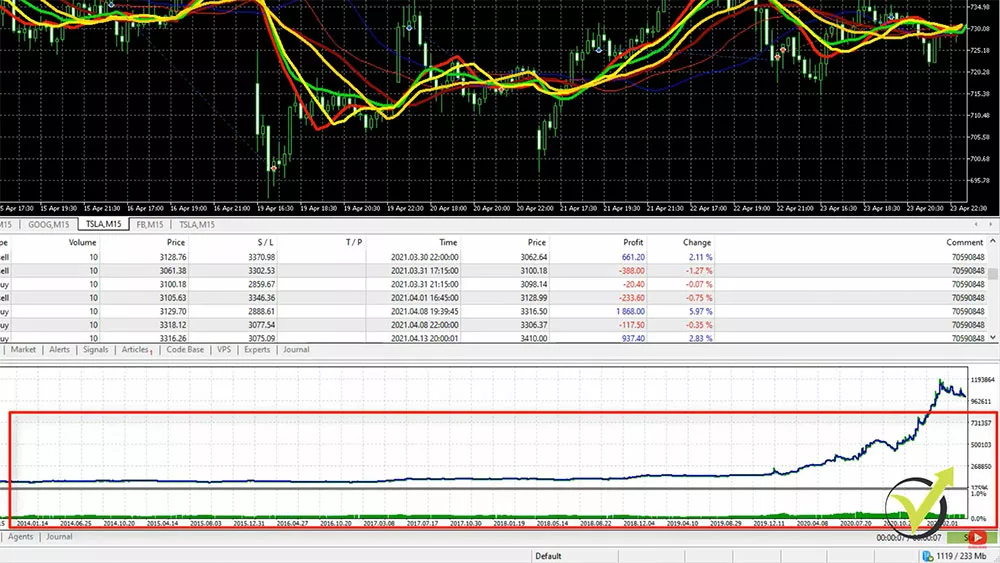
The Graph Tab: Visualizing Strategy Performance
Another notable feature in MetaTrader 5 backtesting is the ‘Graph’ tab. This tab presents a graphical representation of the trading strategy’s performance over time. It becomes particularly useful in understanding how a strategy fares in different market conditions. For example, in recent months, the market for Tesla stocks has been quite volatile. The ‘Graph’ tab clearly shows the strategy’s performance during these periods, highlighting significant movements and results. In this case, it demonstrates that the strategy achieved impressive profits amidst the market’s volatility.
Advancing with EA Studio
While Metatrader 5 offers a solid foundation for backtesting, EA Studio takes it to the next level. This advanced tool provides detailed analysis and rapid results, making it a favourite among professional traders.
MetaTrader 5 vs EA Studio: A Comparative Analysis of Backtesting Tools
Instant Feedback and Detailed Analysis
EA Studio’s standout feature is its ability to provide immediate feedback on strategy adjustments. This means you can tweak your strategy and see how it performs instantly, saving you valuable time. The detailed analysis offered by EA Studio helps you understand the nuances of your strategy, ensuring you’re well-equipped to make informed trading decisions.
Ease of Use: EA Studio’s Advantage
When it comes to backtesting trading strategies, many prefer using Expert Advisor Studio over MetaTrader 5. The primary reason for this preference is the ease of use offered by EA Studio. Unlike MetaTrader 5, where you might find yourself switching between multiple tabs, EA Studio streamlines the process. Its user-friendly interface and professional-grade software make it a preferred choice for many traders.
Note, this is in the context of backtesting strategies. This is just one of the many features of EA Studio, not least of which is it’s ability to automatically create strategies, based on backtesting over historical data. You can select and adjust these dates as needed when using the Generator. We’ll look at this in more detail in the Data Horizon section below. You can also create your Expert Advisors from scratch with no programming or coding experience required. Let’s discuss this in more detail.
Benefits of EA Studio for Backtesting in Trading
While MetaTrader 5 is a powerful tool for backtesting, EA Studio offers additional advantages, particularly for traders who need deeper statistical insights and faster testing capabilities.
Comparison: MetaTrader 5 vs. EA Studio for Backtesting
| Feature | MetaTrader 5 | EA Studio |
|---|---|---|
| Backtesting Speed | Moderate | Extremely Fast |
| Customization | Limited | Extensive |
| Strategy Optimization | Basic | Advanced with Auto-Optimization |
| Graphical Analysis | Standard | More Comprehensive |
| User-Friendliness | Requires manual setup | Intuitive interface |
Why EA Studio Stands Out:
- Allows traders to instantly modify strategies and see the results without re-running the entire backtest.
- Provides a more pessimistic outlook to help traders prepare for real-world market conditions.
- Supports multi-strategy portfolio testing, enabling traders to run different Expert Advisors simultaneously.
While MetaTrader 5 remains a robust choice, combining it with EA Studio enhances the accuracy and efficiency of backtesting for traders.
Strategy Editor in Expert Advisor Studio
Clear Layout of Trading Strategies
In the Expert Advisor Studio Strategy Editor, every aspect of your trading strategy is displayed in a clear and straightforward manner. This layout makes it easy for traders, even those who are not native English speakers, to understand and analyze their strategies.
Understanding Entry Indicators
One of the key features of this editor is the visibility and customisation of essential entry indicators. These tools are crucial for traders to identify potential entry points in the market. The Moving Averages, in particular, are used to detect trends, while the Alligator indicator helps in confirming the trend’s direction and strength. It’s important t note that these are just 2 of the many available indicators, and each indicator has an infinite number of parameters that can be set. The beauty of using EA Studio’s strategy editor is you can immediately see the backtest output as soon as any changes are, without the need to go through the process of backtesting your strategy after every adjustment, like you would in MetaTrader 4
Example Strategy
Let’s take a look at a strategy created in EA Studio. This strategy uses the Bollinger Bands and William’s Percent Range as it’s entry indicators, and The Envelopes as it’s exit strategy, all with custom settings.
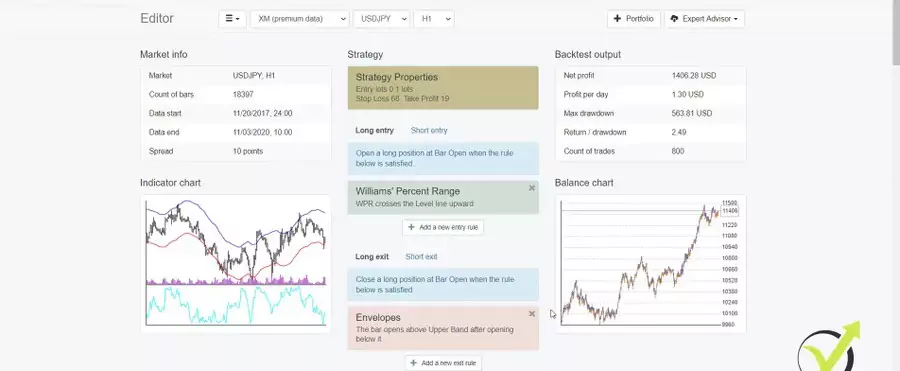
Comprehensive Strategy Analysis in EA Studio
In EA Studio’s Strategy Editor, traders can view their entire strategy with remarkable clarity. This tool displays crucial components like entry indicators, including popular ones like Moving Averages and the Alligator indicator. This level of detail is essential for traders to understand the mechanics of their strategy.
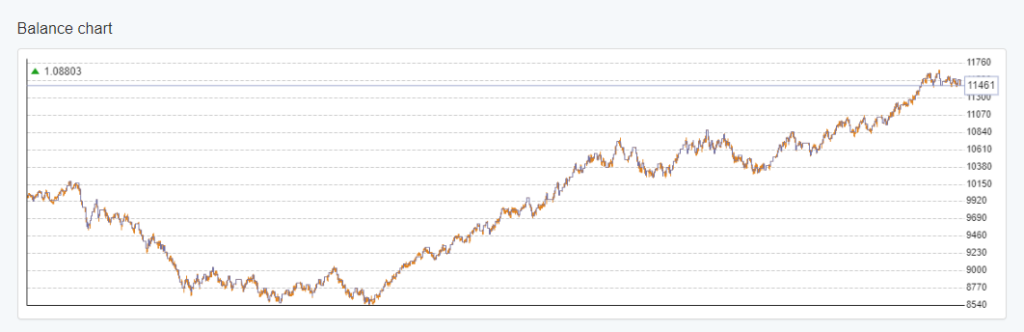
Enhanced Visibility with Balance Chart
The balance chart in EA Studio, similar to Metatrader 5, is presented in a differently sized window. This variation in size enhances clarity, making it easier for traders to analyze the performance of their strategy over time. The balance chart effectively illustrates the strategy’s profitability, providing a visual representation of gains and losses.
Entry and Exit Indicators in EA Studio
EA Studio’s Strategy Editor also includes detailed entry and exit rules. For instance, the Williams’ Percent Range is used as an entry indicator, with specific conditions like crossing the level line upward. For exits, the Envelopes indicator is employed, with conditions such as the bar opening above the Upper Band after opening below it. These indicators and conditions are crucial for defining the strategy’s operational parameters.
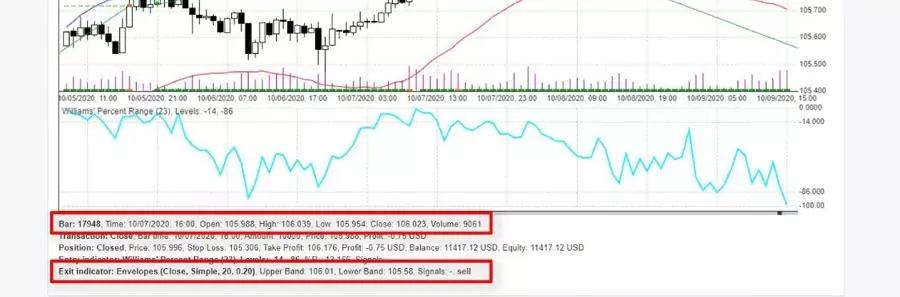
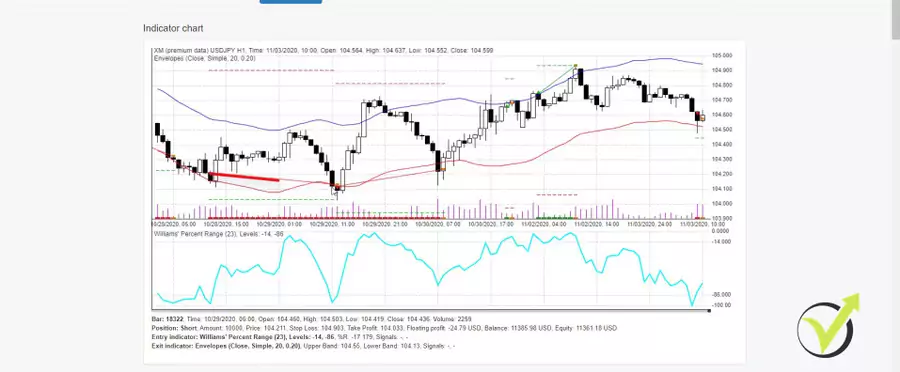
Indicator Chart for Precise Trade Analysis
One of the standout features of EA Studio is the Indicator chart. This chart allows traders to see exactly where trades were opened and closed, including short and long positions. For example, red bars or small lines below the chart indicate short positions, while green lines represent Take Profit points. This level of detail is invaluable for traders to understand the nuances of their strategy.
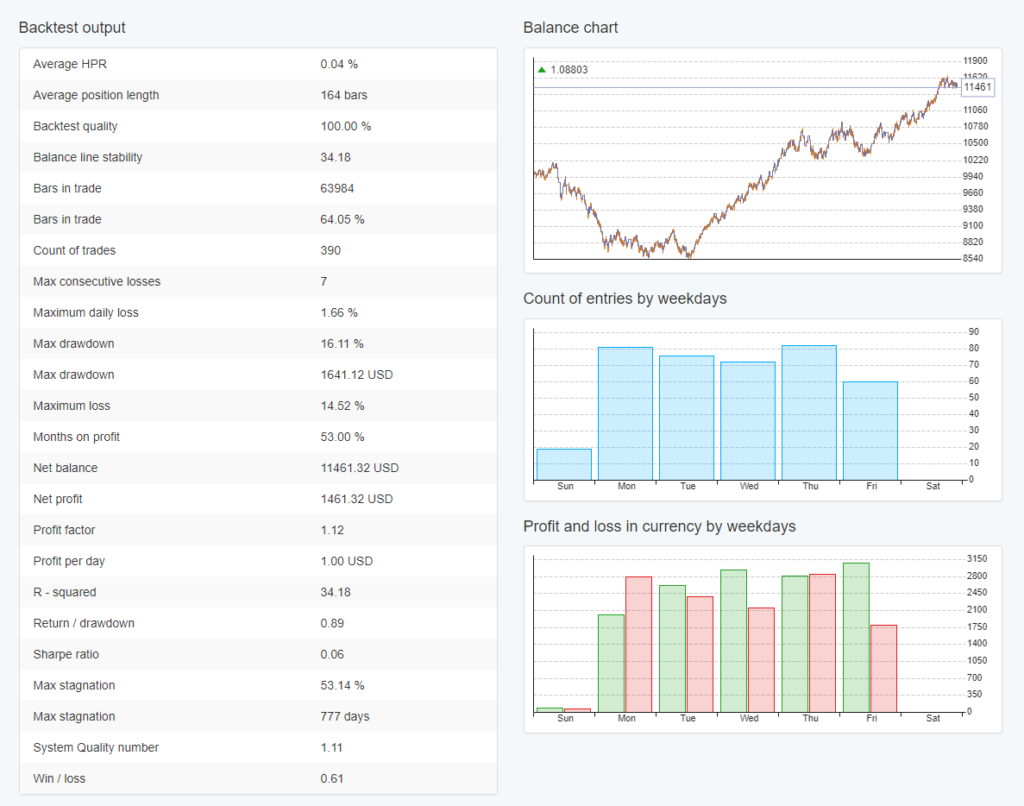
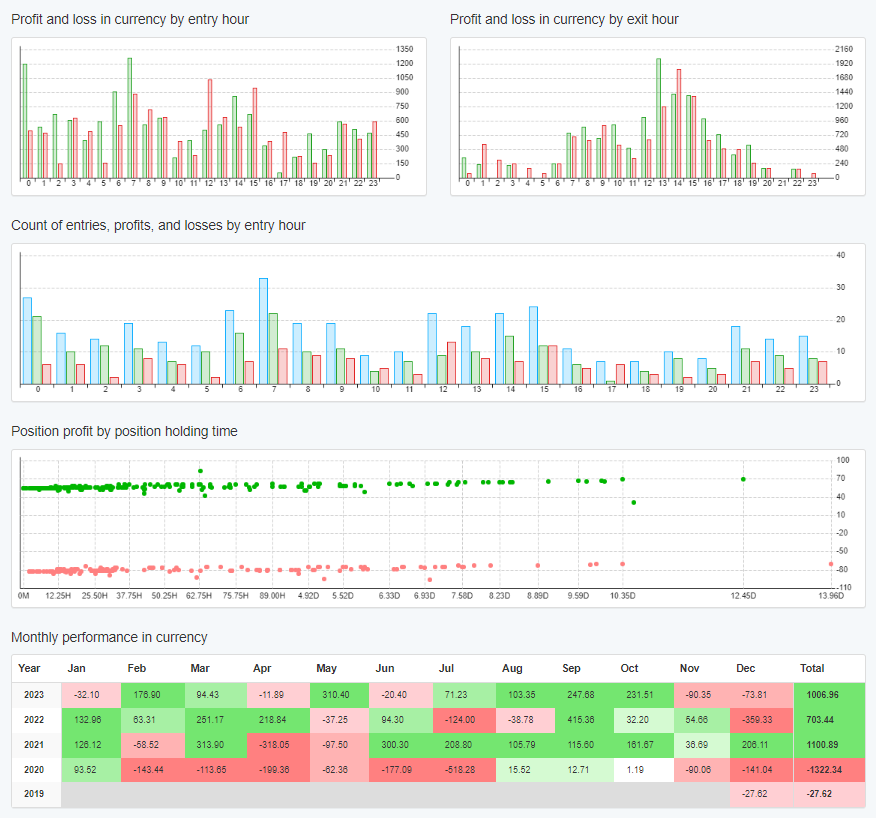
Comprehensive Statistics in EA Studio
EA Studio offers a wealth of statistics, providing a deeper understanding of the strategy. The backtest outputs include vital information like profit per day, maximum drawdown, return to drawdown ratio, and the count of trades. These statistics are crucial for evaluating the strategy’s performance and making informed adjustments.
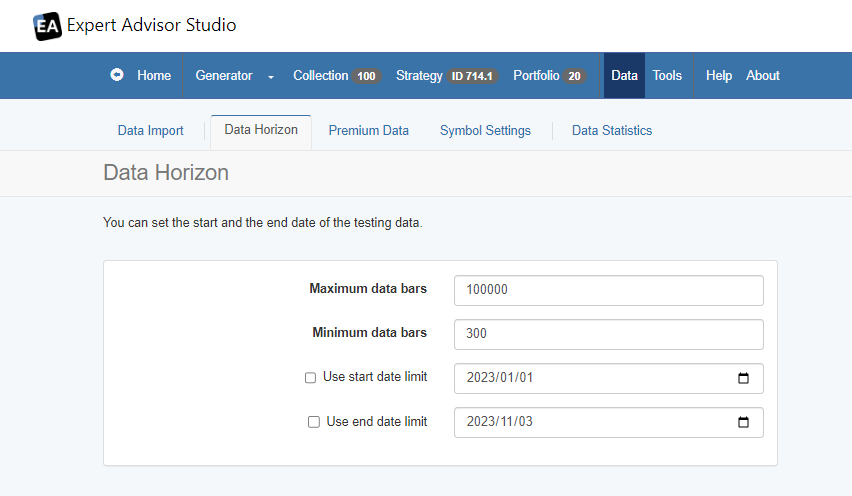
Data Horizon Feature in EA Studio for Metatrader 5 Backtesting
In EA Studio, a key feature for backtesting is the ‘Data Horizon‘ function. This feature allows traders to select the range of historical data they wish to use for backtesting their strategies. With the ability to adjust the data horizon, traders can extend their analysis up to 200,000 bars for each asset. This extensive range is particularly beneficial for gaining a comprehensive understanding of a strategy’s performance over various market conditions. By utilizing this feature, traders can ensure that their backtesting is based on a broad and representative sample of historical data, enhancing the accuracy and reliability of their strategy evaluations. The Data Horizon function in EA Studio thus stands out as a crucial tool for traders aiming to refine their strategies with precision and depth in Metatrader 5.
Risk Diversification and Historical Data Usage
EA Studio also emphasizes the importance of risk diversification. By trading a portfolio of strategies, traders can balance out periods of losses with profitable trades. The use of historical data is key in this process, with EA Studio allowing the use of up to 200,000 bars for each asset. This extensive data range enables traders to backtest strategies over longer periods, providing a more comprehensive view of their effectiveness.
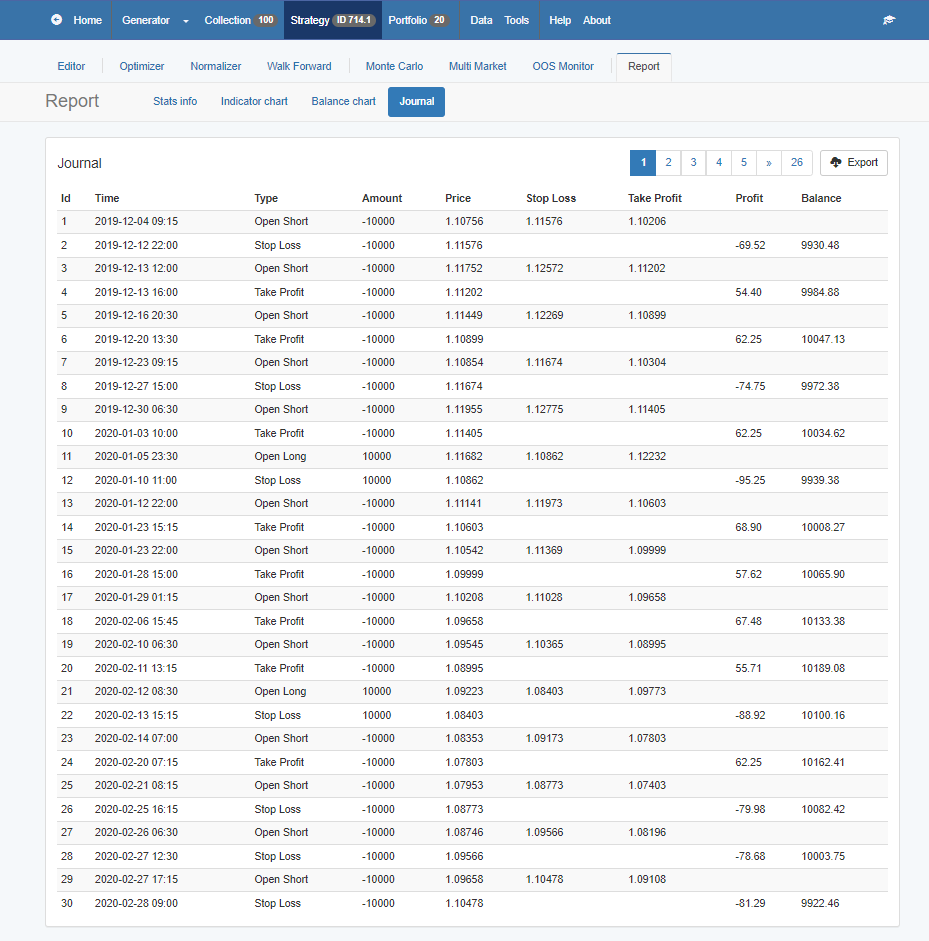
Analyzing Trades in EA Studio
The Journal in EA Studio is particularly useful for analyzing trades. It consolidates all trade data in one place, unlike MetaTrader 5, where data is spread across different tabs. For instance, you can easily review the most recent trades by navigating to the last page of the Journal. This feature allows for a quick and comprehensive analysis of trade performance.
Comparing Trades Between Platforms
A direct comparison of trades between MetaTrader 5 and EA Studio will reveal their similarities. There may be slight difference due to live speeds, missing bars in historical data from the broker and other fees including swaps. However, if set up correctly, the overall backtest balance line and equity figures should be very similar.
MetaTrader 5 Strategy Tester Visualization
While MetaTrader 5 includes a feature known as the Strategy Tester Visualization, which is a useful tool for traders, it does come with certain limitations, especially when compared to the capabilities of EA Studio. One notable limitation in MetaTrader 5 is observed when users switch between the ‘History’ and ‘Operations’ tabs. Unlike EA Studio, where a seamless transition between different data points is possible, MetaTrader 5 does not display the backtesting results in these tabs. This lack of visibility can be a significant drawback for traders who rely on these results to gauge the effectiveness of their trading strategies. The backtesting results are essential for a comprehensive analysis of how a strategy performs under various market conditions, and not having them readily available in the same tab can hinder the efficiency of the strategy evaluation process in MetaTrader 5.
Advantages and Disadvantages of MetaTrader 5
While MetaTrader 5 provides a good backtest to ensure consistency with EA Studio, it has some disadvantages. For those accustomed to EA Studio or MetaTrader 4, following trades in MetaTrader 5 can be challenging due to the separation of data into different tabs. However, MetaTrader 5 does offer more data and backtesting statistics compared to MetaTrader 4, which is a significant advantage.
Avoiding Backtesting Bias and Look-Ahead Bias
One of the biggest challenges in backtesting is bias, which can mislead traders into believing a strategy is more successful than it actually is.
Types of Backtesting Bias:
- Selection Bias: Occurs when traders pick only favorable time periods for testing.
- Survivorship Bias: Happens when only successful assets are considered while ignoring failed ones.
- Look-Ahead Bias: Involves mistakenly using future data that would not have been available during the actual period tested.
Ways to Avoid Bias:
- Use diverse historical data sets to test a strategy under multiple conditions.
- Conduct out-of-sample testing by leaving a portion of data unseen during strategy development.
- Ensure backtests replicate real-world trading conditions, including spreads and slippage.
Free 15 Day Trial
In EA Studio, a standout feature for Metatrader 5 backtesting is the 15-day free trial. This trial is a game-changer, especially when comparing EA Studio with MetaTrader backtesting. For 15 days, you can make use of this unlimited use license, and create thousands of your own robots. I often demonstrate MetaTrader backtesting in my courses to highlight the significant differences. EA Studio is professional software, offering a more streamlined and efficient backtesting experience.
The beauty of EA Studio lies in its simplicity and power. You don’t need programming skills or the need to hire developers. With just one click, you can export numerous Expert Advisors. This ease of use is why I initially chose EA Studio and why it’s now an integral part of our Academy. Our entire team, along with hundreds of our traders, use it regularly.
Final Thoughts on Backtesting with MetaTrader 5
To perform strategy backtesting in MetaTrader 5, the process is straightforward. You need to set up the Expert, Symbol, Timeframe, and Modeling, with ‘Open prices only’ being a common choice for EA Studio strategies. Starting the backtest will reveal if the strategy was profitable up to the current moment. However, it’s important to remember that past performance in backtesting doesn’t guarantee future profitability.
MetaTrader 5’s Strategy Tester and EA Studio each have their strengths, and choosing between them depends on your specific needs and familiarity with the platforms. EA Studio is however, undoubtedly more powerful and feature-rich.
Tips for Successful Backtesting
Successful backtesting requires more than just the right tools; it needs the right approach. Here, we’ll share tips and best practices for backtesting in both Metatrader 5 and EA Studio. From setting up your test correctly in Metatrader 5 to leveraging the instant feedback in EA Studio, these tips will help you make the most of your backtesting experience.
Conclusion: Your Path to Trading Success
In conclusion, Metatrader 5 Backtesting is a powerful starting point for any trader. Coupled with the advanced capabilities of EA Studio, it forms a robust toolkit for any trader’s arsenal. Remember, the key to success in trading lies in well-tested strategies. So embrace these tools, refine your strategies, and step confidently into the trading arena!