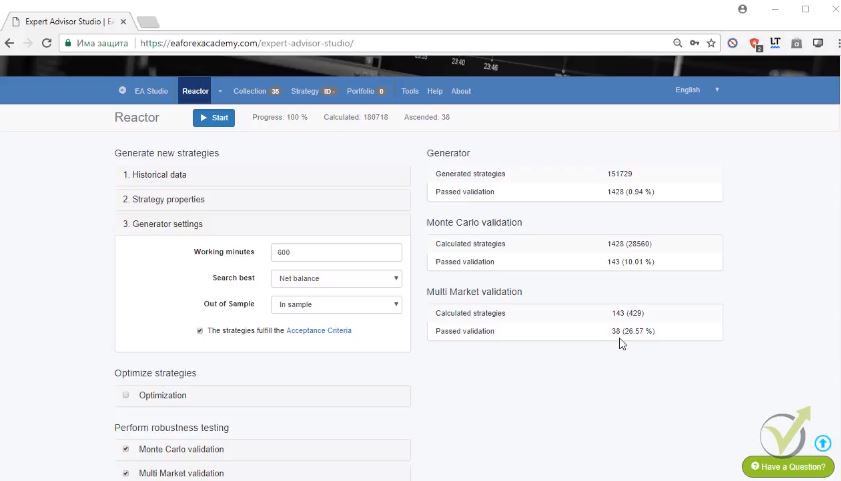
Trading strategy is what every trader looks for.
Trading strategy is not enough, everyone looks for the profitable trading strategy that will bring him profits. In this article, I will demonstrate such EURGBP trading strategy!
This trading strategy is part of the basic master class from EA Forex Academy called MetaTrader 4 Forex platform: Start trading with a pro trader.
In the course, you will find 2 more strategies that are shared, and three of them are for different currency pairs.
Why this trading strategy is on H1 chart?
This is because for three of them for EURUSD, for EURGBP and for GBPUSD strategies we use bar opening. So we’re looking at every new bar that opens. Let’s go to the end and this means that you don’t need to stay in front of the computer all the time. If you decide to trade these strategies manually not with the Expert Advisors that I will provide you later on in the course.
You will need to look at your chart and every 1 hour. Don’t need to stay in front of the computer the whole time but you need to look at the 1 hour when the new bar opens or when the new hour is there.
You can look at the screen and see if the entry condition is there, the trading strategy rule is there or not. So you don’t need to stay but just to have a look at every 1 hour on the new bar that opens. And one more thing why I have selected the 3 pairs let me put them together. So what we have? We have EURUSD, we have EURGBP and we have GBPUSD.
There is a reason why I have selected these three.
How can we have balanced exposure is trading?
- Euro (one time with EURUSD, one time with EURGBP)
- Dollar (one time with EURUSD, one time with GBPUSD)
- Pound (one time with EURGBP and one time with GBPUSD)
We have equal exposure and this is very important when you are trading a couple of strategies together. No matter you have a manual trading strategy or automatic and you place, for example, only Dollar currency pairs. This is very, very wrong and many traders are doing that.
For example, they trade GBPUSD, USDCHF, USDJPY, USDCAD, USDAUD and they open many positions with Dollar currency pairs. And if something dramatic happens with the Dollar for the day. Some important news or anything you can have an actually huge loss on all of your positions. So make sure to diversify between currency pairs and to have equal exposure.
That’s why I have selected these three trading strategies one for EURUSD, one for EURGBP and one for GBPUSD. And one more time on each one chart we are looking at the bar opening. If you want to trade these strategies manually you can have a look at the chart only on every round hour. So for the EURGBP strategy, we will be using the Accelerator Oscillator. And I will go to insert, indicators and I will go to Bill Williams and then Accelerator Oscillator:
Here it is, it doesn’t have any parameters I click on OK and here we have it over the chart:
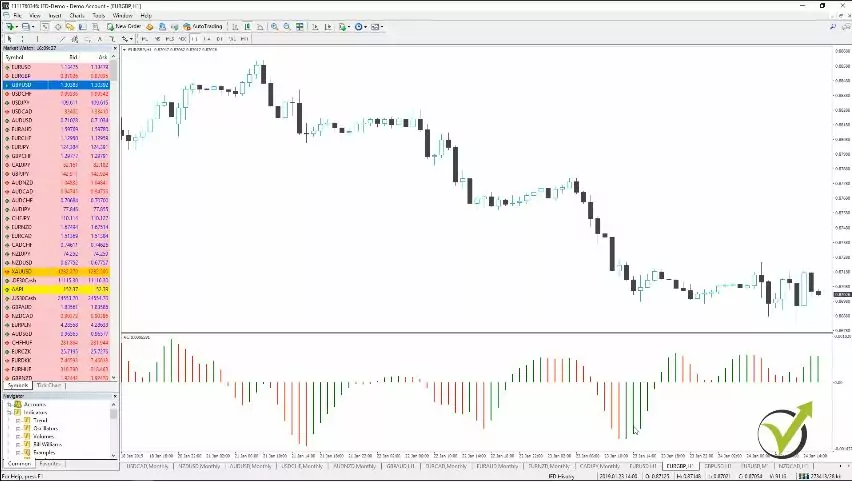
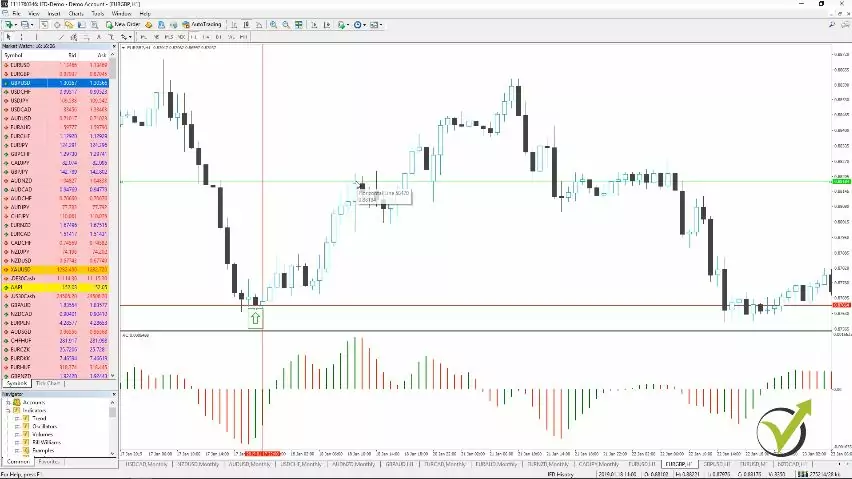
The trading strategy rule for a long trade is Аccelerator Оscillator changes its direction upward.
This means that we will enter every time long when we see the Accelerator Oscillator changing its direction upwards. And again the current bar is moving. When the price moves you will see that the indicator bar as well is moving up and down. So to make the signal clear you need to wait for one bar that is below the previous one for example, for the short trade. And when the new bar opens you can enter, for example, over here. Let me move the chart this way.
I will just zoom it a little bit so here you see we have a negative bar and then right here we have a smaller bar. But during this time it’s moving because of the price that is moving during this one hour. And then on the opening of next one right over here I will see that I have already one bar smaller than this one with certainty. Because it will not move anymore.
This is the entry moment for the trading strategy and I will enter at the opening of thе bar.
So we always wait for one bar for confirmation that is smaller than the previous one. And then we enter the next one. So sometimes you see that the bars are nearly equal and if I put the mouse on it you can see that it shows the value. So it’s 9385 and here we have 9 169. But of course, the easier way is to recognize it by the color. So if you have a series of green bars and then you have a red one this means that this bar already is smaller than this one. Then on the opening of this one you can enter the market.
Let me zoom it out. So one more time we enter on the market when the oscillator changes its direction. So when from red we have one green and then on the opening of the next one we are going long. And on the other side when we see a series of green bars and we have one smaller or one red bar on the opening of the next one. We go short.
Let’s have a couple of examples in a row.
So you can understand easier the trading strategy. We see right over here one smaller bar and then on the next one, we are entering long. We have it right over here:
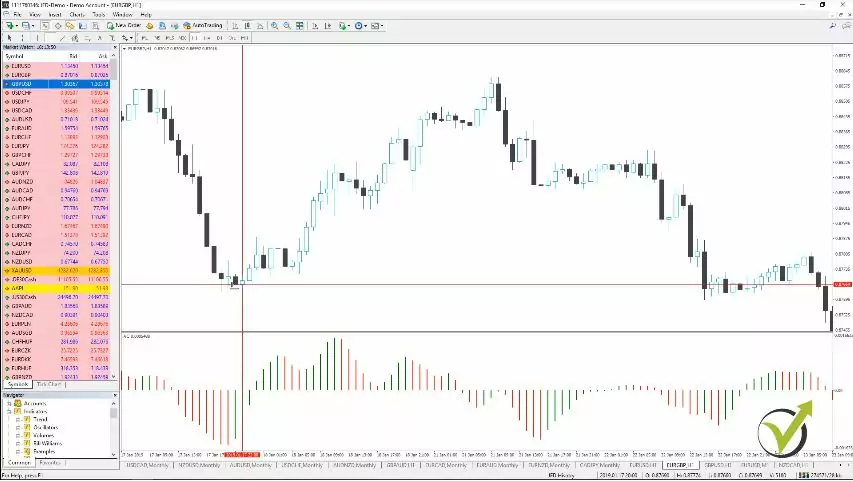
At the opening of this bar and this is at 1.87 66 this is the price when this bar opened over here just after the Accelerator Oscillator changed its direction upwards. And as well we are having a Stop Loss and Take Profit. Here we have a smaller Take Profit than the Stop Loss takes profit of 52 pips. Let me place it.
I will just make the horizontal line green. And I will have the value of 1.87626 and 4 points if we need to be very precise plus Take Profit of 52 pips. This will be 0.88114. And I will have it exactly in the place. And then below I will have a Stop Loss another 78 pips under. But obviously here with this example, if we place the trade here our Take Profit will be hit.
No need to place the Stop Loss over the chart.
I will just place an arrow to make it clear that we are having this long entry right over here. So Аccelerator changes its direction, the price goes up and hits our Take Profit:
Now, here as well we have the RSI indicator as a Take Profit indicator and the period that we are using here is 35 and the levels are the standard 70 and 30. I click on OK.
I will have it below the chart. So one more time for the RSI indicators. Have it on these two strategies this one and the EURUSD and it will happen very rarely that they will hit the 70 and the 30 levels. Because this is a huge period, it’s 35. Its huge period for RSI that’s why it’s not moving too much up and down but it happens.
If I zoom out the chart you will see that there are times actually when it reaches these lines and this is just on the extreme cases. And it is fine even you use it very rarely if you see such an extreme case and the price goes to its maximum.
You would be very happy to Take your Profit over there. So just keep it on the chart even you don’t see too many times happening. You will see it sometimes and you will Take your Profit in a very nice place. So let’s continue now with some consecutive examples.
This way you will learn how to use the trading strategy better.
So if we enter here then our Take Profit would be hit over here right at this bar. Let’s say you are in front of the computer during this time and you continue to follow the strategy. So here we have a smaller bar and right over here we have signaled to enter short. I will move it right over here at this bar you can see the smaller bar from the Accelerator Oscillator. And then right here will have a short entry.
We will have to Take Profit lower. I will place it exactly on its place but let me place the arrow. I will need arrow down right here. And it went just over the line let me just move it, guys, because I want to make it red. So I will go to our properties and I will make it red. It will have one green for the long entries and one red for the short entries.
Right over here we have it on the opening of this bar and this is a short signal for the Trading strategy.
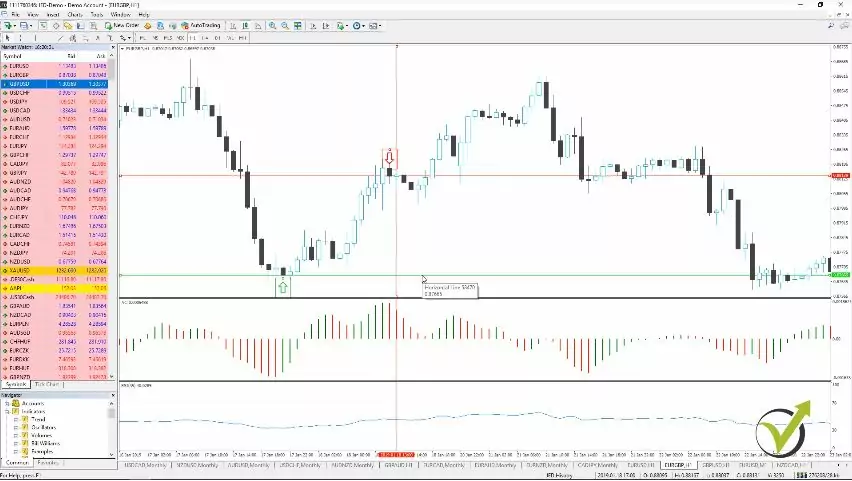
So our Take Profit will be 52 pips lower what we have as a price is 0.8813. Minus 52 pips that would be 0.87619. I click on OK and here we have to Take a Profit and let’s see where is our Stop Loss. We said Stop Loss of 78 pips. So it will be right here above somewhere.
I will calculate it, I will change the color to make it red because it’s a Stop Loss and exactly we need to place it at 0.8813 + 78 pips that would be 0.8891 and then we have 9 points to make it precisely. And you can see that the Stop Loss went much higher and what would have happened.
Here we go short, we place our Stop Loss and place our Take Profit and then you can see the price will go here on negative. But then it will reverse down and we will have our Take Profit hit.
In this situation, we have Stop Loss bigger than the Take Profit.
But one more time I have backtested these strategies with Expert Advisors and I will show you later on that having such a Stop Loss and Take Profit over here it will bring you actually better results. And you will see many traders around the Internet which will tell you that Stop Loss always needs to be smaller than the Take Profit minimum 1-2, should be 1-3.
But this is an old thing and this was a long time before the Algorithmic Trading. Which actually proved that the Stop Loss should not be three times smaller than the Take Profit or two times smaller than the Take Profit. However, I don’t want to argue with anybody about that. Give it a try, see how this works with you on a demo account and I hope you will find it useful. Especially for this trading strategy and especially for these assets.
So to make it clear here this strategy is only for EURGBP. You should not use it for other currency pairs. Same with the EURUSD same with the GBPUSD trading strategy that I will show you in the next lecture.
These are strategies that are created only for these currency pairs on the H1 chart. So you should not change as well the time frame. Keep the currency pair and keep the time frame.
Let’s have a look at one more example.
We said here we will go short and we’ll go down and here we have our Take Profit. Right at this bar and then what we have here let me take the crosshair. What we have here is our Take Profit. We are out that we have a change. Because we have here already a change. We have here a green bar and then a red bar and then here we have another red bar. So we can consider right this for a change and we will have a new short entry right at here. Let me move it.
The next example with the trading strategy is here:
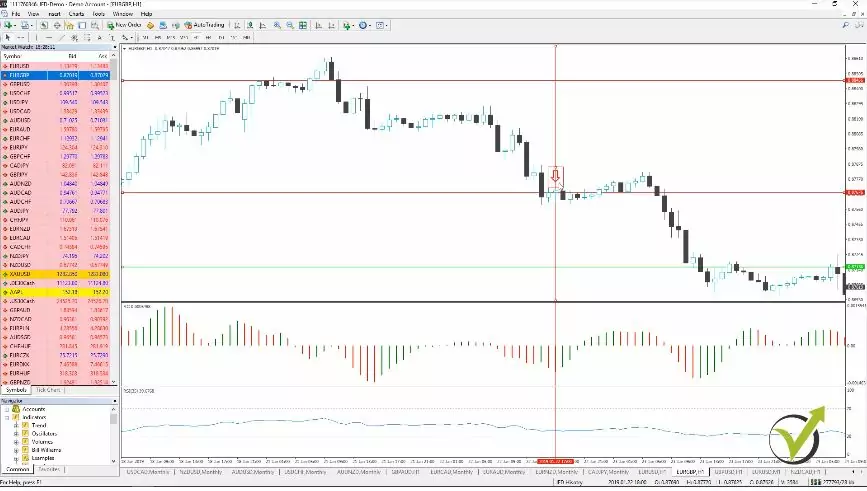
I will move as well the vertical and the horizontal line right over here. And then I will move it as well here at this bar. So here is the entry at 0.8767 and then I will not look at the price further on what happened. I will put the Stop Loss and the Take Profit. So let’s fix the Stop Loss over here.
We have an entry at 0.8767 plus Stop Loss of 78 pips. We will have it at 0.88456 right here and then where is our Take Profit. I will change as well to Take Profit. So we will have 0.8767 – Take Profit of 52 pips. That would be 0.8715. And I press on OK, and it will go lower.
Let’s see what happened after that. Actually, the price went below and hit the Take Profit.
And then again we will have right here another entry and it will be actually a buy. Let me take the arrow to buy. The entry is right over here, smaller bar.
Then on the next one, we enter. We have the first smaller on the opening of the next one actually the opening is right here. Because this is a negative bar we need to place it over here and then we will have a buy. And let’s just see what happened.
We are into the trade. Because we are very close now to the current moment and we will be just a little bit on a negative at the moment. Because our entry price will be at 0.8712 and now it is at 0.8701. Let’s summarize it.
What is a good trading strategy for EURGBP?
- We look when the Accelerator Oscillator changes direction
- We have the RSI as an exit condition as well
- Take Profit and Stop Loss are there
If we see that the price reaches the 70 levels and we are in a long trade. We should Take our Profit if it reaches the 30 levels and we are in a short trade. We can Take our Profit actually here you can see that we have such a break. I think for the 30 levels.
So it would be just a little bit later after we Take the Profit. Because we said we are Taking the Profit right over here. With this example, because the Take Profit level is here but then just a few candles later you see that the RSI just touches the 30 levels.
So it happens rarely but it happens if you see it. It is a great place to Take your Profit because normally it is after such movements where the price goes aggressively in one direction. I will attach again sheet with the parameters for the trading strategy with the trading rules which will make it easier for you to set up your screen for the EURGBP strategy on H1.
Thank you very much for reading!
If you have any questions, please, write to me at the e-mail or write in our trading forum. There you can get an answer not only from me but from many experienced traders.
Cheers!