In this lecture, I will show you a trading strategy for Tesla stocks.
I can talk about Tesla a lot because I like the idea. I think what they did was just a revolution with electric cars. They’ve been on the news a lot in the last couple of years because of the Tesla stock price. However, Elon Musk became one of the richest people because of Tesla.
Tesla Stock Trading Strategy
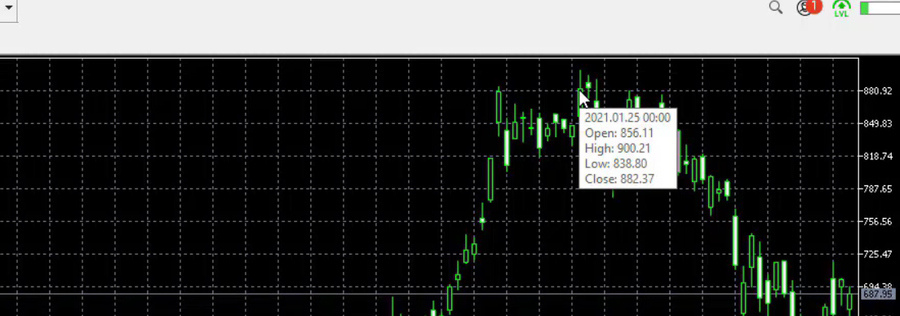
Probably by the time you’re reading this lecture, he will still be in the top 10. I don’t know, it depends on what will happen. But the highest price Tesla stock reached in January 2021 was $900.
And it just bounced out of there and dropped to $538, which is actually a huge drop. So imagine how many people have bought Tesla right at this level. I bet many.
And they are suffering losses at the moment. But these are the people that are actually investing. Again it doesn’t really matter for our Tesla stock trading strategy where are the prices because we are trading down on the M15 chart, we hold the trades for a few days maximum.
The buy and the sell signal
So now the chart will become very colorful. I will try to make it a little bit simpler with the thickness of the lines but you will see what I mean.
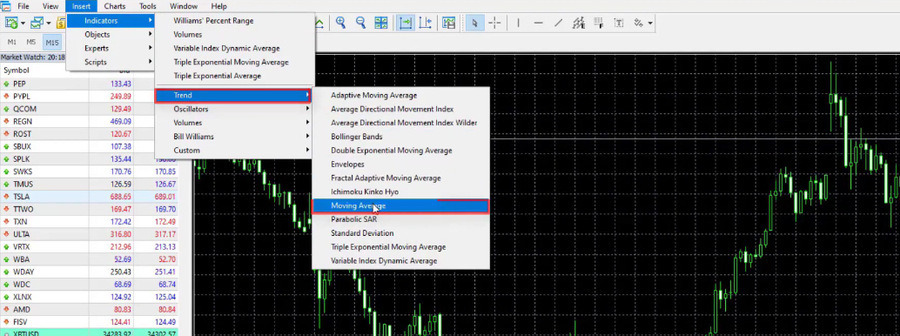
Now, the first indicator in this Tesla stock trading strategy is the Moving Average Crossover. The fast-moving average crosses the slow-moving average upwards. So I will put 2 Moving Averages on the trading chart. They are located inside the trend indicators in MetaTrader.
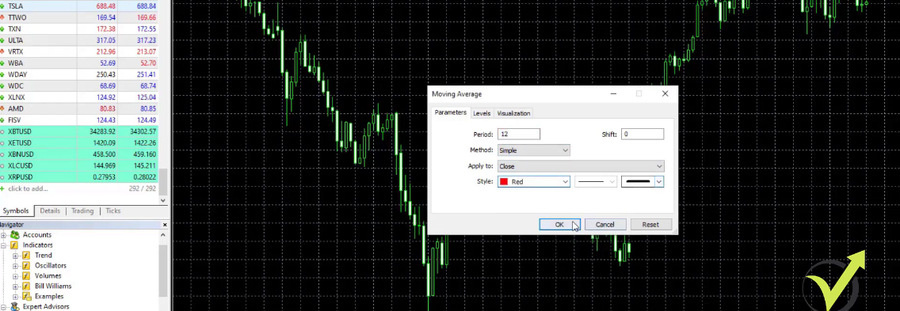
So the first one is with a period of 12, I will make it red again. I will keep it thicker, I will click on OK.
Then I will add one more, which will be slower, period of 30 but I will make it just a little bit darker red and I will keep it thicker.
So when the fast moving average crosses the slow moving average upwards, we have the buy signal and when it crosses downwards, we have the sell signal.
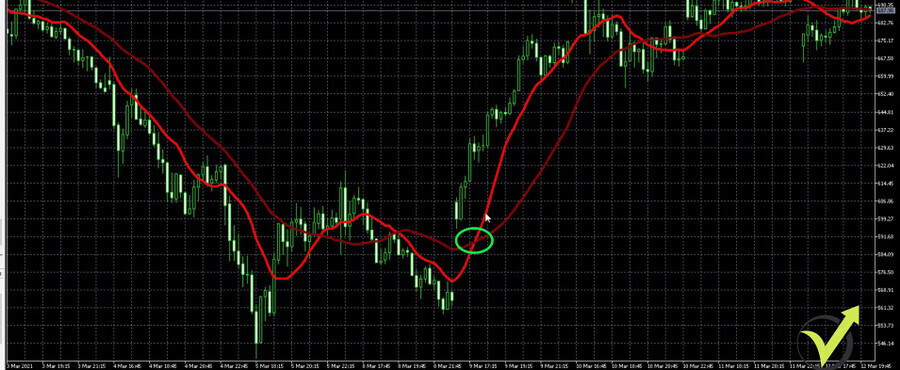
For example, we have a very nice sell trade crossing here. So all of that goes on profit. Then we have buy, sell, buy, very nice trade. And then the prices go sideways.
The indicator properties for Tesla stock trading
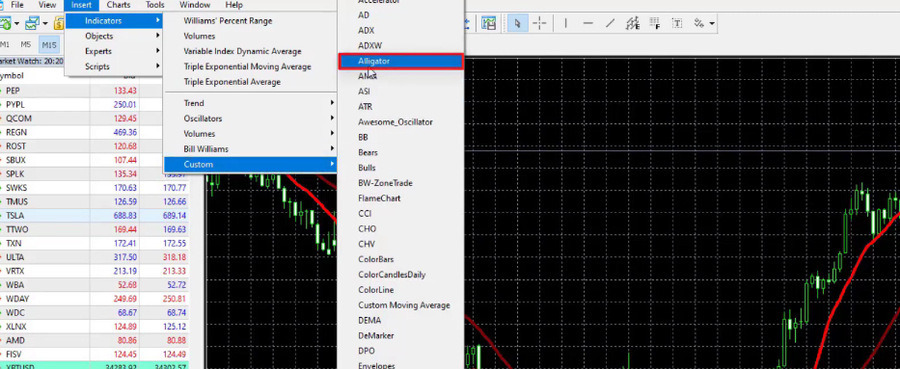
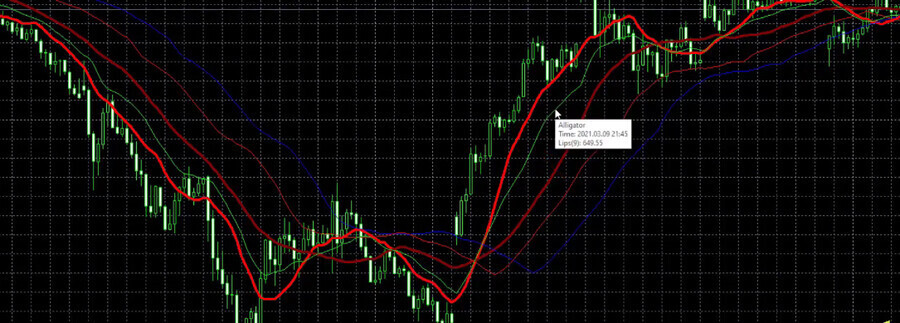
Now, the thing here with this stock trading strategy for Tesla is that we have one more indicator for confirmation to buy or sell. That’s the Alligator. If you already know the Alligator, you will know why I say that the chart will become colorful. This is because the Alligator has many lines.
The Alligator indicator is located inside the custom indicators in MetaTrader.
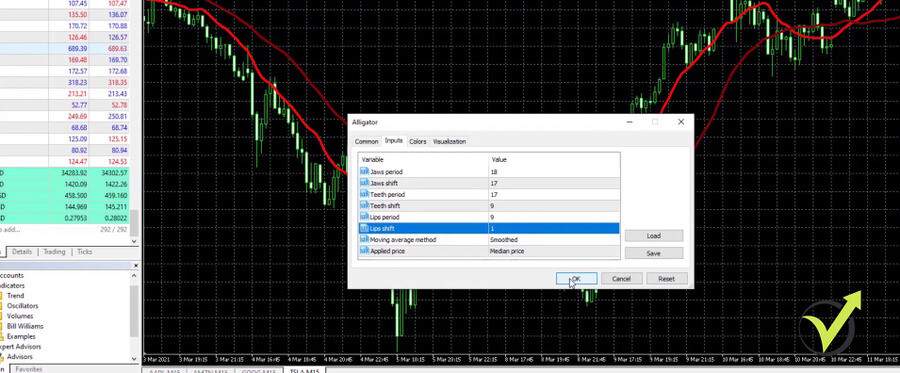
And I will go to Inputs. So here I have some work, Jaws period I will change to 18. The Jaws shift, I will change to 17, the Teeth period, I will change it as well to 17. The Teeth shift I will change to 9. The Lips period I will change to 9 and the Lips shift I will change to 1. And I will just click on OK, so we can see what will happen.
I just see 3 more lines were added to the chart.
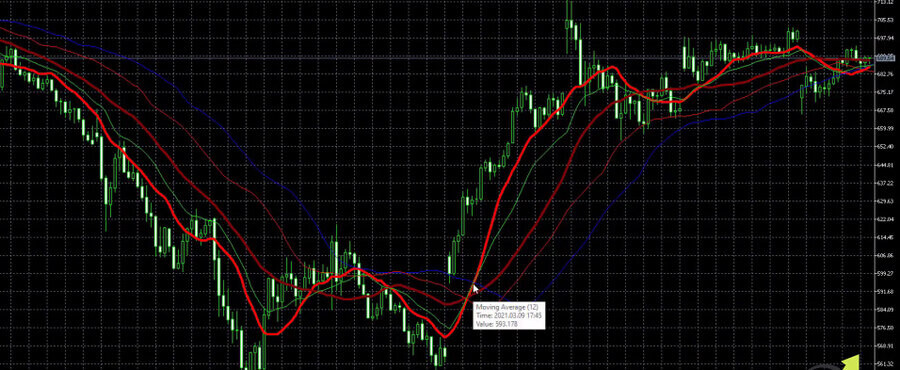
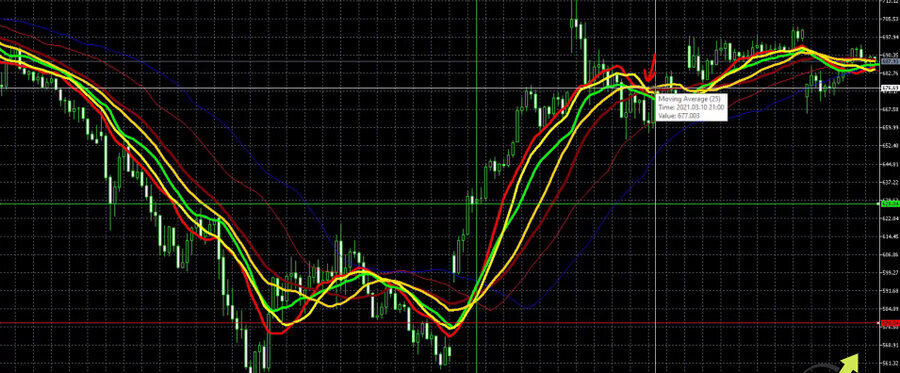
This is the green line, the red line, and the blue line, which is not very visual. Now for the Alligator, there are so many different trading strategies. I am not going into details but what matters for this Tesla stock trading strategy is, that we want to see the Lips rising so they confirm the cross of the moving averages that we already placed. So the Lips of the Alligator is actually the green line. If I put the mouse on it, you will see that it says Lips.
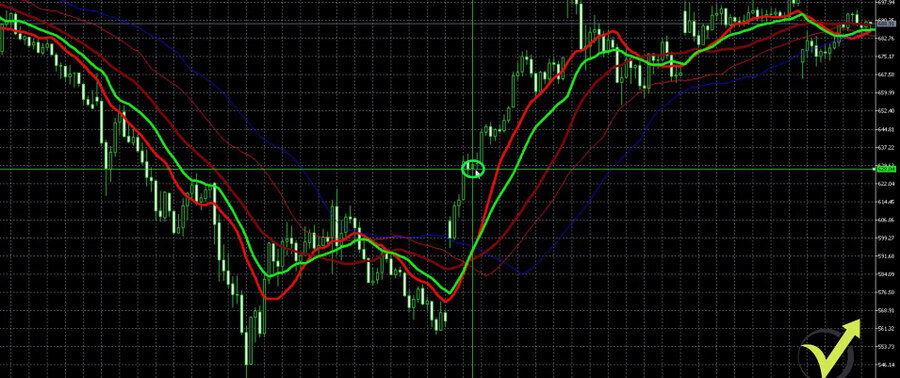
So I will right-click one more time on the properties of this indicator. I will go to colors and Lips is with lime color, which is just fine. And what I will just do is to make it thicker so we can see it better. I will click on OK and it is now visual enough.
So when the moving averages cross, we need to see the Lips rising.
The confirmation to buy
And in the above example, when we have the fast-moving average crossing the slow-moving average, we see that at the same time the Lips are rising, so it’s a confirmation to buy.
Let me put a few lines. So the cross happened, let’s say, on the opening of the next bar. I will have one horizontal line as well. At that moment, we have the confirmation to buy.
Now, what is the Stop Loss? It is $50 lower. So if the price we enter is $628.04, then our Stop Loss will be, I will make it red because it’s a Stop Loss and the value will be $50 lower, which is $578.04. I click on OK, and you see where is the Stop Loss.
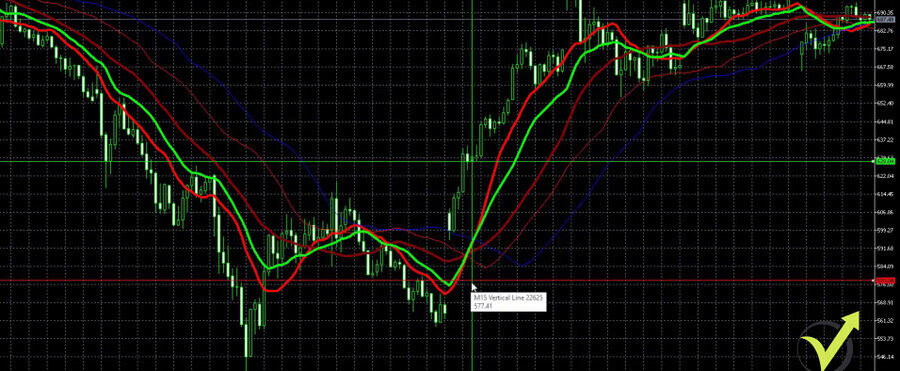
So if we buy here, the price goes against us, the position will close automatically. So it’s a protection for the capital in the account.
Now, what is the exit condition? 2 more lines, 2 more moving averages. That’s why I said the chart will become really, really colorful. I will go again to trend and I will have the fast-moving average with a period of 15. So now let’s make the colors more recognizable. For example, I will take brighter yellow for the fast-moving average.
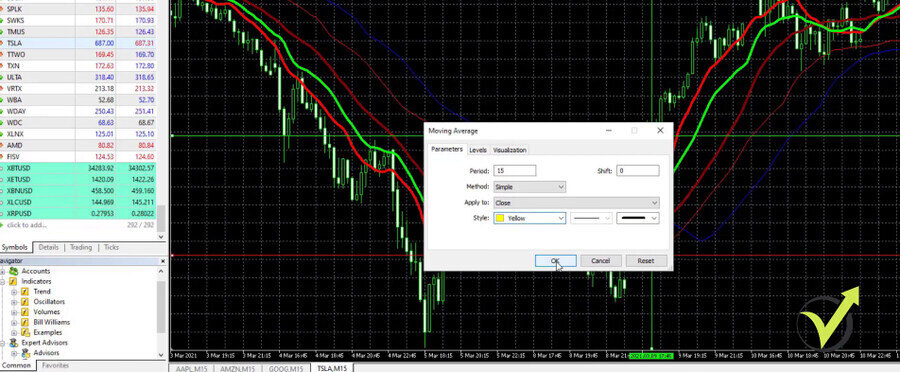
And then I will add one more moving average indicator, which I will make with a darker yellow. Or it says gold, which I think will look OK and this one will be with period 25 and I click on OK.
The Take Profit
So the moving averages in yellow are our exit indicator and when the fast moving average crosses the slow moving average downwards, this is our exit. For example, we said we have a confirmation to buy and here is the cross of the 2 yellow moving averages.
It happened at the candlestick that you see in the image above. So on the opening of that bar, we should exit. What the price is, I will put it precisely as much as I can, probably it would be better if I zoom a little bit. So we have the cross. And then the yellow lines cross and we have the Take Profit. So I will make it again in green because it’s a Take Profit. Let’s make it a little bit thicker so we can see clearly where it is.
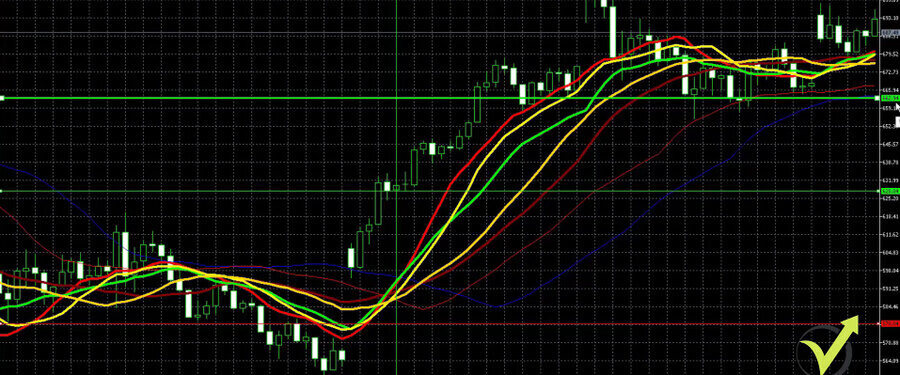
The price is $662.94, the entry $628.04, which makes it a profit of $34.09 I believe.
So this is the trading strategy for Tesla stocks and I really like this strategy.
To summarize it one more time, we have buy signals when the fast moving average crosses the slow moving average.
Parameters for the Tesla stock trading strategy
By the time I’m creating this lecture, these are the parameters I use. So these, the reds moving averages and we need to see confirmation that the Lips of the Alligator rises. The exit rule is that a 15 period moving average should cross 25 periods moving average downwards. And this is for the buys, for selling is the very opposite thing.
We need to see the red moving averages crossing and the brighter one crossing the darker red moving average downwards. And then we need to see the Lips falling at the same time. And the exit will be when the yellow moving averages cross or the yellow crosses the golden one, as it says in Meta Trader indicator properties.
So we have the exit and the Stop Loss is 50. But one more time, these are the indicator parameters that I use currently when I’m creating this lecture.
Final words
This is the strategy for Tesla stock, very colorful. But once you get used to it, you will see very clearly where are the entries and where are the exits.
Of course, you can change the colors any way you want. I just like to use these colors for the Tesla stock trading strategy. But even if you change any other colors, as long as you see clearly where the entry is and where the exit is, you’re good to go with any colors.
Thanks for reading. We’ll see you in the next lecture.