Home › Forums › EA Studio › EA Studio Tools and Settings › Finding Profitable Strategies

- This topic has 27 replies, 2 voices, and was last updated 5 months, 3 weeks ago by
Alan Northam.
-
AuthorPosts
-
-
August 22, 2024 at 20:31 #302151
Ricky Suen
ParticipantHello, all. I am a new comer to the EA Studio. I have experimented a lot with the software but cannot find any consistantly profitable strategies. To find the strategies for a past month, I use the historical data of n months before that month. Although the strategies are profitable for the n months, when I apply them to the target month, they become losing. I tried a lot of symbols, time frames, acceptance criteria, robustness testing but the result is the same. May I know if anyone here can generate strategies which are consistantly profitable? What is your setting? Have you performed the same testing as mine?
-
August 23, 2024 at 12:23 #302222Participant
Hi Ricky,
In Generator use Out of Sample Testing. Historical data set for last one year including the current date. In the Acceptance Criteria make the out of sample and in sample white fields to have a profit factor of 1.2. This should get you going in the right direction.
Alan,
-
August 23, 2024 at 18:00 #302271Participant
I think your method only means that you split the historical data into two sets and perform backtest on each of them. You assume that if these two sets pass the backtests, it will perform well in the future.
I want to use the historical data to prove if it is true. My method is: (1) Set data horizon to 1/6/2023 to 30/9/2023 (4 months); (2) Generate the strategies using EA Studio; (3) Add the top 5 strategies to the portfolio; (4) Change the data horizon to 1/10/2023 to 31/10/2023 (next month); (5) Recalculate the portfolio; (6) Advance the data horizons by one month and repeat the process ten times.
Since all strategies generated in step (2) are profitable, I expect that the result from (5) (i.e. next month after the sample data) is also profitable on average. However, the result is very disappointing. The average is losing. It means that if I used the generated strategies in the past, I would be losing money.
May I know if my testing is meaningful? Why the result is negative? Has anybody tried to perform similar tests and got positive results?
-
August 23, 2024 at 19:59 #302285Participant
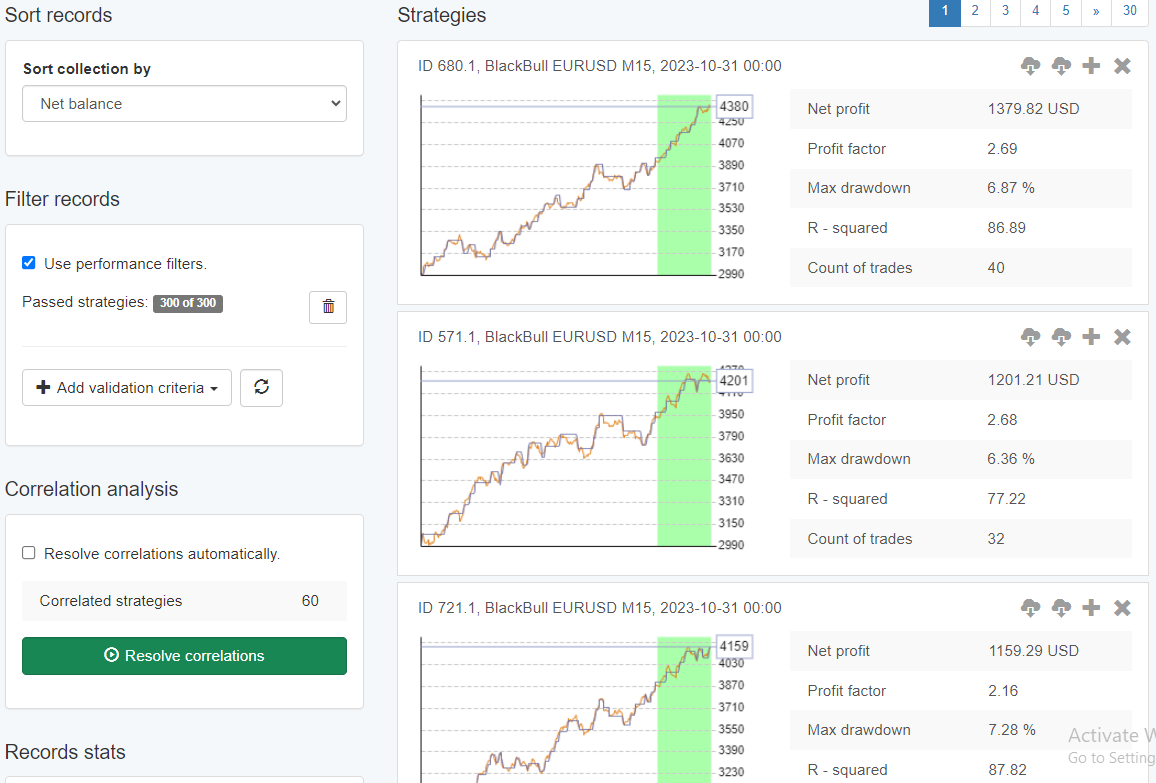
No! If you set the historical data to 1/6/2023 to 30/10/2023 and select OOS equal to 40% it will use the 1/6/2023 to 30/9/2023 (the sample historical data) to find strategies with profit factor of 1.2 or greater. It will then take these strategies and trade them from 30/9/2023 to 30/10/2023 (the out of sample historical data time period/the next month). The strategies with profit factor of 1.2 or greater in the out of sample time frame will show profitable traded strategies during the next month. When you look at the strategies in the Collection tab the green area is the performance of the traded strategies over the next month (from 30/9/2023 to 30/10/2023). You can then add the best ones to the portfolio.
Alan,
-
-
August 23, 2024 at 21:22 #302311Participant
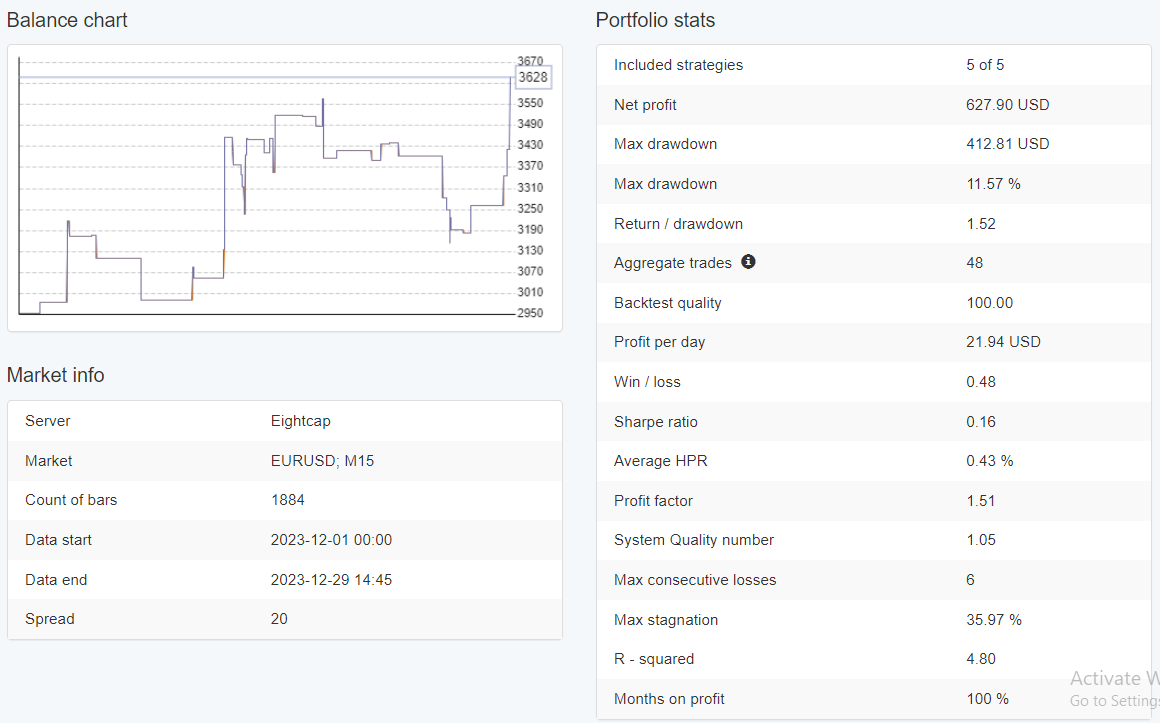
Thanks for your prompt reply, Alan. I think I need to use an example to show my idea. Let me set up a reactor with the data horizon of 1/6/2023 – 31/10/2023, OOS = 40%, min. profit factor = 1.2. After execution, 23 strategies are collected.
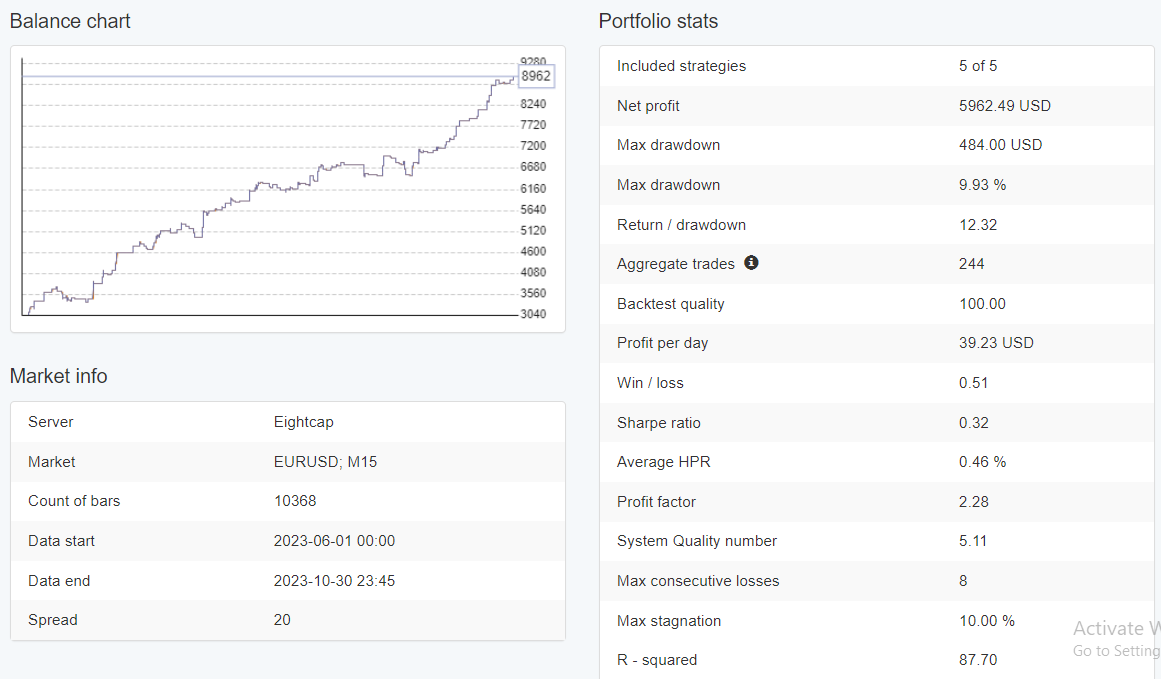
Then I add the top 5 strategies to the portfolio and check the result. The net profit is 1233.18 which is normal.
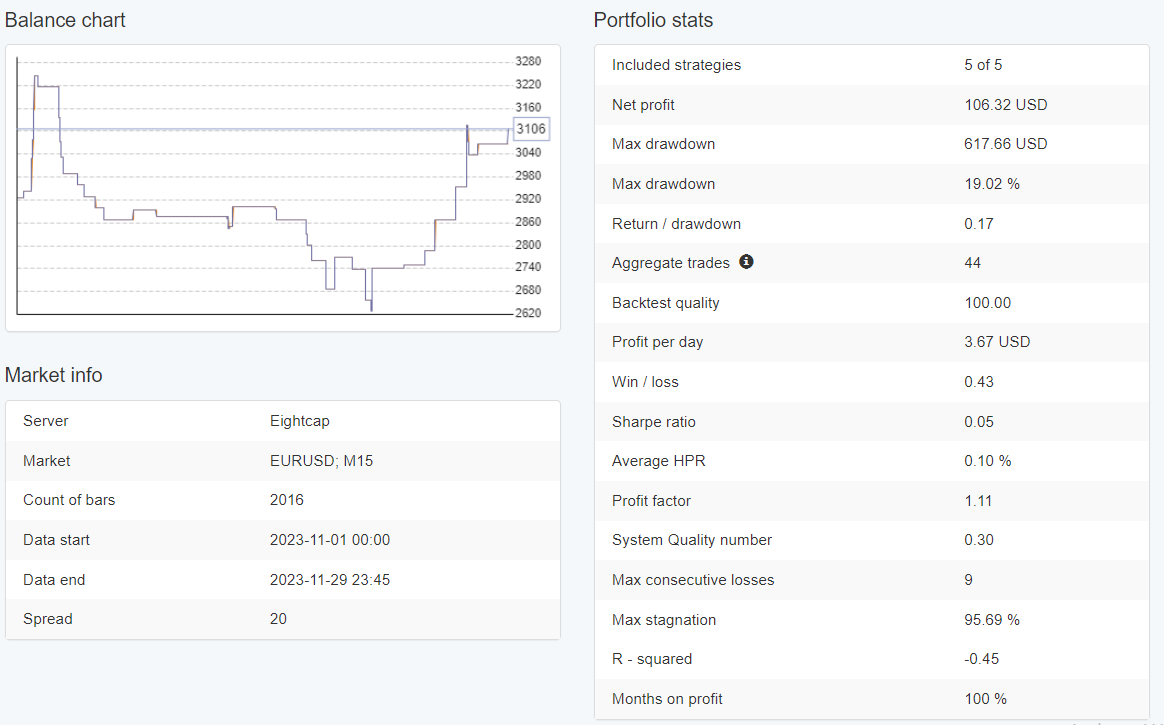
To check how the strategies perform in the next month, I changed the data horizon to 1/11/2023 – 30/11/2023 and click the “Calculate” button in the portfolio page. The net profit became -39.82. It means that the generated strategies is losing in the next month.
I checked many symbols, time frames and data horizon, the negative profit is more common than the positive. So it means that I cannot rely on the strategies generated from previous months. Is this conclusion correct or I am doing something wrong?
-
August 23, 2024 at 21:49 #302312Participant
Let me run the reactor. Is your dates from June 1, 2023 through October 31, 2023? If so then OOS of 20% would be one month not 40%. Sorry if I gave you the wrong OOS percentage number earlier. I will now run the reactor with these numbers.
Alan,
-
August 23, 2024 at 21:52 #302313Participant
Yes
-
August 23, 2024 at 21:57 #302315Participant
Great! I am now running the reactor without Monte Carlo so strategies will be generated faster for testing purposes. I will run the reactor for 3 minutes to collect strategies.
Alan,
-
August 23, 2024 at 22:03 #302316Participant

-
August 24, 2024 at 0:15 #302340Participant
I then added the top 5 to a portfolio. The last 30 days of the balance line is the out of sample part or as you call it “the last month”.

-
August 24, 2024 at 0:20 #302341Participant
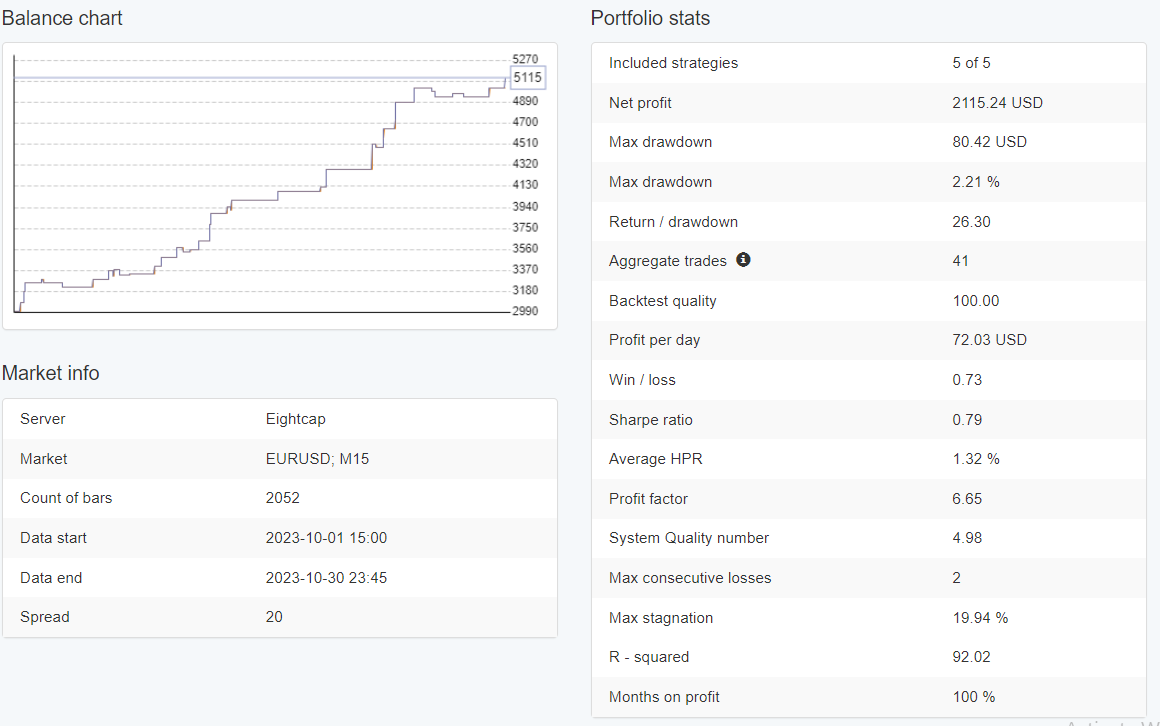
Now I want to see what the portfolio profit was for just the out of sample / the next month was so I change the data horizon from September 30, 2023 to October 31,2023.

-
August 24, 2024 at 3:36 #302352Participant
Alan, could you change the data horizon to 1 Nov 2023 – 31 Nov 2023 and recalculate the portfolio?
-
August 24, 2024 at 11:59 #302396Participant
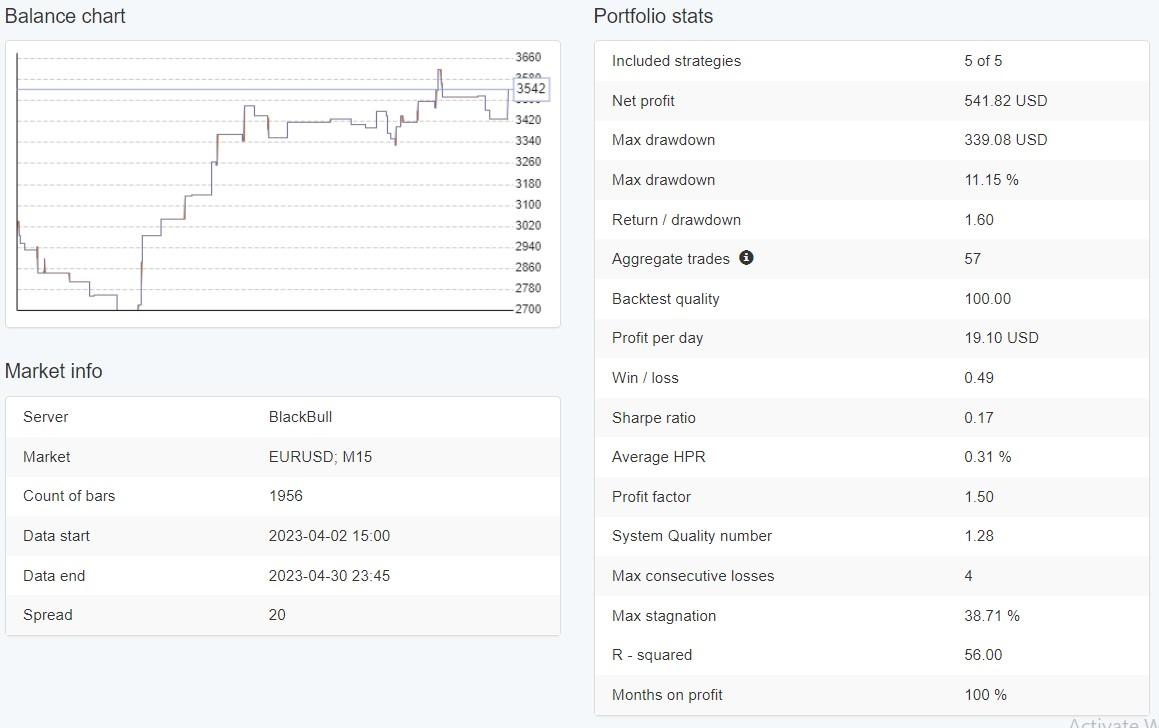
November only has 30 days so I set it to 30 Nov 2023 :o)

Here is Month of December

Here is link to my Dropbox where you can download the settings file:
Click on link, click on file, click on download
Alan,
-
-
-
-
-
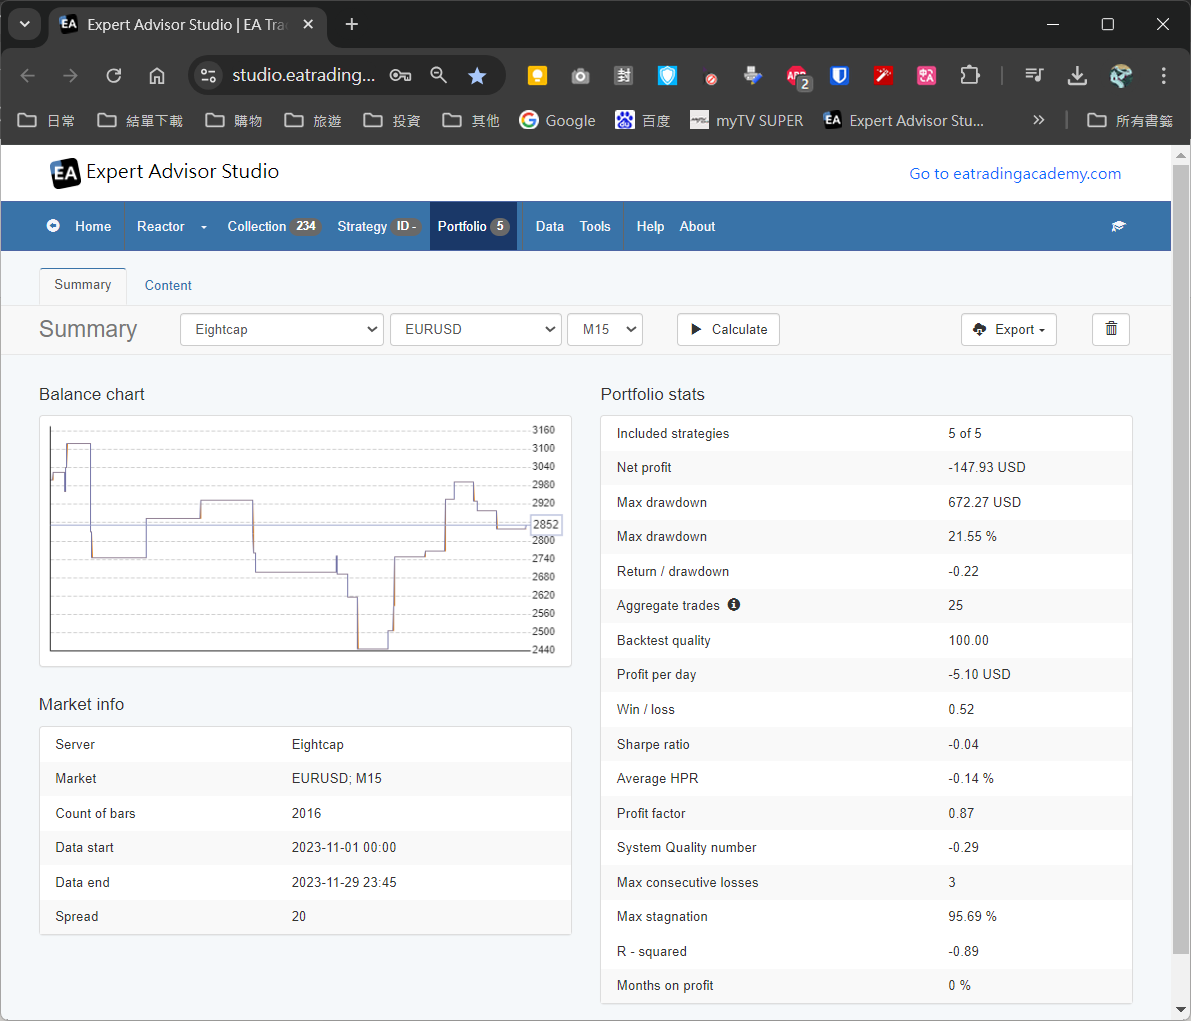
August 24, 2024 at 12:53 #302413Participant

-
August 24, 2024 at 12:55 #302414Participant
Why did I still get negative result?
-
August 24, 2024 at 13:48 #302429Participant
I will run the test again and see what I get.
-
August 24, 2024 at 14:45 #302434Participant
I see what I did. I collected the strategies using Blackbull and then somehow switched to Eightcap to select the top 5. When I do this again I get positive profit for the portfolio in November. However, if I use Eightcap to generate the strategies in the collection and then select the top 5 making sure I am still using Eightcap I do show a loss for the portfolio in November. I will have to start all over again. Sorry for the confusion!
Alan,
-
-
-
August 25, 2024 at 13:01 #302575Participant
Hi Ricky,
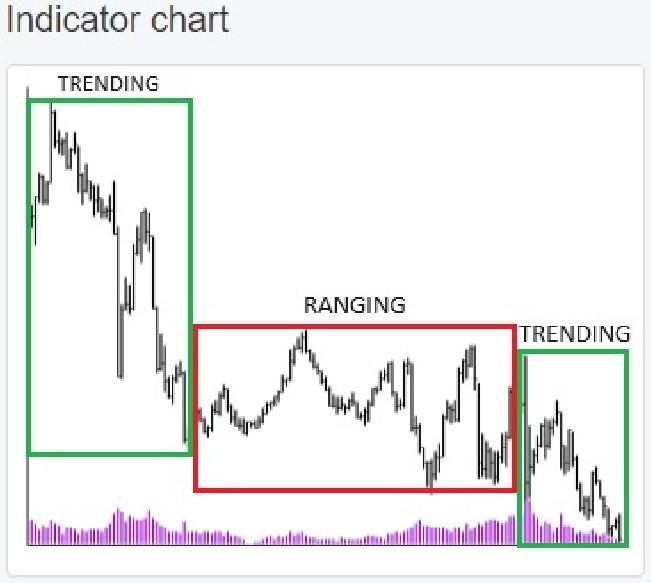
Yesterday I tried many times to generate strategies that would show profit in November 2023 but could not find any. I then sat out to determine why. I finally decided to look at the Indicator chart for EURUSD for the complete year of 2023. I found the date period of June 1, 2023 through October 31, 2023 to be mostly during the period in which EURUSD was trading in a range. So what happens is EA Studio then creates strategies that work good in trading ranges. However, the test period of the whole month of November was in a trending period of the market. The problem is strategies that are generated during trading ranges do not work well during the period of time when the markets are trending. I was able to find one or two strategy that did manage to show profit during the month of November but I could not find 5 or more strategies to add to a portfolio that would show profit during the month of November. I then generated strategies for the first 3 months of 2023, added the top 5 to a portfolio and then looked at how they performed during the month of April. During these four months the market was trending. I found the portfolio did result in nice profit during the month of April.
Note: I used OOS = 30% for January 1, 2023 through March 31, 2023 to have out of sample equal to one month.


Alan,
-
August 25, 2024 at 14:00 #302580Participant
Hi Ricky,
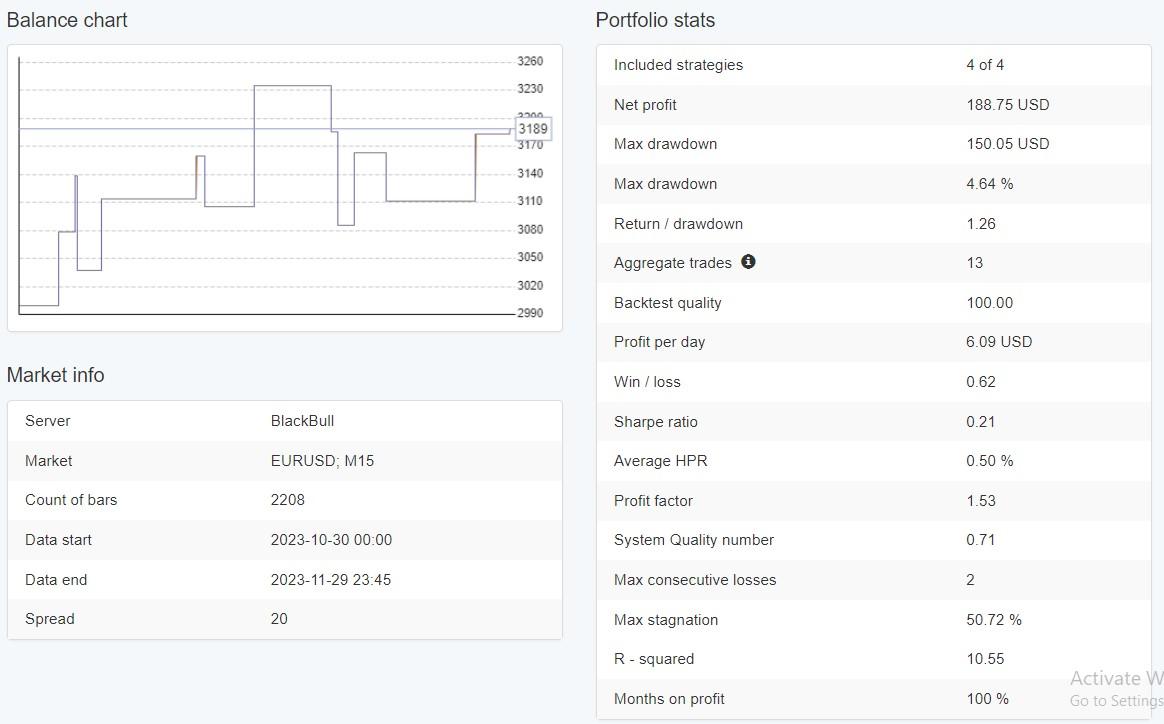
Finally what I did was to generate strategies from October 2018 through October 2023, 5 years for EURUSD. I set the OOS to 30% to see profit for last one year of trading. By using 5 years of data the indicators used have settings that generate profits over the long term which then includes many periods of trending and ranging periods. This is why Petko uses 5 years of historical data when generating strategies. I then looked at profits generated while trading during the month of November 2023. Results show a profit of $188.75 for the month of November 2023 with 13 trades.
What all this testing shows is when generating strategies you need to include multiple periods of trending and ranging markets to create strategies that will work well in future market conditions.
Also by using an OOS equal to one year shows how well the indicators work when actually trading over a future one year market conditions.

Alan,
If you are evaluating EA Studio and have not purchased it yet but has decided to purchase it please use this link to give me credit for your order. Thanks! Alan–
-
August 25, 2024 at 17:45 #302607Participant
Thank you for your effort, Alan. I am sorry that I have already bought the EA Studio so I can also give you a verbal credit here ;). If I do not misunderstand, you suggested my using a longer period for the training and applying the strategies in a longer period. Both of the training period and the trading period should contain trending durations and ranging durations. I will try this approach in my setup to examine the result. Thanks again.
-
August 25, 2024 at 21:39 #302636Participant
Hi Ricky,
You should use a longer period such as 3 to 5 years to generate strategies so as to cover multiple trending and ranging periods. In my opinion the OOS period should be longer than the future time frame you wish to trade before updating EAs. For example if your strategy is to update EAs on a weekly basis then make the OOS period at least 2 weeks. I would also suggest selecting strategies in the Collection that are moving upward on the right edge of their balance line charts. I also suggest using more entry and exit indicators so the strategies generated will execute better trades such as 4 entry indicators and 2 exit indicators. Experiment, try different combinations, see what works best for you.
Alan,
-
August 31, 2024 at 7:39 #303508Participant

Sorry that I have taken a short trip so I cannot respond to your reply promptly.
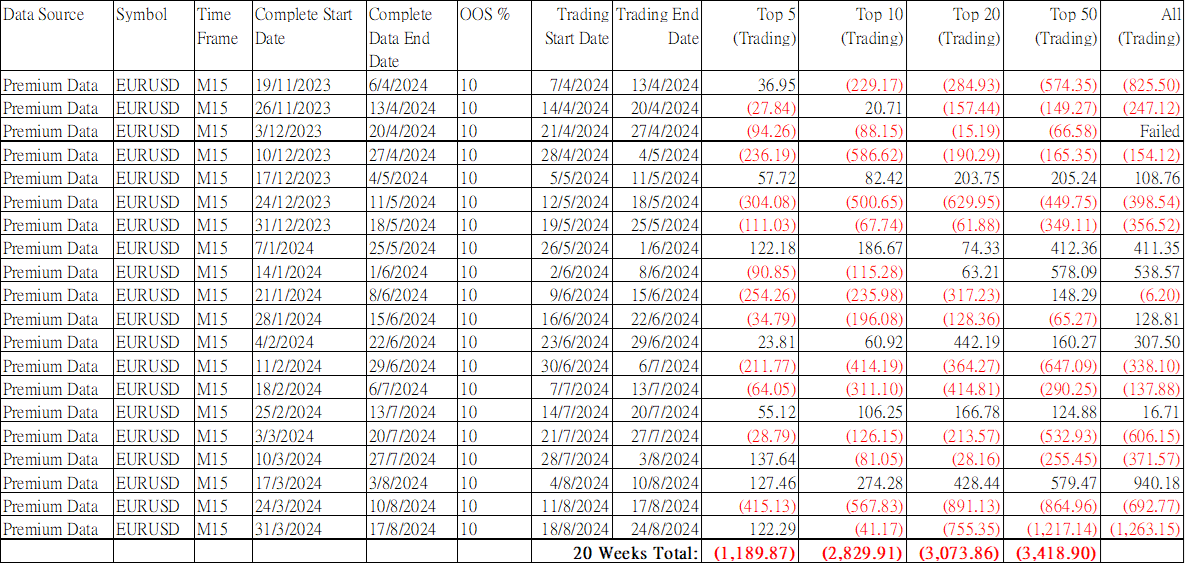
Nevertheless, I tried your suggestions and did an experiment. For the generator, I set the data horizon to 20 weeks and used 10% for the OOS which is about 2 weeks. The max entry indicators and max exit indicators are set to 4 and 2 respectively. For the round 1, I used the historical data of 19/11/2023 to 6/4/2024 (totally 20 weeks) to generate 100 strategies from EA Studio. Then I selected the top 5, top 10, top 20, top 50 and all strategies for trading in the next week. The results are recorded. The same process was then repeated 20 times for the subsequent weeks. The table posted above shown all the recorded results.
I cannot use 3 to 5 years for the generation because it will make the OOS period too long.
You can see that most of the trading results are still losing. May I know if you have any further suggestions to improve the result?
-
August 31, 2024 at 22:25 #303661Participant
When using 20 weeks to generate strategies and then trading for only one week the losing weeks in your table may be a result of the market going through drawdowns. I would suggest increasing your trading time frame to one week, two weeks, and four weeks to see if results improve with longer trading time frames.
Also, generate strategies for 1 year with OOS 10% and then trade for one week, two weeks, and four weeks to see how trading improves with longer time frames.
Also, generate strategies for 2 years with OOS 10% and then trade for one week, two weeks, and four weeks to see how trading improves with longer time frames.
Also, generate strategies for 3 years, etc, with OOS 10% and then trade for one week, two weeks, and four weeks to see how trading improves with longer time frames.
Keep trying different combinations and eventually you will find what works best for you.
Alan,
-
-
-
-
September 1, 2024 at 6:31 #303706Participant
I understand that I can try all the combinations to see which ones are profitable. But I want to know if there is any before starting a full scale testing. My approach is just using the historical data to generate strategies and to use them in the next week or month. It is quite simple and straightforward. May I know if anyone had used this approach to get profit consistantly? If so, could you share the combinations they are using?
-
September 1, 2024 at 6:56 #303708Participant
I am also very curious why the result is so strange. If you generated a group of profitable strategies for the period 1 to period n, you expect that the group of strategies is also profitable in period n + 1. Or at least they are not losing. It seems that this assumption is not true. If the profitability of a strategy in the past is not related to the profitability in the future, what is the point to do backtesting?
-
September 2, 2024 at 7:43 #303849Participant

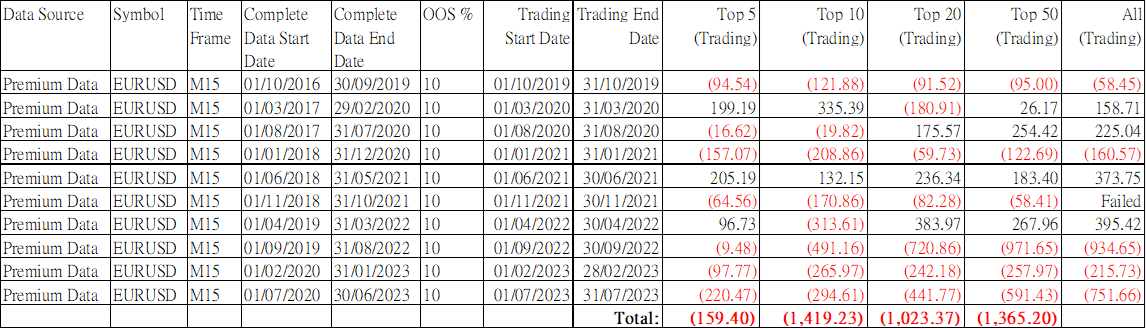
I did another experiment. According to your suggestion, I used 3 years of data for training, 10% OSS and the trading period is one month. To avoid focusing on one type of market condition, I spread the trading periods between 2019 to 2023. The trading periods are separated by 4 months. In addition, I added Monte Carlo simulation for the market variations to increase the robustness. The result is shown above.
It seems that the result has no improvement. Do you know what is going wrong?
-
September 2, 2024 at 15:28 #303996Participant
Hi Ricky,
I don’t know what is going on with EA Studio. I have tried create profitable strategies using your line one dates. I have tried different strategies and nothing works. I use to be able to create strategies and then test them with future dates and show a profit. So I don’t know what is going on. I think you should submit a support ticket about this issue.
Alan,
-
September 2, 2024 at 19:41 #304193Participant
Hi Ricky,
I don’t know if you already saw the topic as to how I actually do my trading. If you follow the replies I posted from the very beginning of the topic to the end you will learn the strategy I use. This strategy got me all the way to an Infinity Forex Fund funded account. This is the trading strategy I found that works best for the way I like to trade. Near the end I show I only had one losing week out of the 12 weeks it took me to hit the profit target and get funded.
https://eatradingacademy.com/forums/topic/ongoing-challenge-10-eas-from-ea-studio/
Alan,
-
-
AuthorPosts
- You must be logged in to reply to this topic.