
- This topic has 3 replies, 1 voice, and was last updated 2 years, 1 month ago by
 Anonymous.
-
AuthorPosts
-
-
October 23, 2022 at 8:49 #127995
 AnonymousInactive
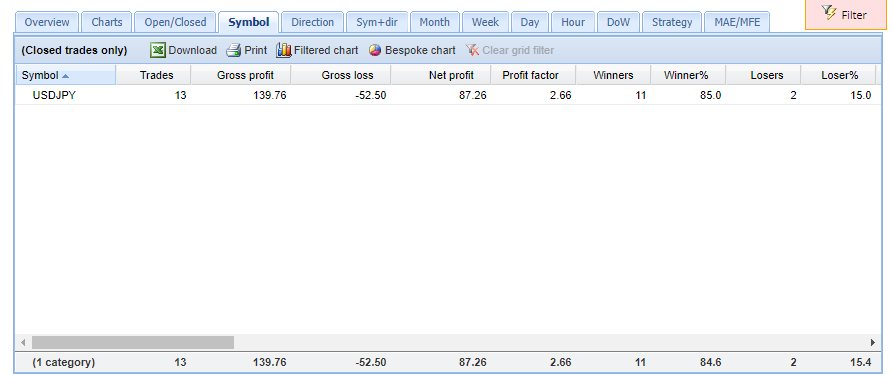
One week trading results 10/09/2022 through 10/14/2022
Premium data updated to show swap and commissions for USDJPY with FTMO broker.
USDJPY portfolio made up of 3 strategies.
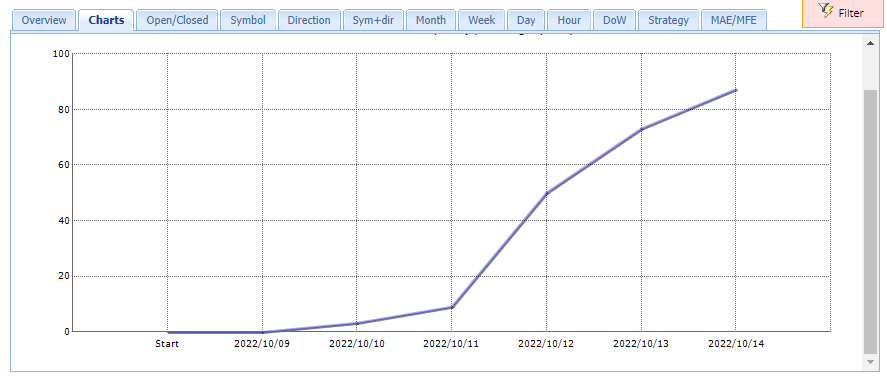
This first two graphics shows FXblue results for the week. It shows a profit of $87.26.


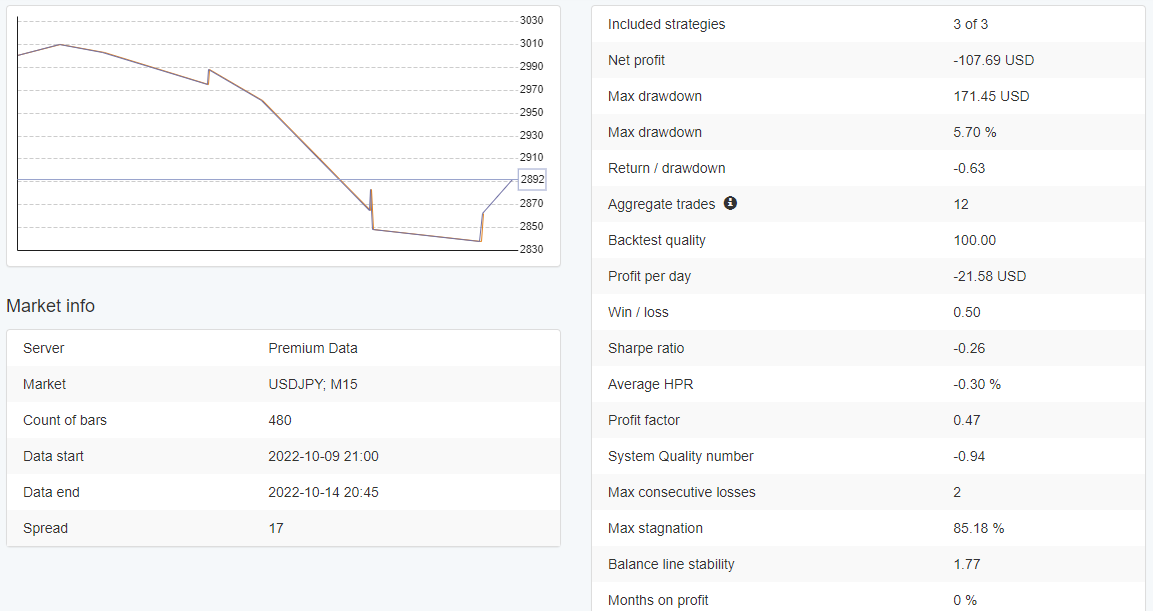
I then copied usdjpy mql4 file from FTMO MT4 Experts folder and entered it into EA Studio with correct data period settings and lot size. The following is the results of the EA Studio Portfolio Tab:

Notice EA Studio shows a loss of -107.69. It looks like negative correlation. How could this be?
-
October 23, 2022 at 9:01 #128737AnonymousInactive
Hey Alan,
This suggests to me that you have not matched EA studio and trading results properly.
Have you watched my youtube video on how to do this? I expect if you follow it though you will get things to match.
However right off the bat I can see that you have not imported your FTMO data into EA studio but just used the premium data. Results shouldn’t be as far different as it is just due to that but instantly shows that this is not a highly accurate comparison. There could well be other subtlties missed also.
The video is currently on Petkos channel under here: https://www.youtube.com/watch?v=z8FF1Uefdpo&t=85s (and there is a follow on couple of videos)
It is moving to my own channel soon so if this link doesnt work let me know and I’ll send you the new link.
Let me know how it goes, if you cant get things to match up after following that video then I will help you further :-)
-
November 6, 2022 at 11:34 #129623AnonymousInactive
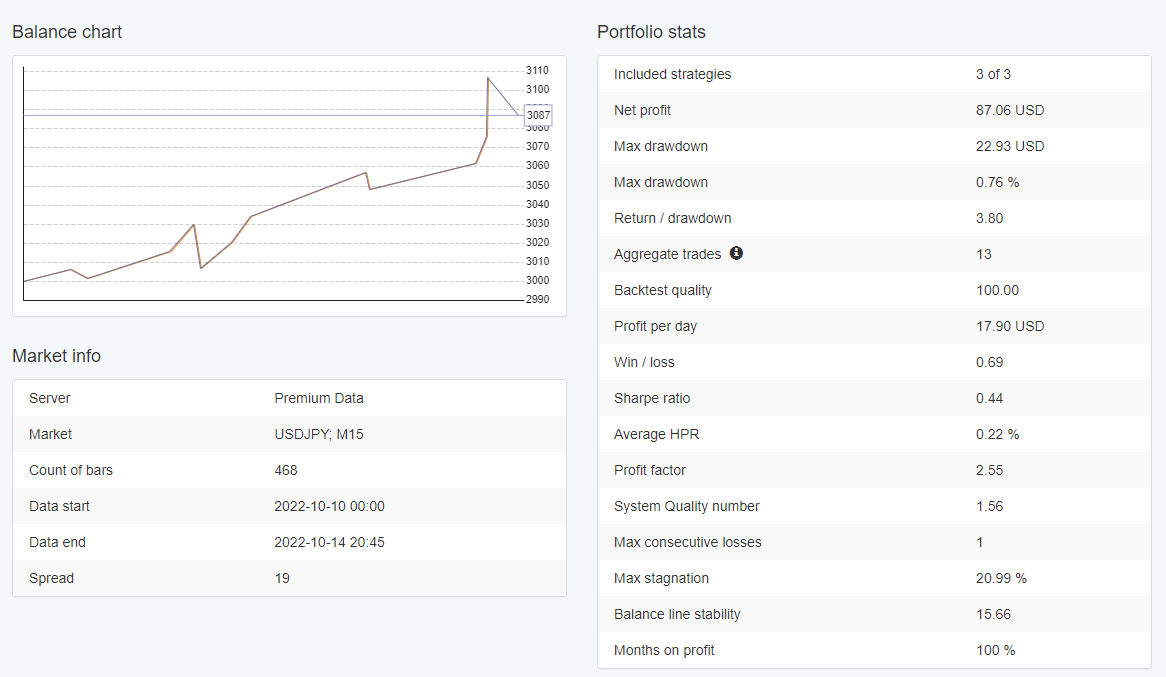
I made some adjustments to match EA Studio and trading results. Net profit now nearly the same, number of trades are the same, and profit factor nearly the same. The Balance chart from EA studio and FXblue do not look the same. However, if I were to smooth the EA Studio Balance Chart I suppose they would look similar. What do you think?

-
November 6, 2022 at 11:50 #130486AnonymousInactive
Hi Alan,
Well done that’s looking much better now.
I wouldn’t be concerned with the equity curve looking a little different, your profit and profit factor look close for real vs backtesting results and I’d be more concerned with checking the time of the trades and total count etc which I expect you will have done if you followed my video?
looks like a sufficient comparison to me
-
-
AuthorPosts
- You must be logged in to reply to this topic.