In this lecture, I will share with you a simple Bitcoin trading strategy for beginners and I will explain what is the idea of this BTC strategy. You will see how simple it is. Moreover, I will show you how it’s proven, I will show you what is the backtest of the strategy, or in other words, I will show you all the entries and the statistics for this Bitcoin trading strategy. So you will be really surprised by how one simple Bitcoin trading strategy could be so profitable and easy to apply.
Table of contents:
Bitcoin trading strategy example
So this is the Bitcoin on the hourly chart, and for beginners, this means that one candlestick or one bar represents one hour time. Whenever we have a green candlestick, it means the bar is positive or the hour is positive, when we have a red one it means it is a negative bar.
It opened at one price and then it closed the hour on a lower price and it formed a negative candlestick. With the positive candlestick, it’s the very opposite thing. It opened at one price, went up and down during the hour, and it closed at a different price. So it formed a positive candlestick.
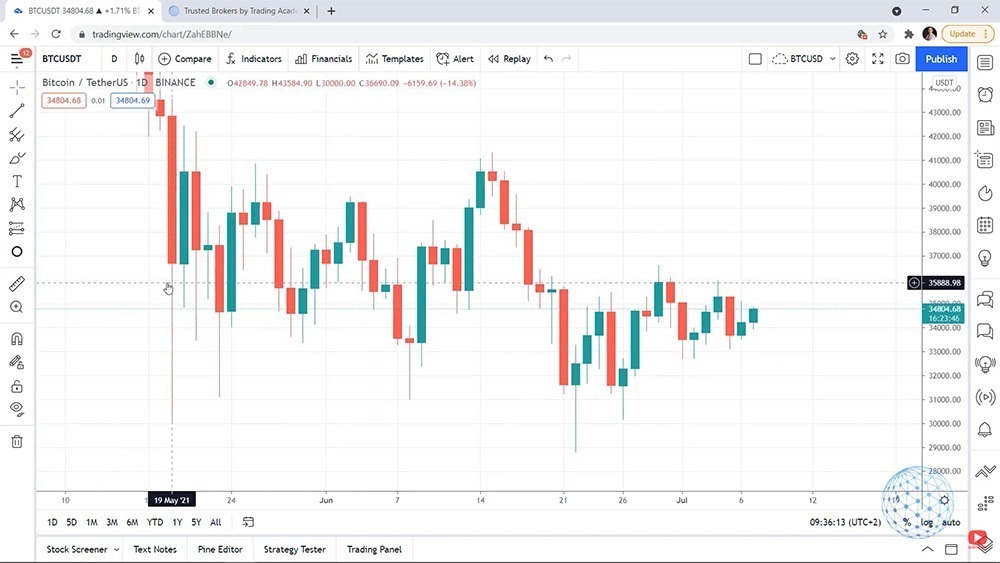
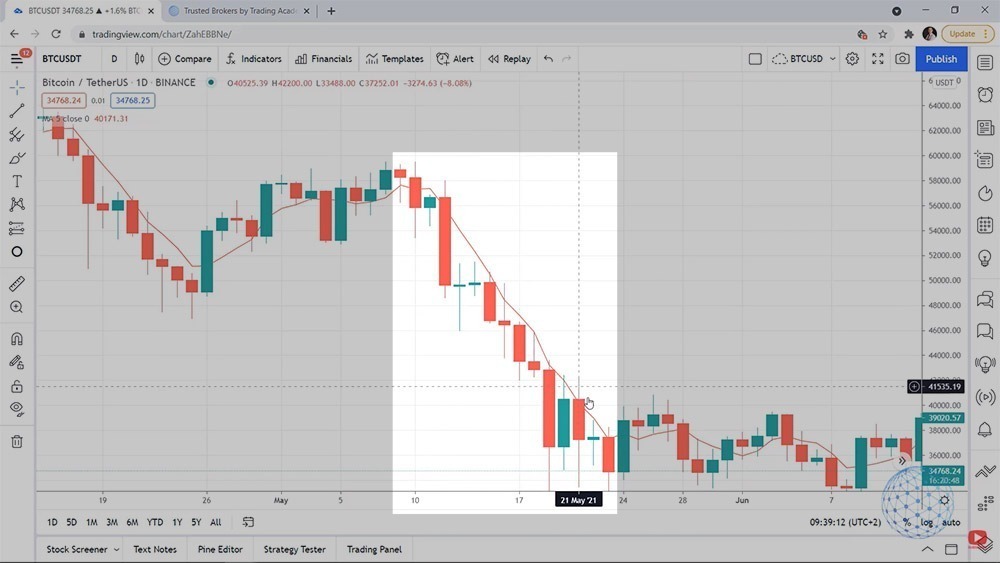
Now, the Bitcoin trading strategy that I will show you applies on a daily chart. And if I zoom out the chart, you will see that Bitcoin recently after the drop in May 2021, it’s been not easy for trading because it’s just going sideways, up and down.
And if you don’t have a strategy such as the one I will show you, it is really hard to decide when you have to buy, when you have to sell, and many people lose their money exactly on such market conditions.
Using the Moving Average trading indicator
So now I’m on the TradingView website, on a daily chart, which means that one candlestick represents one day time. And again, we have positive and we have negative candlesticks.
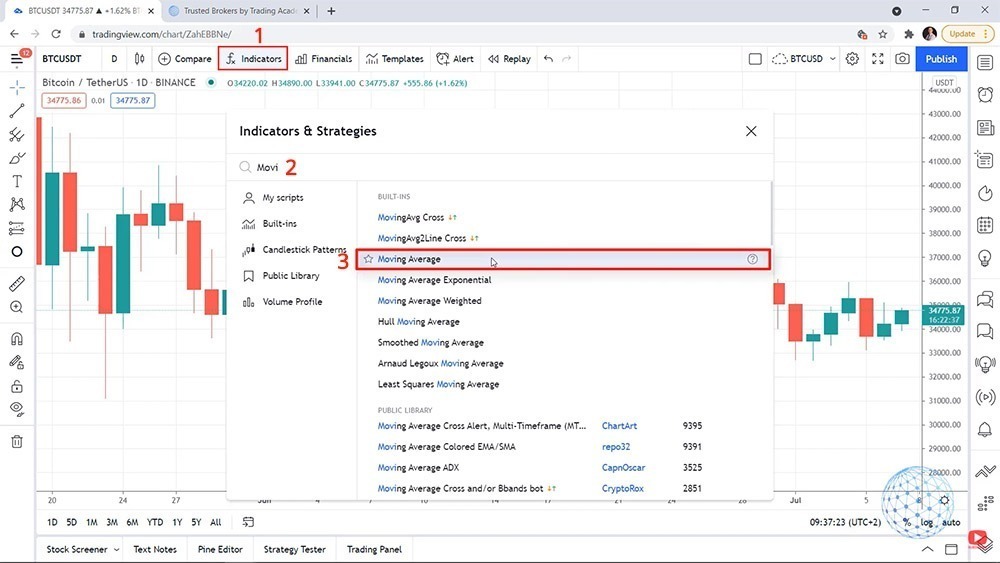
Here is the Bitcoin trading strategy. I will add an indicator called Moving Average. And those of you who have experience in trading know this strategy for sure. Moving Average is probably one of the first indicators out there at its super easy to apply it and use it.
I will navigate to Indicators and start typing Moving Average and I will click on the indicator. And what happens, I see one line over the chart and this is exactly the Moving Average.
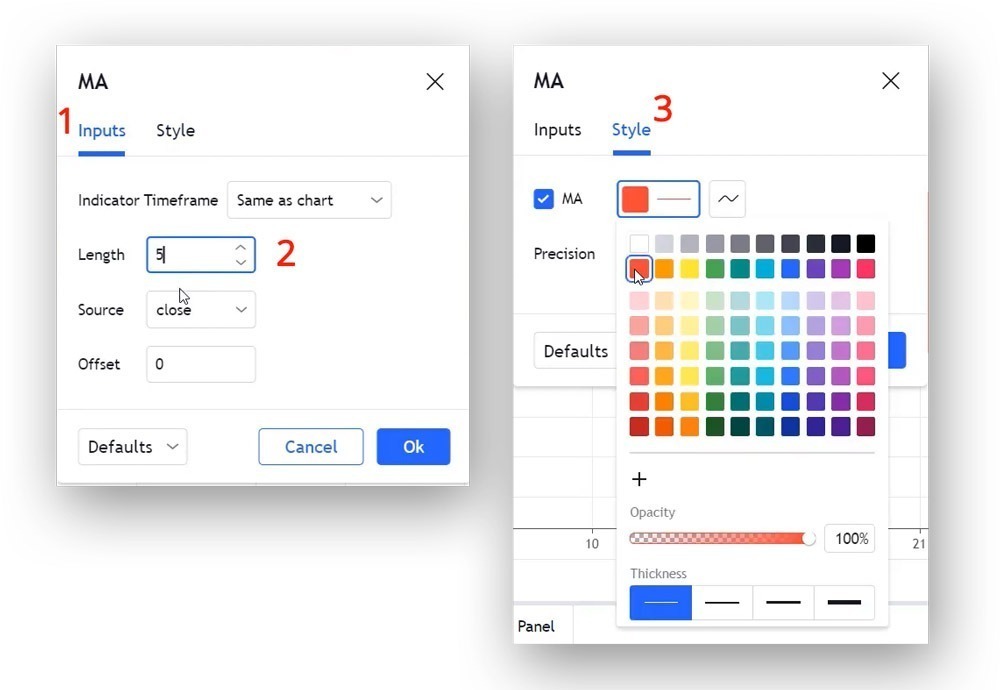
So for this Bitcoin trading strategy, I will click on the Moving Average or on the line, and I will go to More (the three dots), and I will click on Settings.
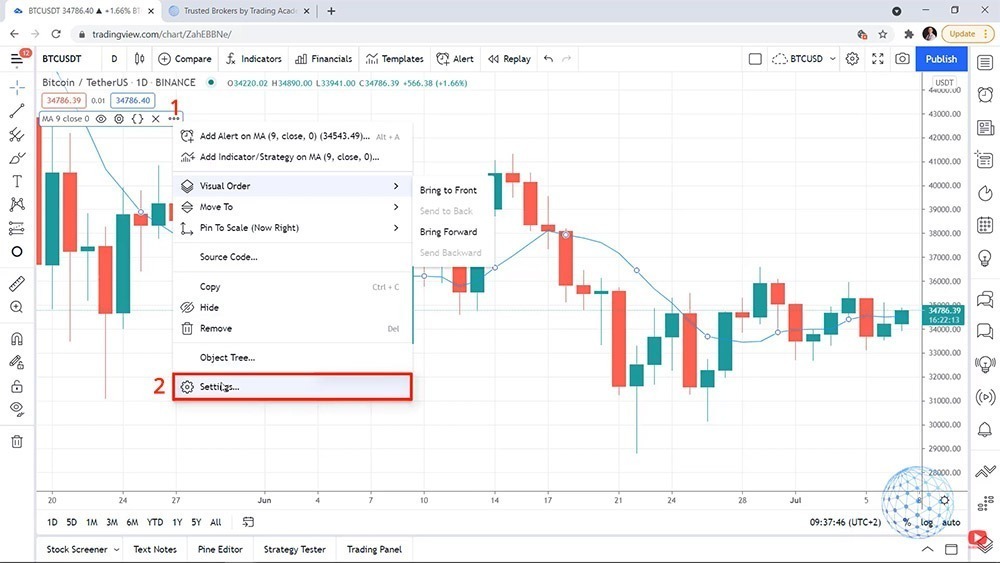
So here I will tap on Inputs and I will set the length to 5. Later I will tell you why I know this is the number I need to use. And then in Style, I will just make it probably red to be more visual.
So what is the Moving Average doing? It makes the chart smoother. You can see the prices going up and down, but when we have a Moving Average, we see clearly a direction.
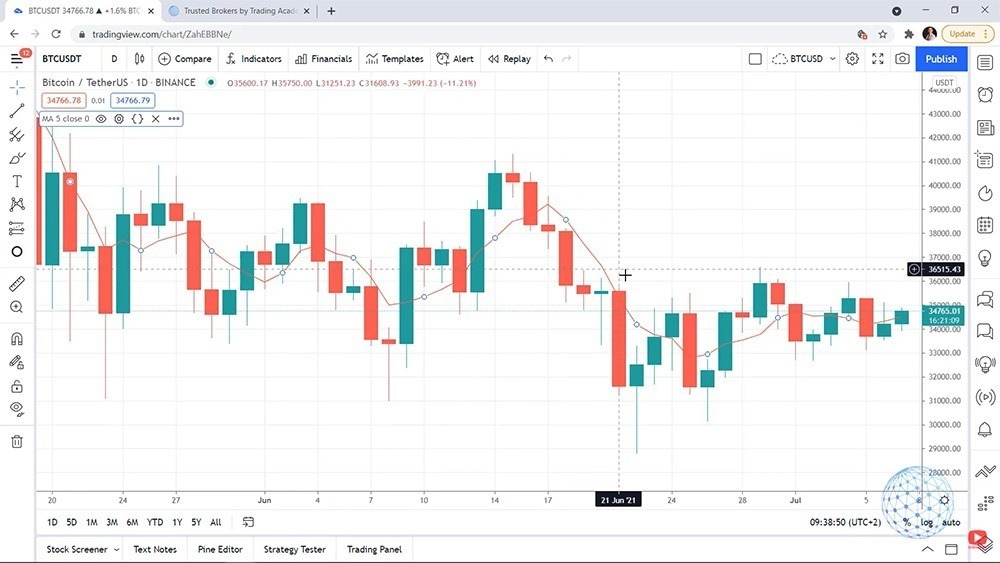
And if I scroll earlier when the market was very bearish, back in May 2021, you can see a very clear direction with the Moving Average. It was falling, then it was rising, then it was falling. So the Moving Average makes the trading chart very easy to read. You just have a line that follows the price.
What is the Bitcoin trading strategy?
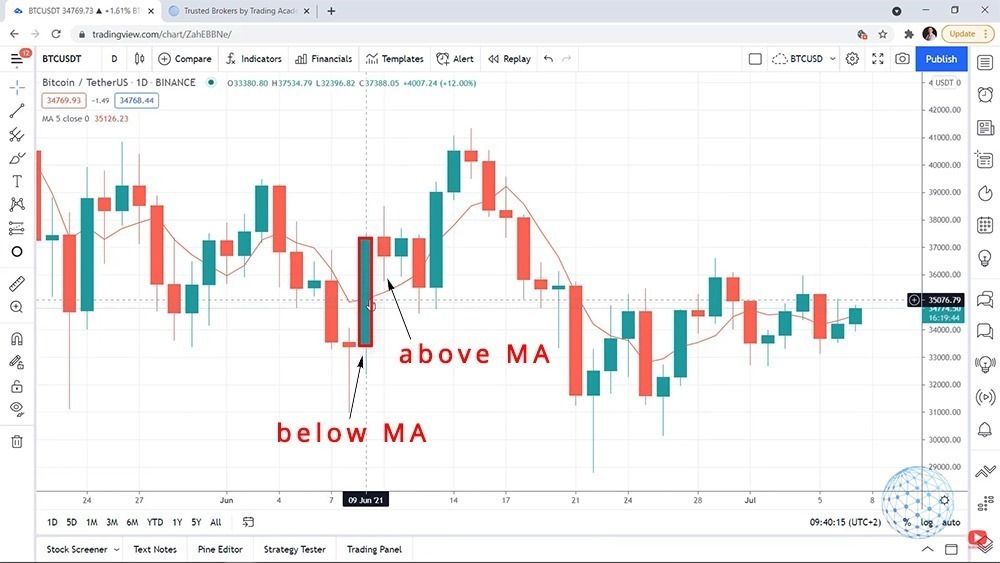
We have a buy signal whenever the daily candlestick opens above the Moving Average.
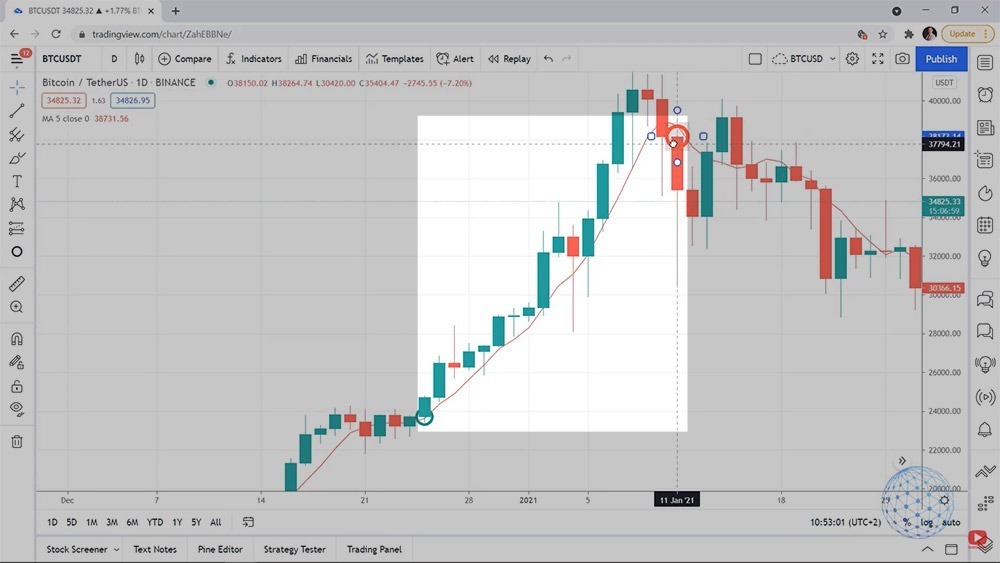
So, for example, in our Bitcoin trading strategy, the positive bar from the bottom image opened below the Moving Average, but the next one opened above the Moving Average. So here is our buy signal or our entry where we have to buy Bitcoin.
Now, let me place a circle on the trading chart and I will put it on the opening of the bar. This is a red candlestick, which means that the opening is on the top of the body of the candlestick. And if I put the mouse on it, you will see exactly the 4 values – open, high, low, and close. So the opening of this candlestick, for example, was at 37,388.05.
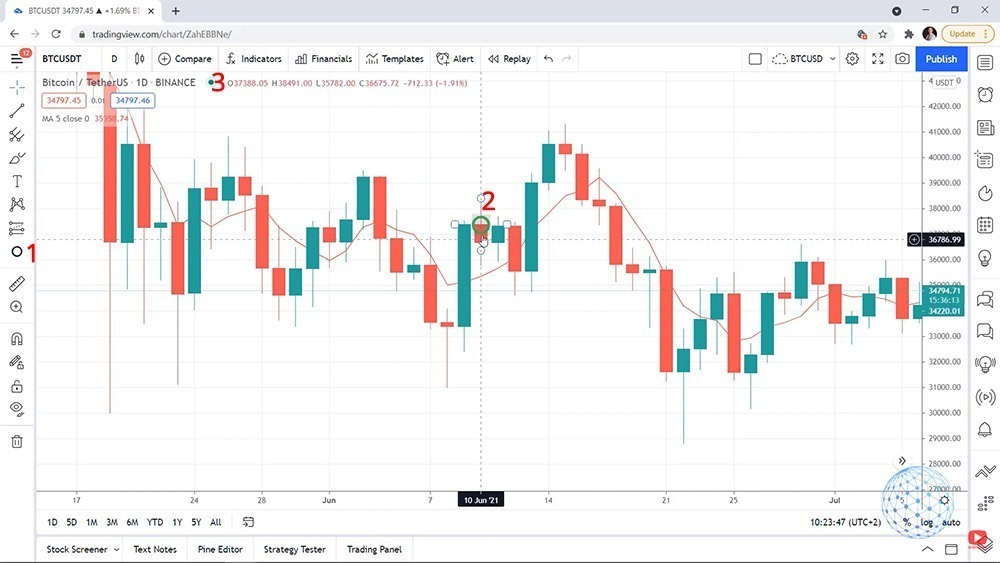
So let me zoom in on the Bitcoin trading strategy chart so you can see it clearly. We have the entry on the opening of the first candlestick that opens above the Moving Average. So the price was below the Moving Average, it went above, and on the next candlestick, on the opening, we have the entry.
Now, what happened very shortly after that, in 2 days time, the price went below the Moving Average and it opened below. So what we do here, we have to sell. And you will say, ‘Alright, but this will be a loss.‘ We’ll be buying approximately at 37,376 and selling it at 35,597. And yes, that’s true. If we buy where’s the green circle and we sell it over where’s the red circle, this will be a losing trade. But stay with me because we will eliminate such trades. And let’s follow along.
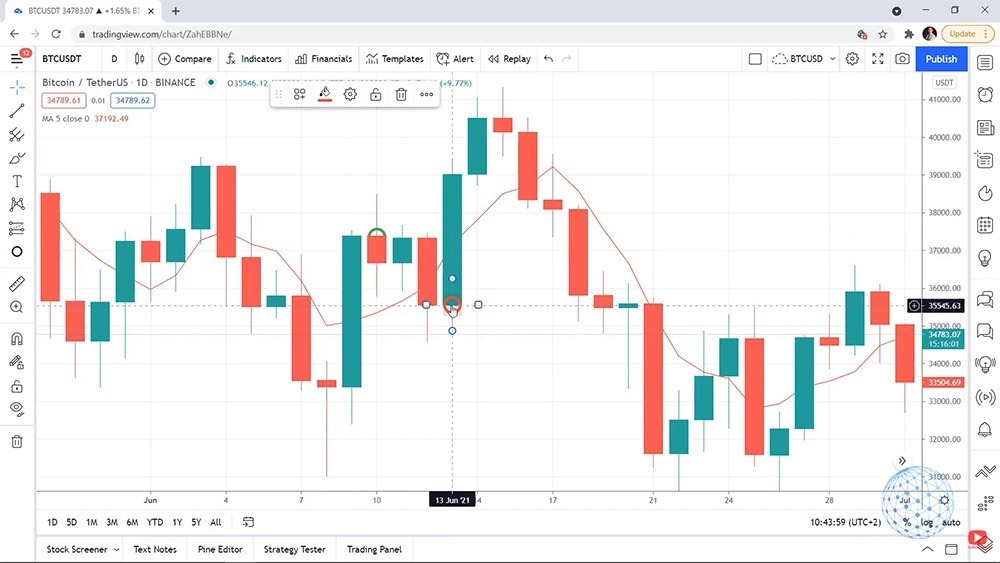
Then the price went up and then it went down. When it went up, you will see on the bottom image that we have a new bar that opened above the Moving Average. And then when the price went below on the opening of this bar, we have the sell signal. Is that right? That’s right. So, again, we have a loss. And I selected these examples because I wanted to explain the Bitcoin day trading strategy.
It is that simple. And I wanted to show you that there are actually losing trades.
If I keep doing that you will see that we have more losing trades. And why is that? This is because we are in a downtrend.
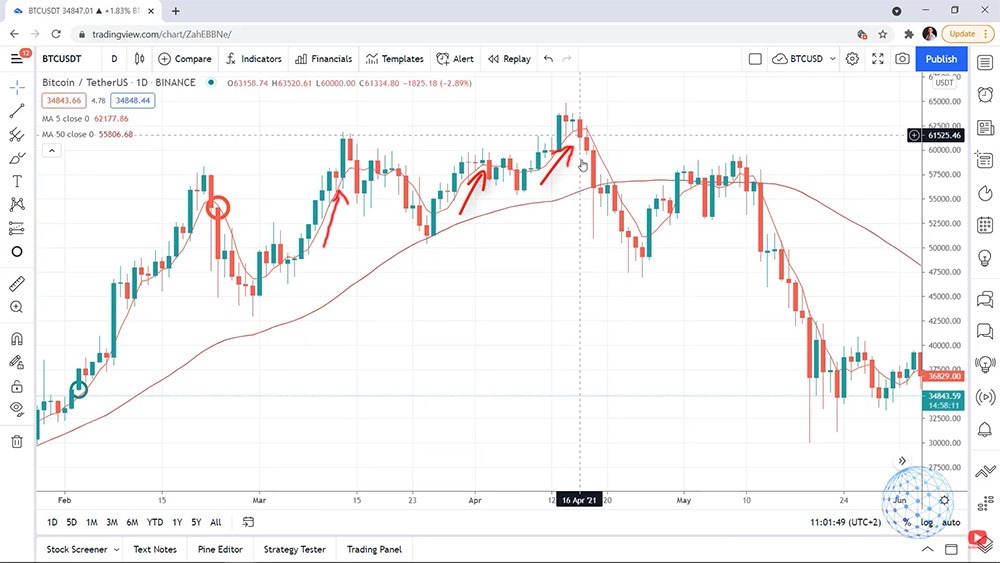
And if you zoom out the Bitcoin trading strategy chart, you will see clearly the price going downwards from the mid of April. Before that, it was going upwards. And if you zoom the chart when the price was going upwards, you will see something totally different.
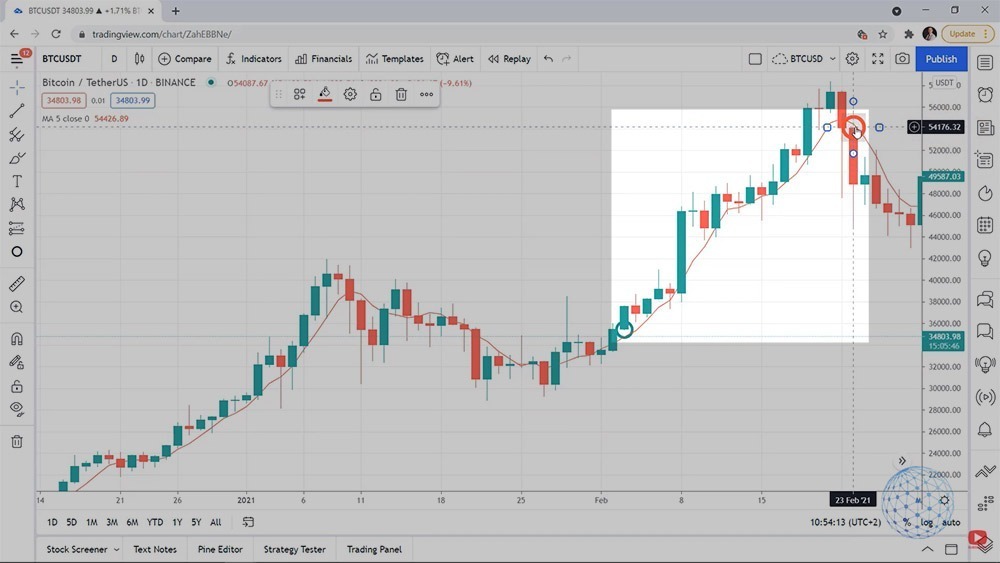
We have the entry signal whenever the price breaks the Moving Average with a period of 5, and on the opening of the first candlestick, we have the entry. And then where is the exit? It’s right over here, with this candlestick. I will make it red. So here is the entry, here is the exit. We buy at somewhere 18,800 and we sell at 22,700.
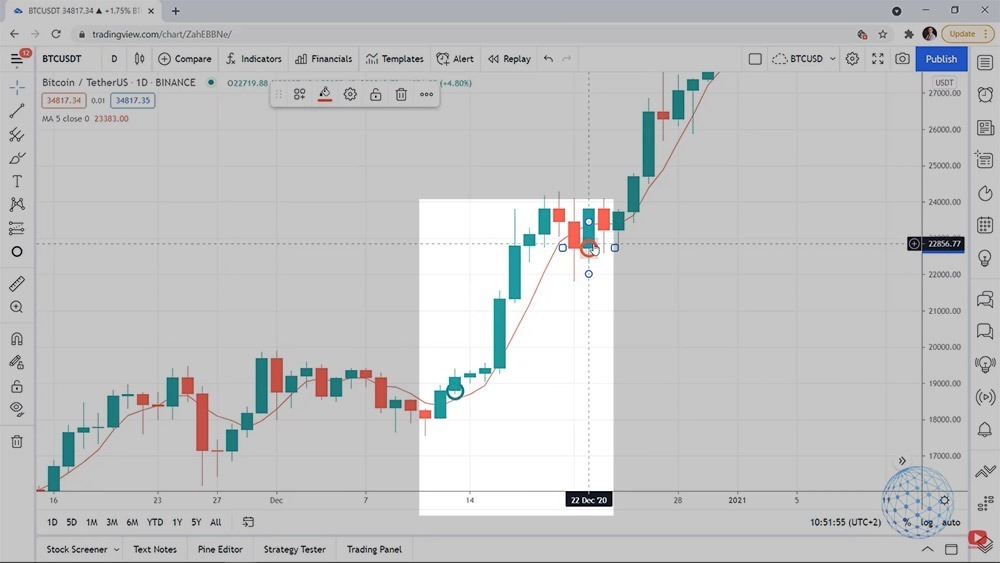
Then we have a small losing trade that opens where we should be buying at 23,800 and sell it at 23,200. But then when the candlestick opened at 23,700 and something, our exit is way up higher. I will show you exactly where it is on the Bitcoin trading strategy image below. So we would be buying at 23,700 and something and sell it at 38,200. So you see what a profitable trade is over here.
Are we in an uptrend or a downtrend?
And now comes the question, how do we filter if we are in an uptrend or we are in a downtrend? In the Bitcoin trading chart, you can see the price going downward. So you will be having some losses. And then again, you will have some amazing trades.
And if I have to be precise, right over here, we have the bar that opens above the Moving Average at about 35,500, and we should be selling it at about, what is it? $54,000 and something. So you see how the Bitcoin day trading strategy catches these nice movements.
But how do we filter if we are in an uptrend or we are in a downtrend? Simply, I will put one more indicator which is Moving Average, but with a period of 50. I can choose whatever color I want, but I will just make it dark red. And you can see that this 50 Moving Average shows the direction of the trend for this Bitcoin trading strategy for beginners. And when the 50 Moving Average goes upwards, only then we are buying using the 5 Moving Average.
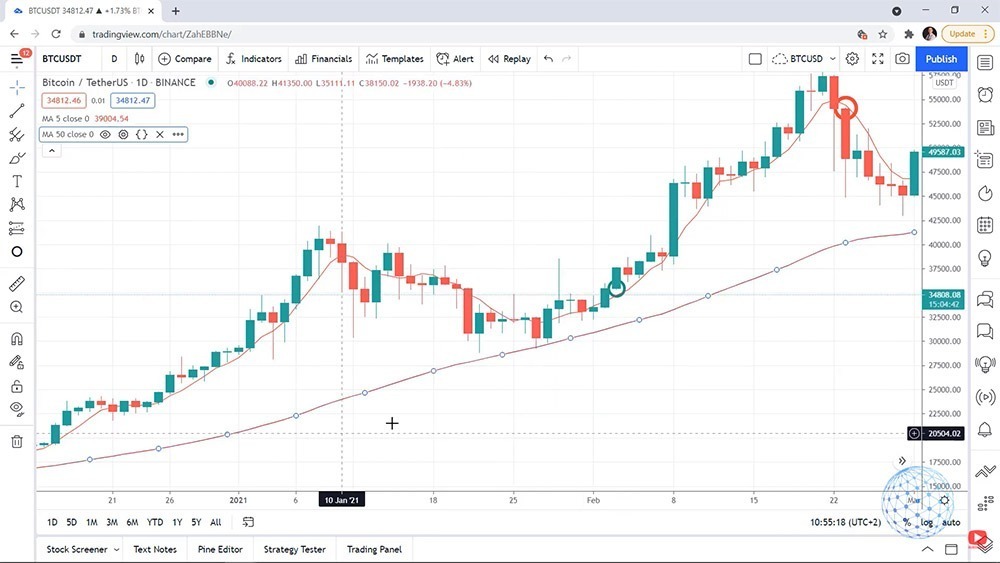
So if I scroll the chart again to the right side, you will see that the 50 Moving Average after the beginning of May changed its direction downwards. So all of the losing trades at that time, we are not buying them because the 50 Moving Average is showing a downtrend.
And the two Moving Average lines look different very because they are calculated based on different periods.
The 50 Moving Average uses the last 50 days, or if I have to be precise, the closing prices of the last 50 days, and it summarizes them and then divides them by 50. So it gives us the average price for the last 50 days. And the 5 Moving Average uses the average closing price of the daily candlesticks of the last days. This is why the 5 Moving Average goes closer to the price, while the 50 Moving Average is lagging after the price but it shows clearly the trend.
You can see it very clear that for some time the price was going down and then from 9th of October, 2020, when the price was at about $11,000, very clearly, we are in an uptrend up until May 2021 when the 50 Moving Average changed its direction downwards.
So if you are using an exchange and you want to use this Bitcoin trading strategy, all you have to do is look for the 50 Moving Average to be rising in order to look for the entry signals when we have the price going above the 5 Moving Average or to look for a candlestick that opens above the 5 Moving Average and then to take the profit when it goes below the 5 Moving Average.
And then you can see that we will be taking profits many times.
Using the Bitcoin trading strategy when 50 Moving Average goes down
You might say, ‘OK, but when the 50 Moving Average is going down, we are not doing anything and we are not trading.‘
The thing is, you can be trading when the price is going down with the trading brokers. Some crypto platforms allow that but with simple words, it is called CFD or Contract For Difference. I will explain how it works very shortly.
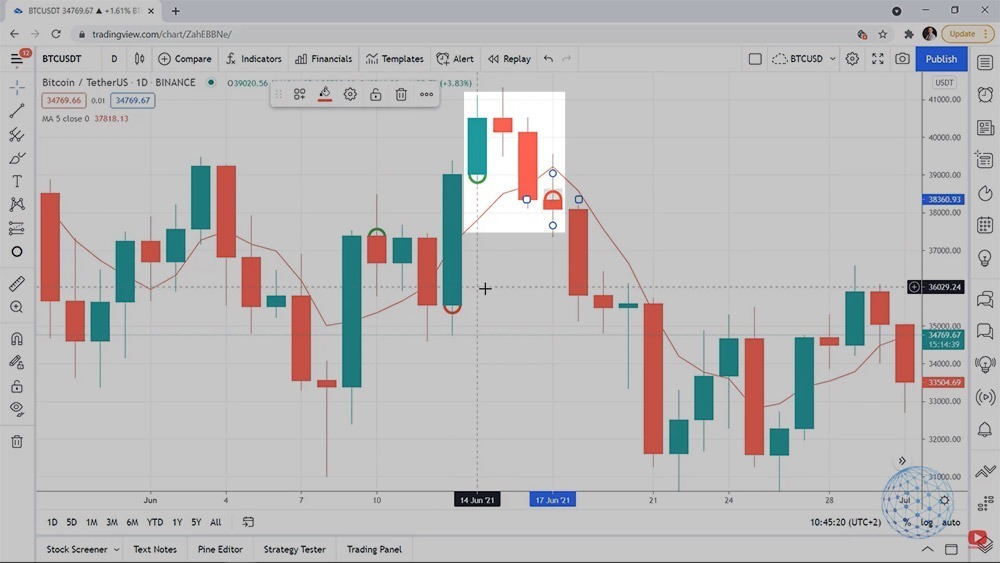
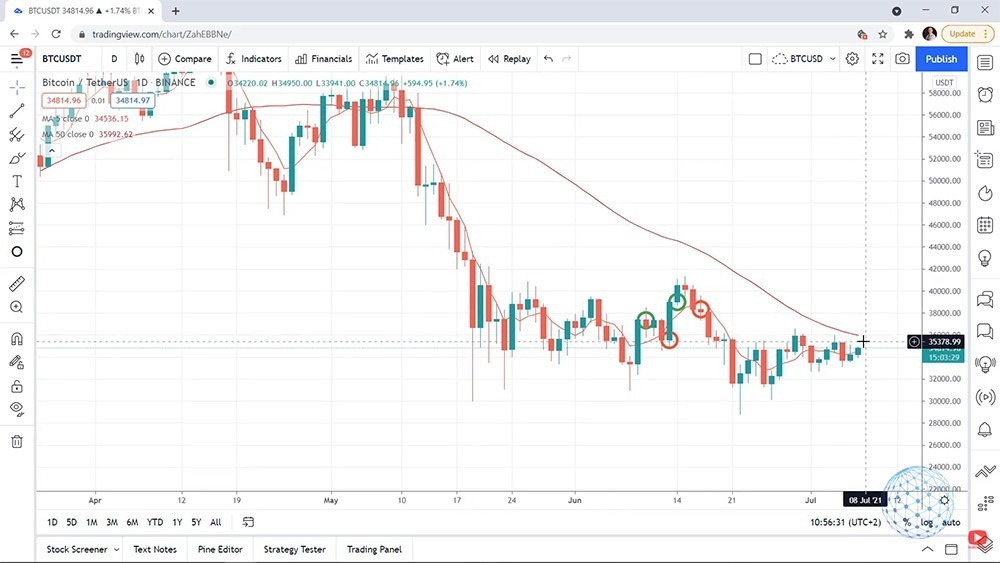
Let’s imagine that we sit on the computer on the 17th of June 2021, and we see that we have a bar that opens below the 5 Moving Average. At the same time, the 50 is going down which means we have a confirmation to sell. And instead of exit, this is our entry or this is where we will be selling Bitcoin vs. USD and we will be taking our profit on the first bar that opens above the Moving Average, which is right you can see on the bottom image.
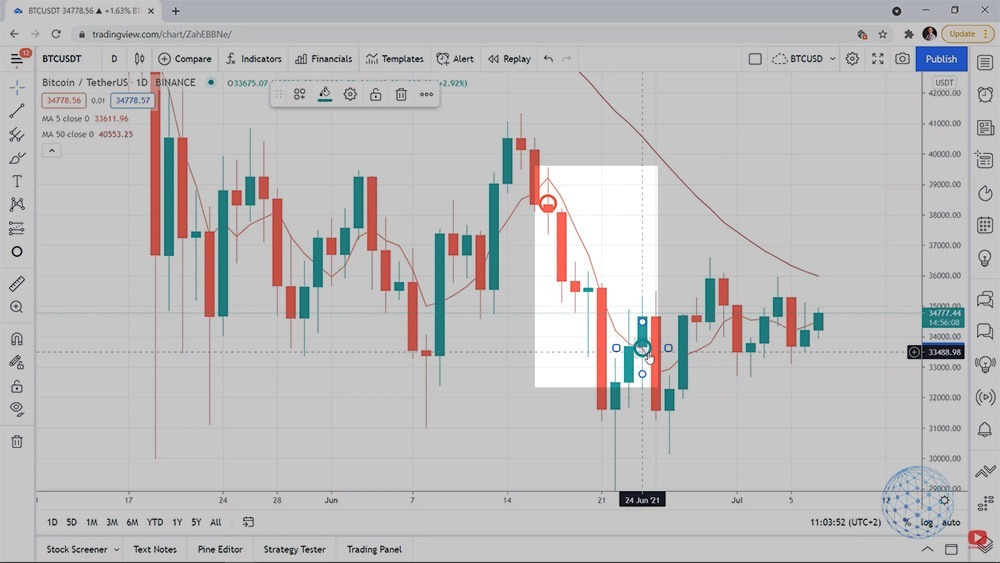
So we will be selling it here and we will be taking the profit right over here, which is a move of $4,000 and something. So when the 50 Moving Average goes down, we can sell the Bitcoin and make a profit on a lower level.
And for beginners, I know it’s complicated. You might ask immediately how I’m selling the Bitcoin if I didn’t buy it previously. This is the CFD trading, which stands for Contract For Difference.
So some brokers allow that. And there, you can fund an account. Let’s say you fund an account with $50,000, for example. You can sell one Bitcoin, and when the price goes down, you can close the position and benefit from the difference. This is why it’s called CFD trading. Of course, if the price goes against you, then you will be handling losses in your account. It’s very similar to short-selling in stock trading.
So simply put, you are trading on the value of the asset and you are not owning the Bitcoin at this time. You are owning Bitcoin only when you buy it from the exchange or from the wallet and you keep it in your crypto wallet and you have it.
When we are trading with the Expert Advisors, we are doing both. We are buying it and we are selling it. So we are trading all the time. We are taking all of the opportunities out there.
Bitcoin trading strategy overview
So to summarize it, I don’t want to make the lecture complicated because it’s really a simple Bitcoin trading strategy. But I tried to explain it as simpler as possible.
When the market is going up, we follow the 50 Moving Average to confirm that we are in an uptrend. Then we are buying using the 5 Moving Average. And when the market is going up, you can use exchanges to buy Bitcoin and sell it at a more expensive price to get some profits. At the same time, you can use the brokers with the CFD trading that I explain.
Now, when the market goes down, we can sell using the same Bitcoin trading strategy, but we can do that using CFD trading and we are taking the very same signal but on the opposite side. When the bar opens below the 5 Moving Average, we are selling it. And when another bar opens above the Moving Average, we are closing the position to take the profit.
So when the market is positive, you can apply this Bitcoin trading strategy easily on the exchanges and with the brokers. And when the market is negative, when we are in a downtrend, you can apply this strategy with the brokers and the CFD trading.
And, one more time, some of the crypto platforms allow selling the Bitcoin even without owning it previously.
How to check the BTC trading strategy performance in the past
So how do I know if this Bitcoin trading strategy is actually profitable or it’s losing? Is it making money in the long-term or is it losing money?
In trading, and especially when we use strategies and Expert Advisors or the so-called robots, we have the backtest. The backtest shows us what is the performance of a certain trading strategy in a past period.
And there are a variety of tools, platforms, where you can perform backtests. You can do a backtest on MetaTrader as well. But what I use as a professional trader, and because I do this full-time for quite a long time now, I use professional software.
And before I show it to you, I know many are wondering, ‘OK, why do we need to have a backtest and the software, is a simple strategy? It’s very clear where we buy, we have the confirmation of the 50 Moving Average, we have the 5. We see over the chart where the entries are very clear.‘
But wait, maybe somewhere in the chart, we have an opening below the 5 Moving Average? If I zoom in, it really looks like the candlestick on 8th February 2021 opened below the 5 Moving Average. The entry is there and I said that the exit is when we have a candlestick opening below the Moving Average.
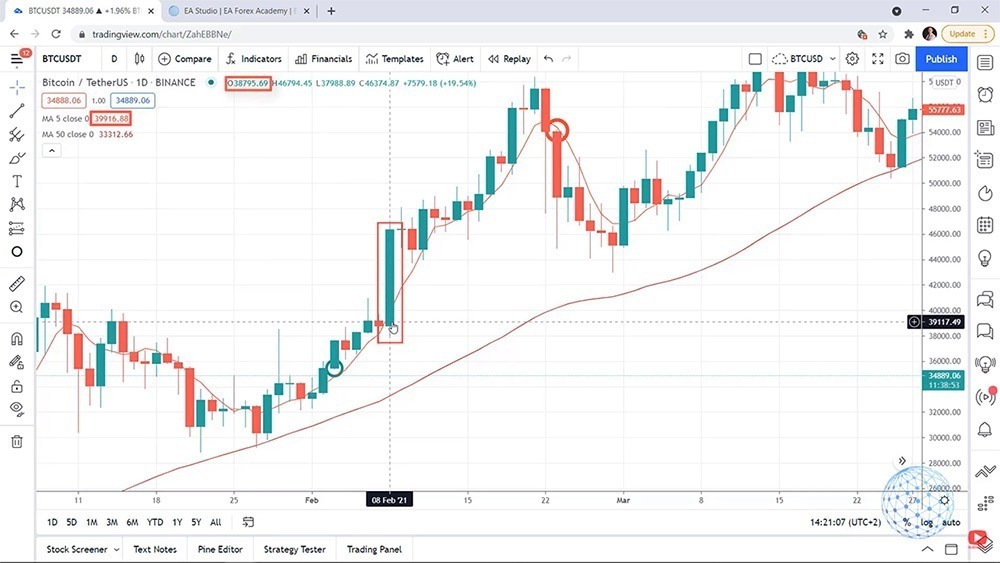
And if I put the mouse on it, you will see that the opening of the candlestick is 38,795.69, and the 5 Moving Average is 39,916.88. So the opening is below. But pay attention here, this value for the Moving Average is on the closing of the day, not on the opening.
So I don’t know, actually, looking at the chart, what was the Moving Average value at the opening of the candlestick at the beginning of the day.
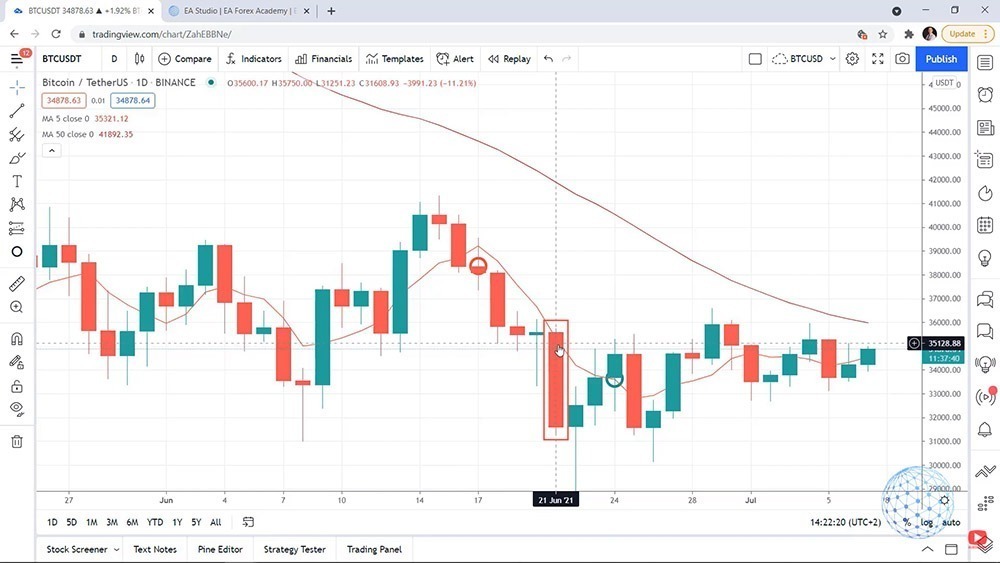
The same thing with the below recent example where I said we can sell the Bitcoin. On the 24th of June, we have the sell. Very clearly, the candlestick opens below the Moving Average, the price goes down, and there is the exit. But what about the candlestick on the 21st of June? Did it open above or below the Moving Average?
The opening is at 35,617, and the 5 Moving Average value is 35,321.12 which shows that the opening was above the Moving Average. Because if it’s above, we should be closing the trade here and not 3 days later. But again, this value for the 5 Moving Average is on the closing of the day and not on the opening. So again, I don’t know when this candlestick was starting and what was the value of the Moving Average.
And this is why looking back over the chart this way could be really misleading when you are using indicators. And many traders and mentors are building their strategies, recording complete courses and videos over the chart and saying, ‘Oh, you should be buying here, you should be selling there, buying here, selling there.‘
That is completely wrong because the indicators are repeating. They are lagging behind the price and especially when we have a small Moving Average like 5, the value of the Moving Average changes all day long.
So at the current moment, by the time I am recording, we can see that the price is 34,556.75, but it’s changing. It was one value at the opening of the day and it will be a completely different value at the closing of the day because it’s changing.
When the day closes and the new candlestick starts, then we will have a confirmed value, just like what we have with the candlestick from the 21st of July. The confirmed value for the Moving Average is 35,321.12, but this is after the day closed.
And this is where a lot of traders make a huge mistake building strategies based on what they see in the past. Because in this example, we don’t know what was the value of the Moving Average when this day was opening.
The backtesting software
So let me show you the software and you will get a better idea of what I’m explaining.
I will go to our website, and in the menu, you can see Software. And here, we have 3 trading software integrated – Expert Advisor Studio, Forex Strategy Builder, and the Historical Data app from where you can download free historical data for any asset.
It’s useful when you’re doing backtests, it’s useful for many things. You can download the data completely free. No registration is needed, no strings attached, nothing. You can download the data for many assets. We have as well Bitcoin and Ethereum here, commodities, indexes, Forex pairs, and you can download it in different formats as well.
But what I want you to focus on is the Expert Advisor Studio because this is where I will show the strategy.
EA Studio is professional trading strategy builder software. There is a free trading course for the software on the front page that I have recorded. And personally, I’m using this software daily. It comes with 15 days free trial if you want to give it a try, generate strategies, backtest strategies, and export them as ready robots.
So basically, this is the idea of the software. I’m not going into details. It’s not the purpose of the lecture. I will click on Strategy and you will see exactly the BTC trading strategy I’m talking about in this lecture. The idea of the software is that with one click, we can export it as a ready-to-use Expert Advisor for MetaTrader 4 and for MetaTrader 5. Or in other words, with one click, we can have the robot, the code for the robot.
So we don’t need to hire developers, we don’t need to understand programming, the software does it really automatically with one click. And it’s much more for the software, but, one more time, not the purpose of this lecture. I’m not going to explain it in detail, there is a free course on the front page which you can have a look at if you are interested.
Backtesting the Bitcoin trading strategy
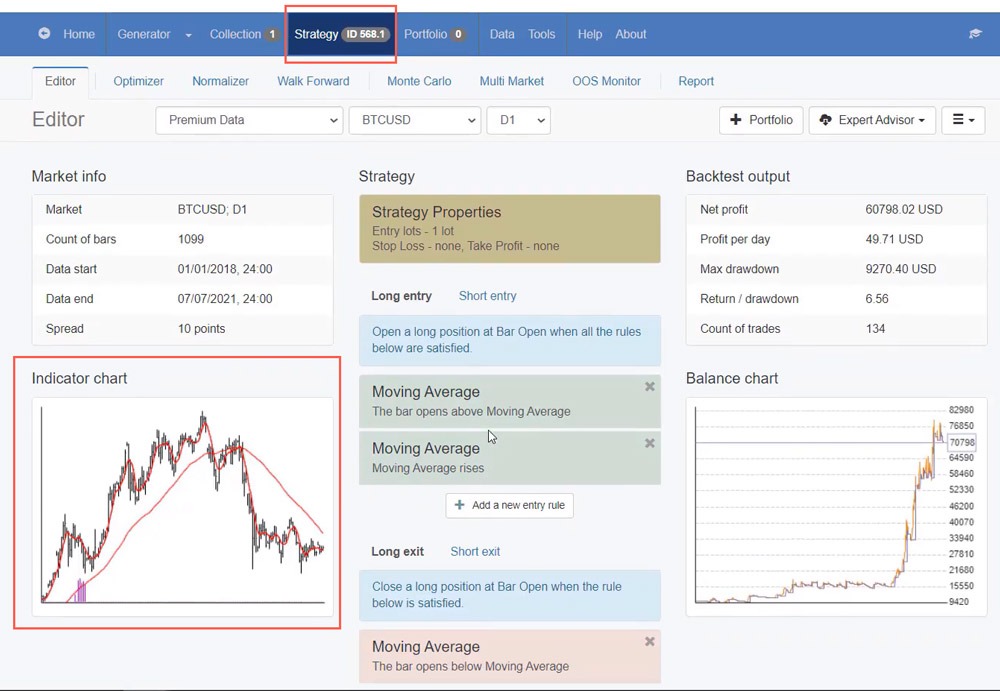
Now, what I want to show you here is the Bitcoin trading strategy that I have explained so far.
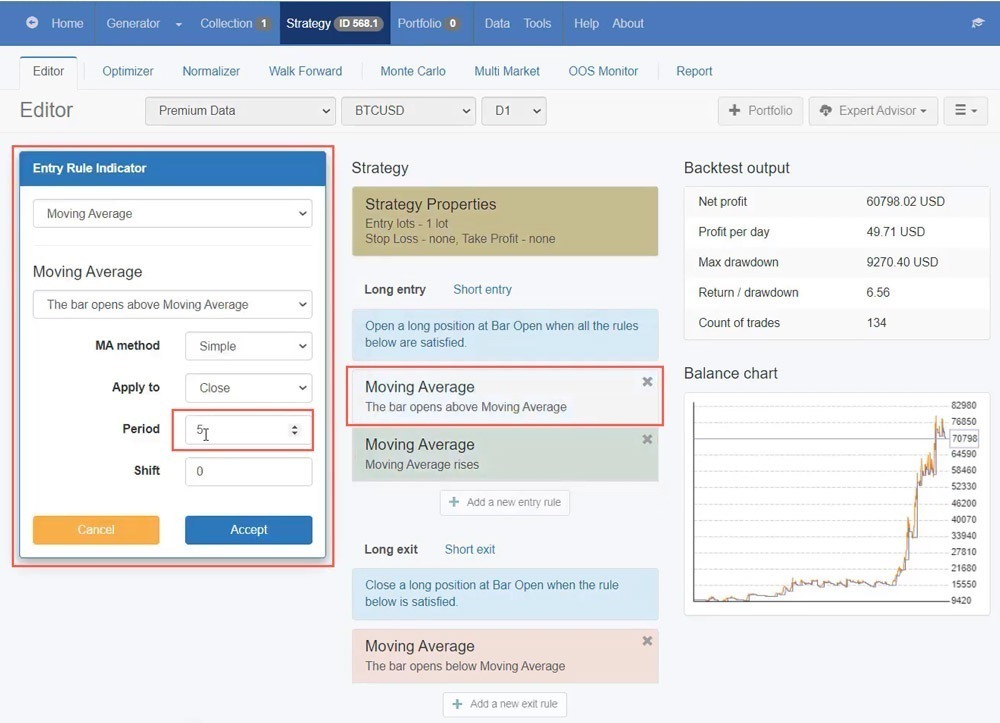
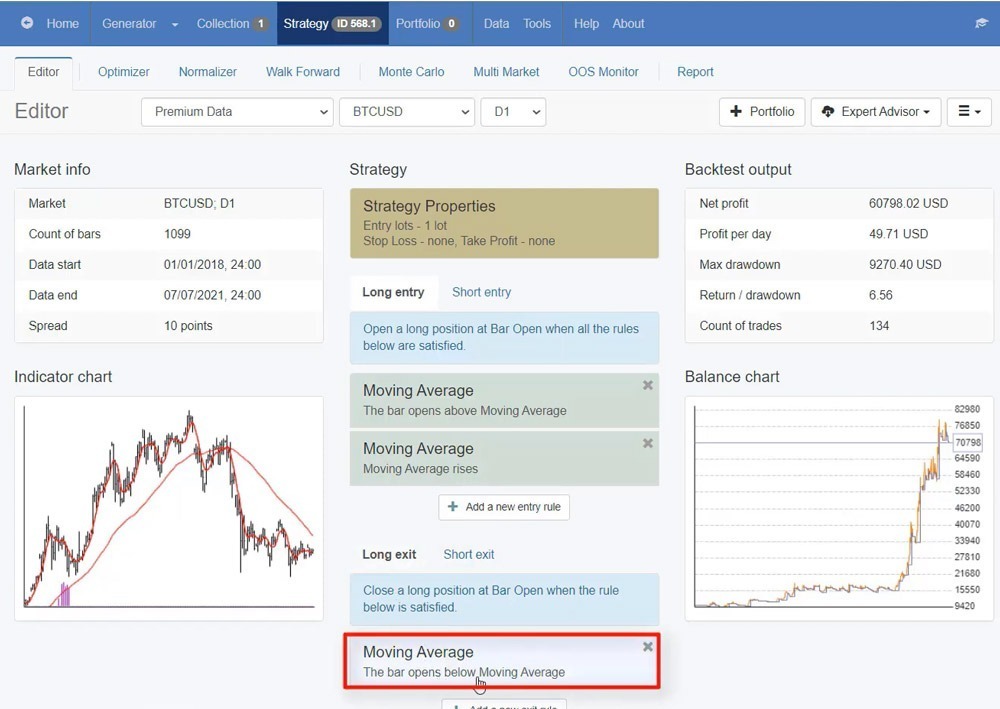
So we have the entry conditions here. You can see that we have Moving Average with a period of 5, with the condition, the bar opens above Moving Average. And if I change the period, for example, if I increase it to 6, immediately, I see the difference in the balance chart. Let’s increase it to 20, you see that there is a difference. Actually, the BTC trading strategy became worse.
So I’ll bring it back to 5, I’ll click on Accept. And actually, the Balance chart is the result or the backtest of the Bitcoin trading strategy. And you can see that the backtest shows that the strategy was profitable so far.
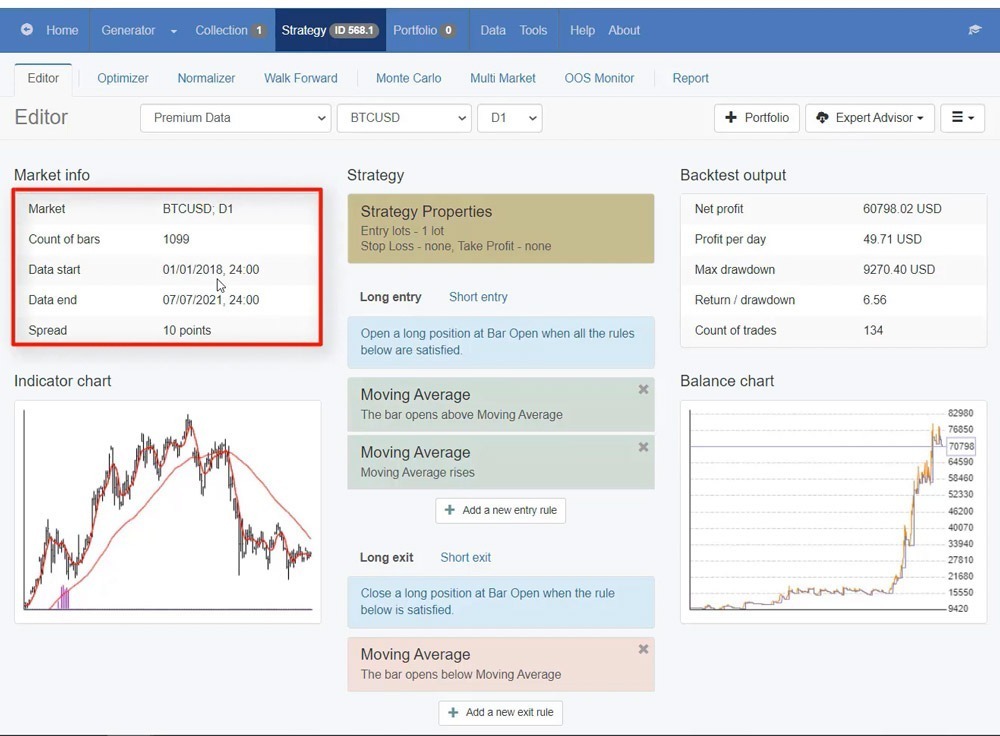
And if I click on Edit again, you will see that this data is from 2018 until the moment. I’m looking usually at the last 2-3 years, not going back before 2017 because the market was totally different. And you can change the data period actually from the Data menu.
Now, in the second place, we have the second indicator. Again, Moving Average with the condition rises and you see that the period is 50. So again, if I change it to 60, you will see that there is a difference, getting worse.
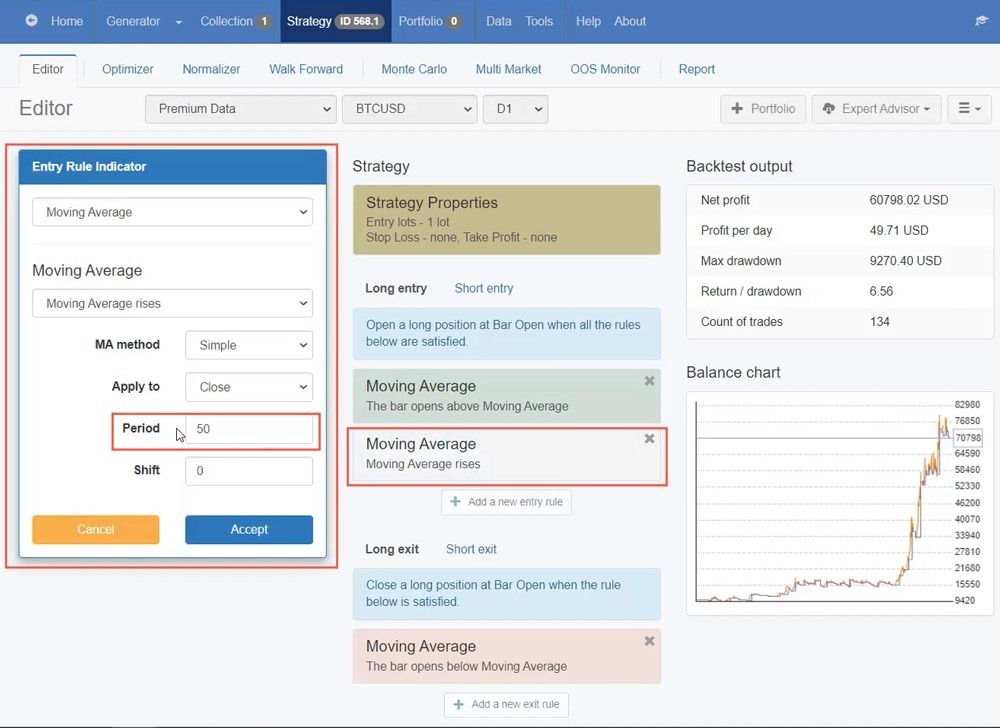
So obviously, with time, I have played around with the BTC trading strategy a lot to find the best values. Moving Average of 5 with the condition the bar opens above Moving Average and the condition for 50 Moving Average where we need to see rising, works best for me and for the current market conditions.
And these conditions where we want to see the bar opens above the Moving Average and the Moving Average rises are for the Long entry or when we are buying the Bitcoin.
For the short entry, when we are selling it, you can see the very opposite. The bar opens below Moving Average and the Moving Average falls.
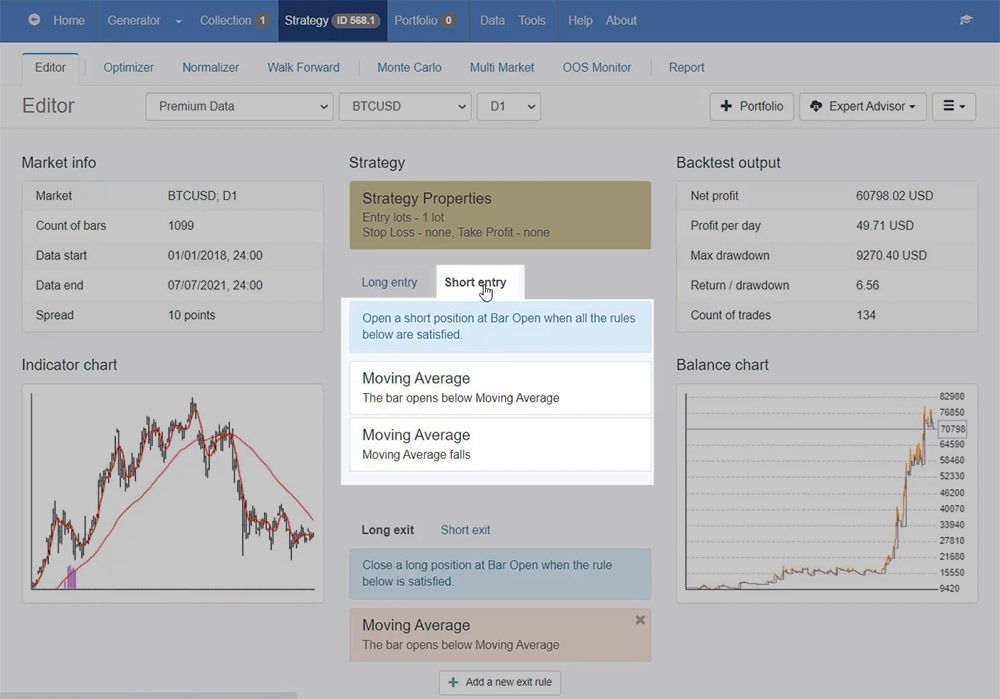
And below we have the exit conditions. So we exit the trade when the bar opens below Moving Average. And this is for the Long exit, one more time.
Entries and exits in the BTC trading strategy
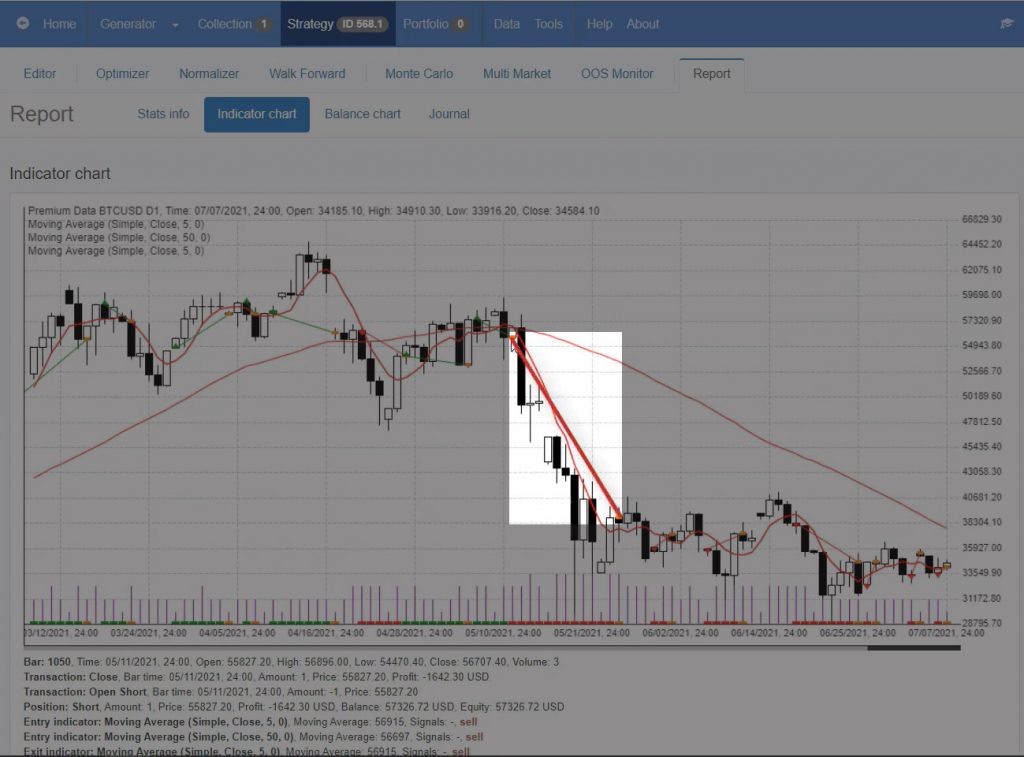
Now, here is the magic. I will click on the Indicator chart and you will see all the entries and exits very precisely. The strategy building software shows us exactly where were the Long entries and where were the Short entries with the Bitcoin trading strategy. Or in other words, when we have green below, this is the Long entry. And you see that when the 50 Moving Average starts to decline, we have only Short entries.
You can see it in red below the chart when we have the short trades or when we are selling the Bitcoin. And you can see it in green when we are buying the Bitcoin. So here you can see very visually where are the trades.
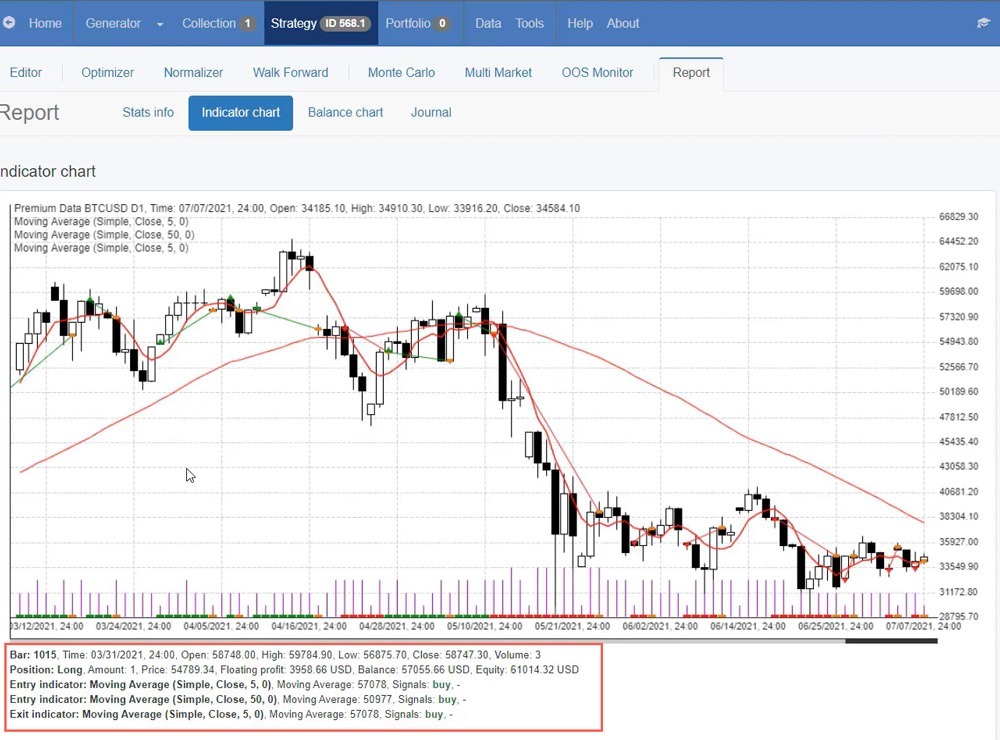
And below you can see the example, that I have pointed out. So you can see that with this long candlestick, let me go back to Trading View.
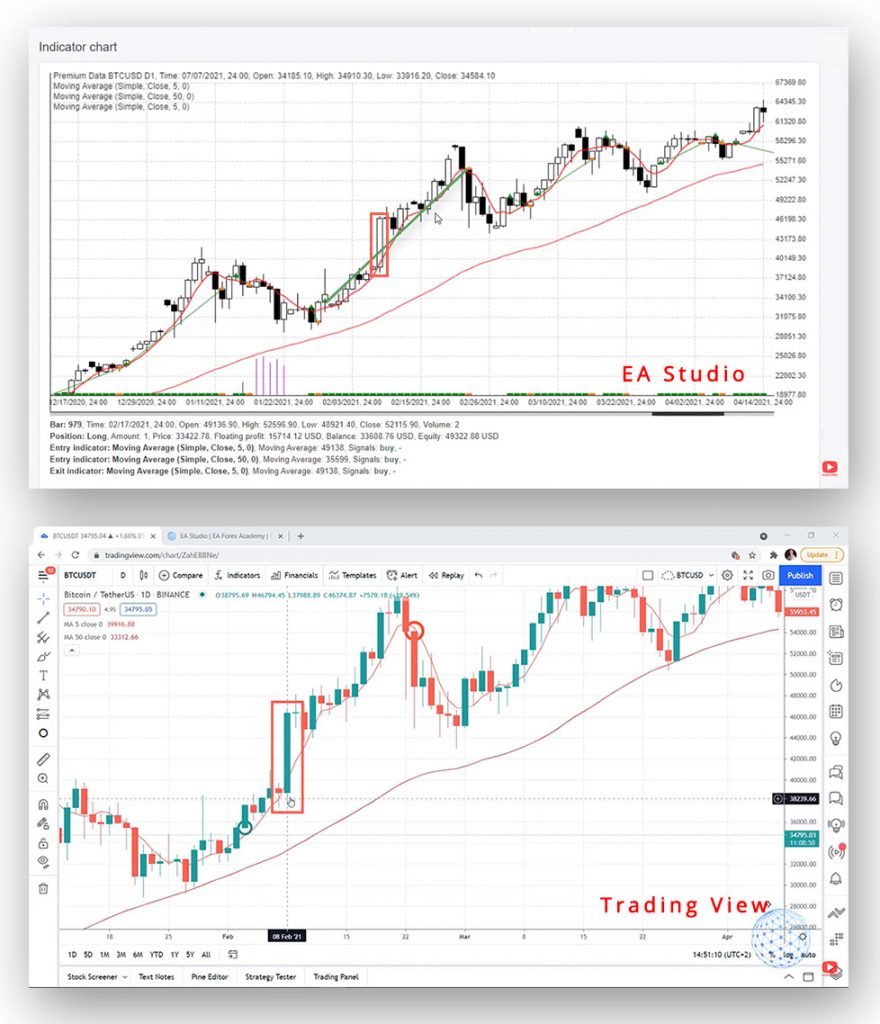
And it really looks like the opening of the bar was below the Moving Average. But if we look at it in the Indicator chart where we have the backtest on EA Studio, you see that we are still in the long position or in a buy trade up until this moment. So there was no exit at this moment.
And the strategy builder software is accurate because it has the full values of the opening, the high, the low, and the close for every candlestick right there. This is called the historical data which I have mentioned earlier. And when I move the mouse through the candlesticks, all the values change below.
Entry moment in the BTC trading strategy
And actually, you see from the image below that I was wrong for this entry moment in the BTC trading strategy. It was a bit earlier right another candlestick.
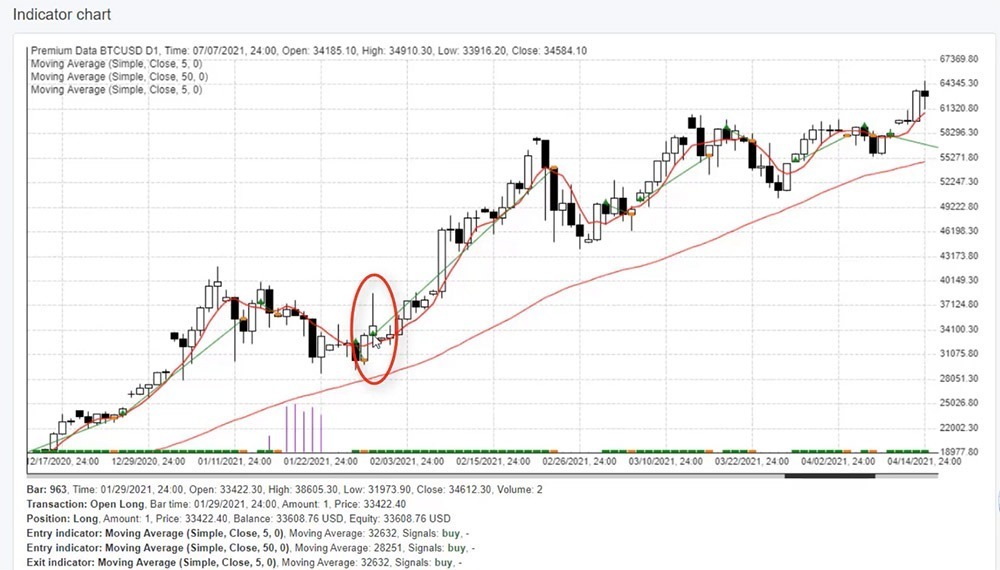
So we have the price below the 5 Moving Average and the first opening was right over there. But anyway, that’s the entry we talked about if you missed the first one. You see the price below and then going up.
But one more time, EA Studio software knows exactly where were the entries and the exits. And this is why using a trading robot is the best option for me because even if I miss an entry, the robot will not miss it. It will enter the market exactly and precisely. And it won’t be late with the trades, with the entries, and with the exits.
And if I scroll more through the Bitcoin trading strategy, you will see so many trades that opened and closed. You will see clearly that when the 50 Moving Average goes down, we open just short trades. When it goes up, we open long trades.
And it’s not just the Indicator chart. We have a Balance chart where we see the performance of the BTC trading strategy with some more statistics.
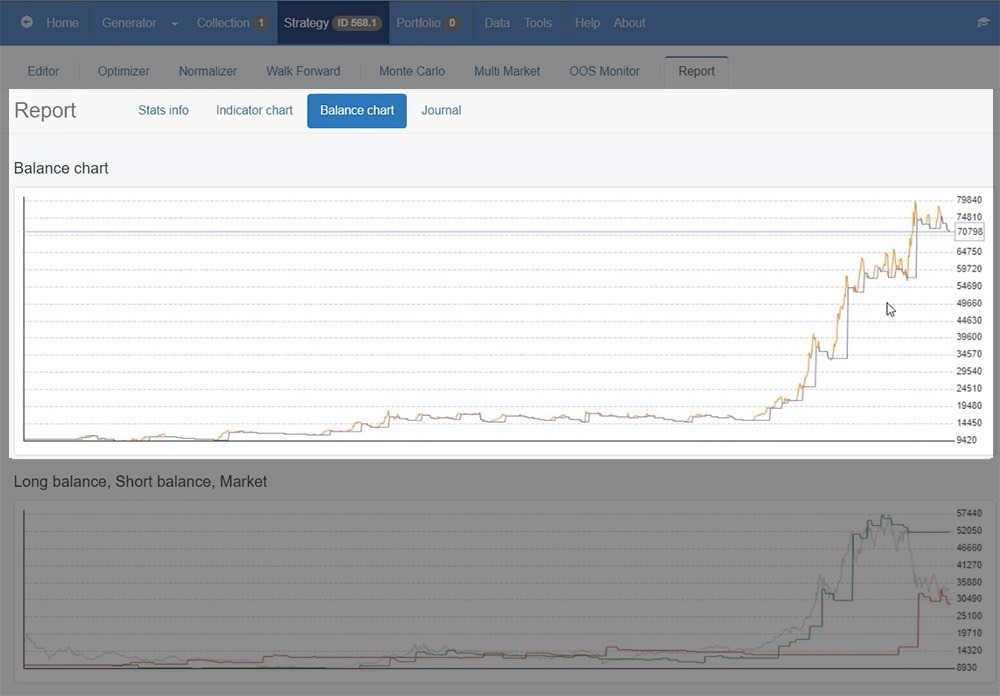
In the Journal, we can see exactly all the trades starting from 2018. I selected that period of time for the backtest one more time, but you can see exactly where the trade was opened, at what price, and what is the result. Was it a losing trade or a profitable one?
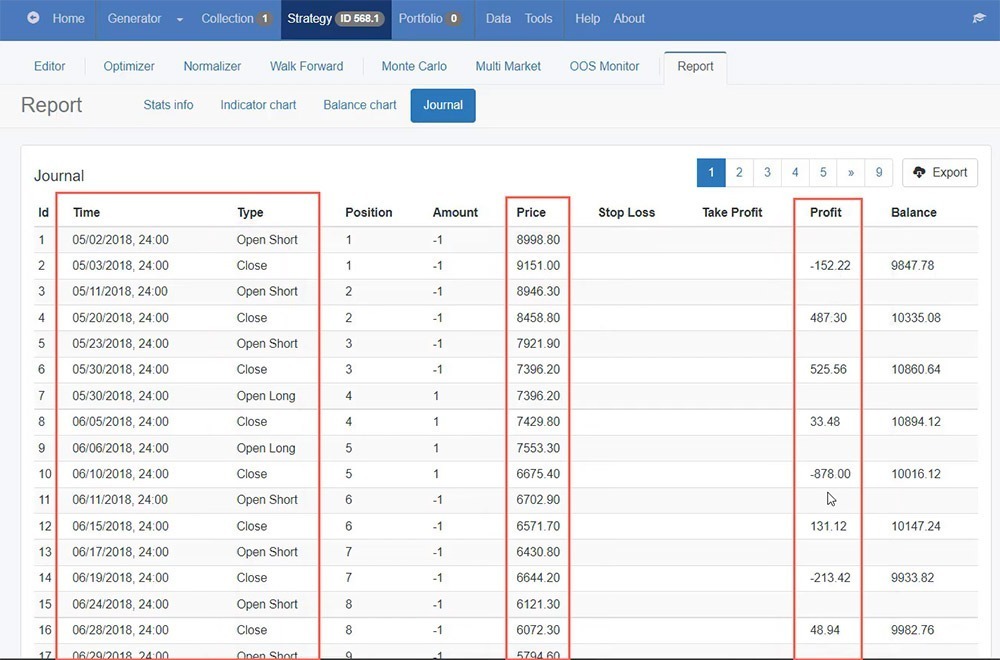
And like every trading strategy out there, there will be losing trades. Even if we use the filter of 50 Moving Average to show us where the trend is going, remember that there will be losing trades. But at the end of the day, what matters the most is to have profitable trades from the Bitcoin trading strategy. And, of course, when the market is volatile, and when there are nice, huge movements, there will be more profits.
You can see that recently, in 2021 when the market was extremely volatile. You see a profit of $3,000, then 2 negative trades, then another $2,000 of profit. And here is a great profit of $17,000 that the strategy took.
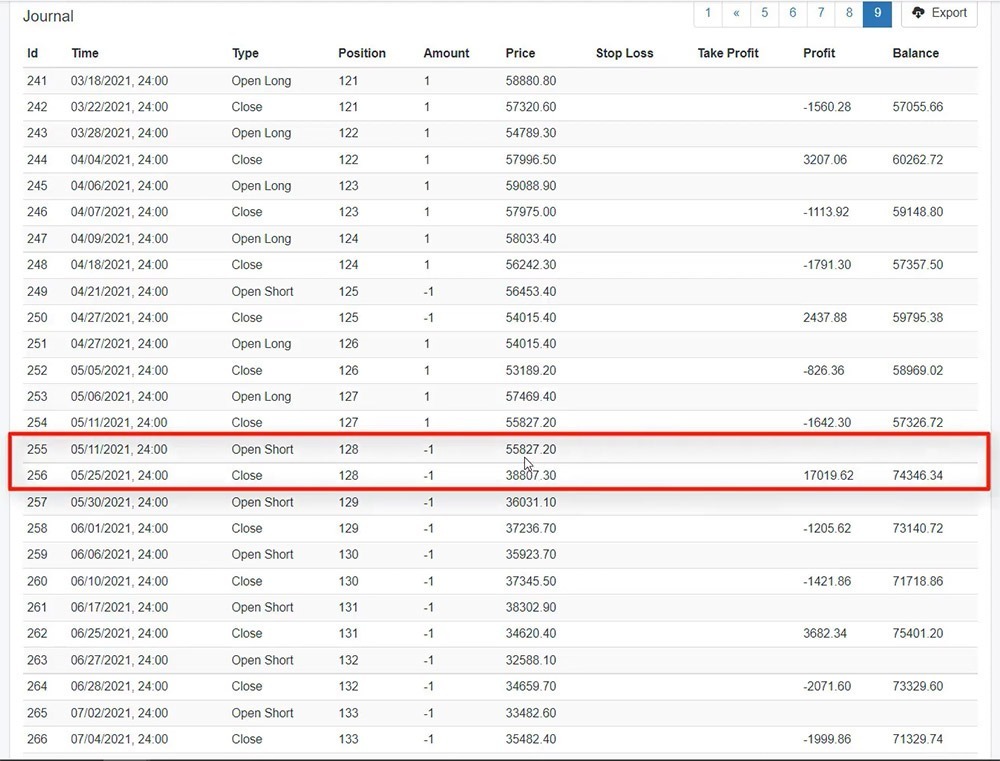
Let’s have a look at this trade. So it was a short position at 55,827 on the 11th of May 2021. When the market turned negative, this trade over there brought a great profit with the BTC trading strategy.
So this is why I’m using the software EA Studio to show me a realistic backtest to know exactly where the trades happened and not to be misled by looking just at the chart with the Moving Averages.
I explained that the indicators are repeating. You can read much more about the repeating over the Internet. And, one more time, many traders do the mistake to build trading strategies based on just what they see, but this is wrong. You need to have professional software. I mean, you don’t need to have it. I need to have it as a trader who builds strategies and uses trading strategies daily.
How to apply the BTC trading strategy
To apply this simple Bitcoin trading strategy, you don’t need to have the software because you already have the robot, the ready-to-use code, and the Expert Advisor for this strategy attached to the Simple Bitcoin Trading Strategy course.
So this is how I know that this BTC trading strategy works great. I’ve been using it for quite a long time and it worked really perfectly, catching some great moves on both sides when the market goes up when the market goes down.
And of course, I keep an eye on the strategy. I have a lot of tools in EA Studio like Optimizer, Normalizer, Walk Forward, Monte Carlo, which I won’t talk about in this lecture. But I use these tools in the software to modify and improve the BTC trading strategy so you always have the latest version in the course. And of course, if I modify it, I’ll let you know and you will be able to download it.
So these were the parameters and the values for this simple Bitcoin trading strategy for beginners. Moving Average of 5 and Moving Average of 50 is what I’m using at the current market conditions for Bitcoin. And if you have any questions, let me know in the comments below. I’ll be super happy to assist you.
And in the course, I show how actually you can trade with this robot and with this simple Bitcoin trading strategy, and I give some tips as well if you want to use the strategy for investment purposes.
Thank you for reading. We’ll see you right in another lecture.
Hello Petko,
with great interest i have watched your video. Thanks for that, i just also bought the course NFT at the udemy.com and want to follow also the course of trading crypto’s. for now i am using trading view . ( i am a beginner ).
some questions :
1. does it require EA studio to follow the strategies in combination with the robot.
2. is EA a substitution for tradingview?
3. these bitcoin strategy with MA 5 and MA 50 , is it also working for ETH or other crypto’s who are longer at the market?
I hope to hear from you soon.
Kind regards ,
André Lardinois
Hey Andre,
EA Studio is the software we use to analyze the strategies. When the EA is exported out of the app, you do not need it. So when I include Robots in my courses, the students/traders do not need the EA Studio.
This SImple Bitcoin Trading Strategy works on any platform as long as you can put the Moving Averages. I have backtested it for the ETH and it worked well.
We are working on EA Studio so we can trade the strategies on Trading VIew, or at least get signals for the strategies,
Cheers,