Overview
Walk Forward testing represents a sequential optimization of the created strategies. We also call it Walk Forward Analysis (WFA) or Walk Forward Optimization (WFO).
We came up with the name “walk forward” because there is a moving window that gradually goes over the entire period of the historical data with a pre-set step.
When you click on Strategy from the top main menu in EA Studio, the Walk Forward tab is right after the Normalizer tab.
Thе main goal of the Walk Forward Testing tool is to minimize the over-optimized parameters in their strategies.
It is not that important to have strategies that look perfect on their backtest. However, it is meaningful to create systems that work well in a live trading environment.
Over-optimized strategies can easily fail and this is something that traders try to prevent when trading with real money.
The Process of Walk Forward Testing
There are different optimization stages in the WFA. First, there is an optimization in a larger time window (In Sample), and a test in a smaller window (Out of Sample).
All the parameter variations are tested during the In Sample stage. The most robust combination that fulfills the WFO criteria is then used in the first OOS segment.
The same process then repeats until the point when the WFO goes through the full data feed with a pre-set step defined in the Options. Then, the Statistics tab displays the results of the OOS analysis.
Equity chart and Output
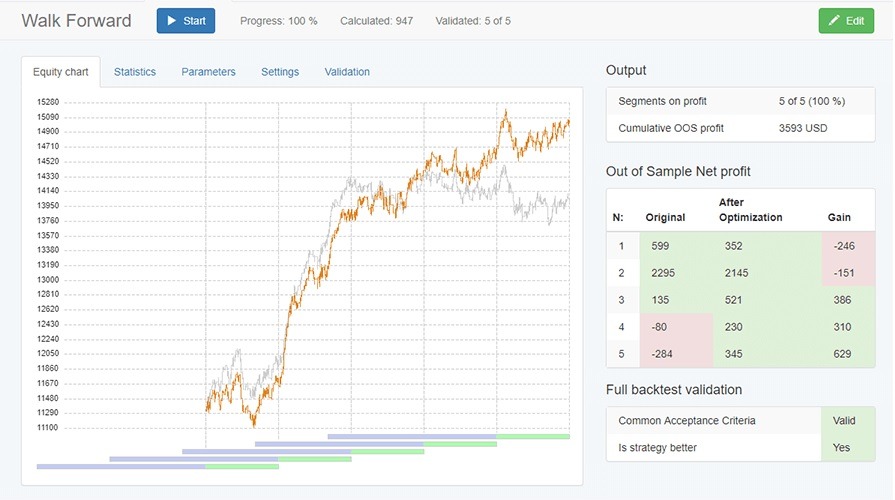
When the optimization finishes, you have a visual representation of the strategy performance with the equity chart.
Also, you can analyze the provided statistics and make an estimation if it’s better than the original strategy. The good results mean that the strategy is stable despite the changes in the market.
The provided WFO results on the image below show you a well-performing strategy even in the OOS.
Statistics
The main segments that you can analyze after the Walk Forward Testing are – start date and end date, profit, drawdown, return/dd, trades, sqn, and win/loss.
There is a section with additional statistics as well. For instance, the ones that we find to be most beneficial are: Profit per day, Profit factor, Max consecutive losses, Max stagnation, Months on profit.
Parameters
Strategy parameters by segments
In this section, you are able to see the exact values of the indicators used for each segment of the Walk Forward Testing.
Full backtest with last parameters
After all the segments are optimized, the WFO makes a backtest using the full historical data, and the last parameters from the last segment. Then it provides statistics together with an Equity and a Balance line.
Settings
There are several options here which you can experiment with: a number of segments, out of sample, numeric values range and search best.
In addition, you have Optimize Stop Loss and Take Profit, and also Optimize Preset Indicators.
Validation for the Walk Forward Testing
The Walk Forward Testing concludes that a strategy is successful by measuring the performance of each segment.
Edit button
When you click on this button your strategy goes to the Editor. This is very handy in case you decide to export an EA with the last optimized parameters.
When the “Edit” button turns green in color this means that:
- The full backtest fulfills the Common Acceptance Criteria.
- The optimized strategy outperforms the initial version according to the “Search best” option.
- All the segments of the strategy are valid.