Forum Replies Created
-
AuthorPosts
-
richard
ParticipantYes I always use monte carlo as Petko teaches…. Set it to run within the reactor. The reactor can hold a maximum of 300 into the collection. I run up to 10 reactors at a time. 6 on one PC and 4 on another. I run them continuously at times and it has taken weeks and maybe months to get the number of strats I am talking about. Of course there will be a point when it is no longer a benefit to keep adding more and more strats and may even have negative effects…… I don’t know yet. I just keep running multiple side by side tests all the time to identify any consistent edges that I can add to the system….. I would probably just stick with 4 pairs like the EURUSD GBPUSD EURJPY GBPJPY if you are fairly new….This will give you the 4 main pairs evenly traded. (Each currency appears twice each) Create a few 100 strats for each pair and then experiment on how you will filter them to say a top 10 of each. Then trade all 40 together on one MT4. One of the key things I have learnt from Petko and my years of manual trading before coming here is to keep the currencies balanced for each MT4….. One of the bigger questions I have pondered lately is do you filter the trades more thoroughly initially and then possible run them for a shorter period of time (1 week) or do you not filter them so stringently and let them run for say a month but then apply some filtering as you go along to cull the poor performers…. If you have read through my posts in the last month I feel more comfortable creating a large amount of strats, filtering them more stringently and then let them run for 1 week. I am aiming to start them Monday morning and then shut them down at the end of the week and be out of the market over the weekend. I will have to see how I go……. Without getting to philosophical I believe that you have to ultimately make your own system that aligns with your personality. Any way enough ramblings for now……..
ParticipantYou’re welcome……
ParticipantHi Asser. This is what Popov says regarding the correlation setting:
(Hope it is OK to copy and paste his remarks here….)
“The Correlation shows how equally trade two strategies. It compares the Balance lines of the strategies for the complete testing period.
A correlation coefficient of 1 means that two strategies have absolutely equal balance lines. It is possible to have strategies with different trading rules to rise very similar signals and we want to eliminate such cases.
When the Correlation analysis is on, it checks every strategy pushed to the Collection against all other included strategies. If the program finds that two strategies has correlation greater than the set value, it marks them as correlated. EA Studio removes the strategy with the the lower profit in such cases.
For example, a Correlation Coefficient of 0.96 means that the strategies differ by 4 percent.”
This week I am running some side by side tests to compare .9 vs .98 correlation…. At this stage .9 is about 20 – 30 % more profitable then .98 and tends to open approx 20% more trades, but early days yet obviously……
The top 5 vs top 10: Top 5 seems to out perform Top 10 by about 30% across a dozen test variations I have run over the last 3 weeks…. (this means that you are doubling position size on the top 5 obviously to give you the same margin % / risk as the top 10.)
Without getting to far ahead…… You might want to look at lot size for each pair regarding ADR. I am running some tests with fixed lot size (.03) vs variable (.01 – .08) depending on expected return for the week from each portfolio of 10. Again I am always looking for balance and smooth equity line. So that each pair is delivering a relatively even contribution to the overall system regardless of ADR…..
ParticipantSo this is my latest way of doing things. I don’t think you ever should stop evolving your systems. Because I feed in so many strats to get my top 10 / 5 (I am actually starting to find the top 5 more profitable lately…..) I also have started playing with the correlation %. I bring it up from the standard .98 to .90 to ensure that all my strats are significantly different from each other. More diversity within the portfolio.
Anyway it is good to see you experimenting with different idea’s based on what you are learning here. This is what I do as well. Good luck….
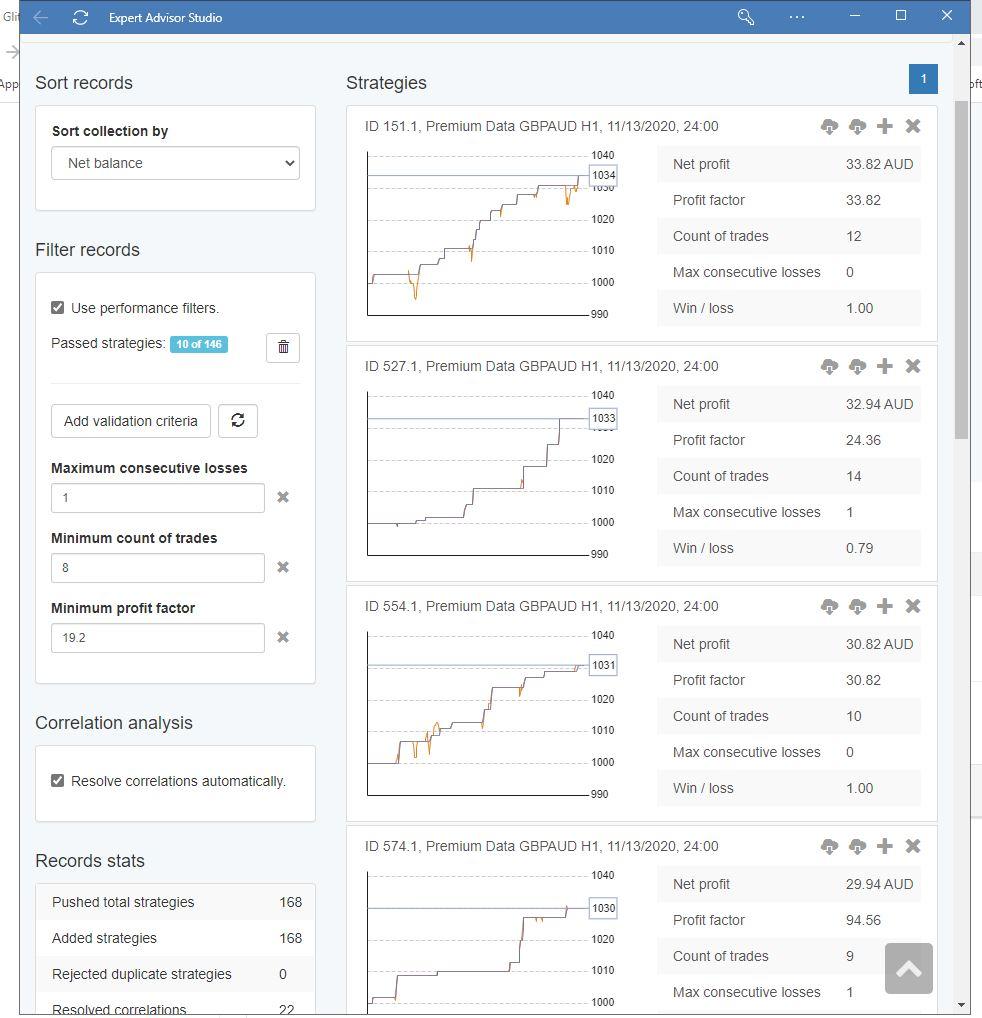
ParticipantThen I end up with some pretty good looking strats into the portfolio:
 Participant
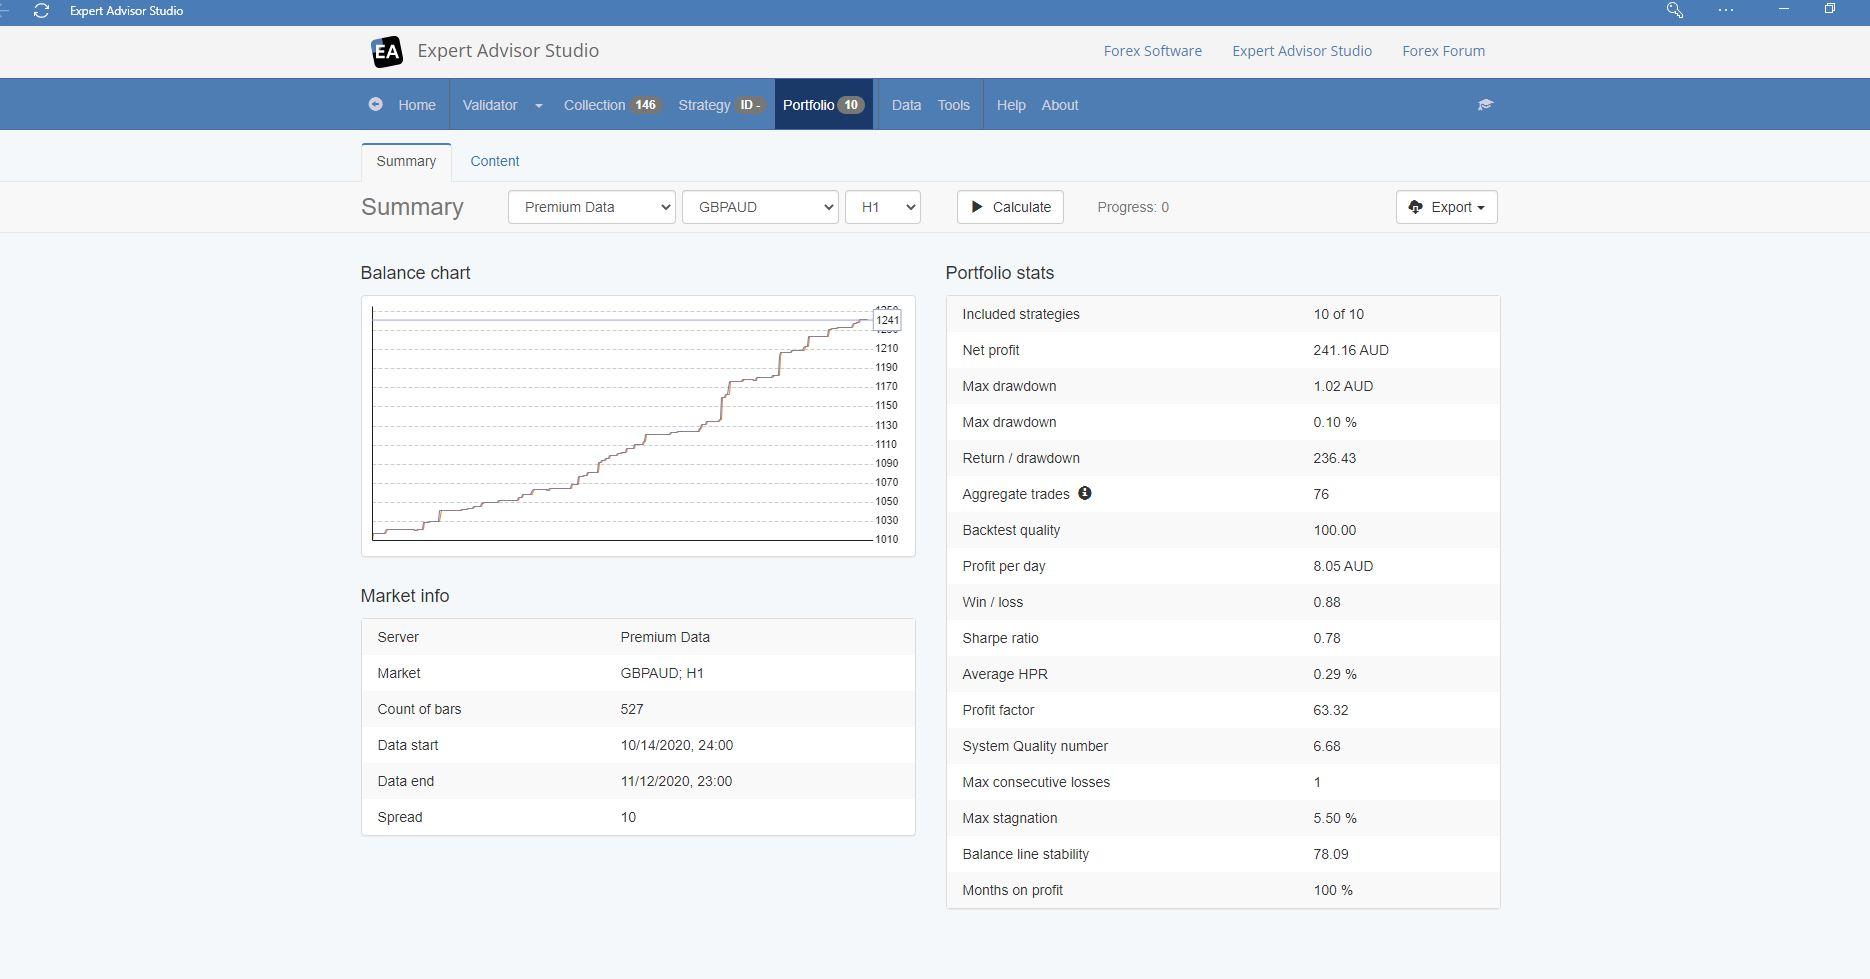
Then bring up the PF till I get the best 10. Create portfolio:
 Participant
So if I read it correctly you are ultimately creating your portfolio of 10 from the 3 years of data. Of course at the end of the day you have to practice and find your own system. Which you are doing…. I prefer to create the strats leaving off the last month. Then run them on the last months data. And then select my top 5/10 based on the last months performance. In my mind that means that the strats have proved themselves over 5 years to be profitable and they have also proved themselves to be profitable in the last month. Because I use very stringent criteria they will be consistantly profitable over the whole of the month without any significant dips in the equity line…..
Example attached: Here I feed in over 1000 strats created over 5 years of data. Then run them over the last month. You see only 146 pass the criteria for the month. This is currently set to COT 8, Losses in a row 1. When I was only feeding in around 50 – 100 strats before I had to use much lower criteria to get enough strats to pass. (COT 5, Losses in a row 2. ) As I get more and more strats to feed in the tighter I make the
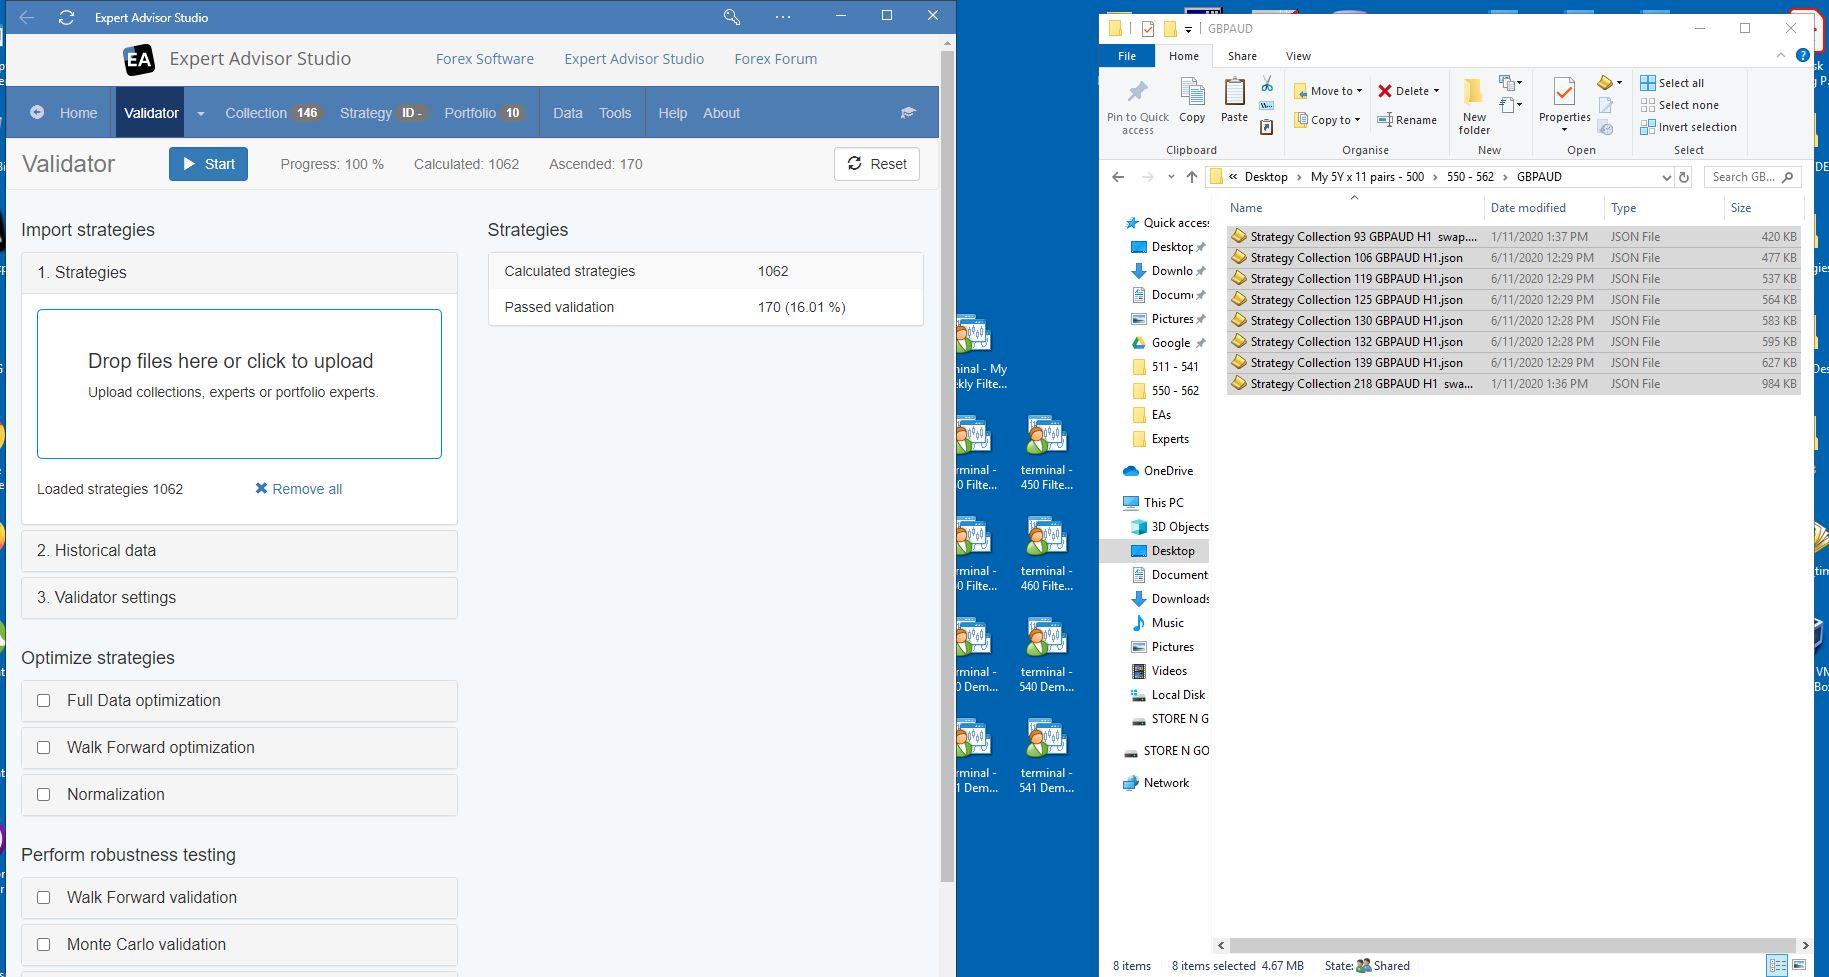 criteria.Participant
I do something similar. To test my ideas for example on H1. I use 5 years of data COT 5 and PF 1.2. I go back 5 years and 2 months. I set the data horizon for 5 years and exclude the last 2 months. I keep the reactors running until I have at least 300 strats and sometimes up to 2000… I then use the validator to “feed in” all my strats (the validator does not have the limitation of 300 like the collection does). I set the validator settings to something a bit broader like COT 5 and 2 consecutive losses. I then set the data horizon to 1 month ago so 1 month following on from the five years that the strats were created on. I then experiment with different filters on the collection tab. COT 5 – 10, sort by PF, WL ratios etc….. Then i select the top 5,10,20 and create the portfolio. Then change the data horizon to the last month and recalculate. Now you will see how your portfolio would have run in the last month with the previous months filters you applied. This gives you the ability to test 100’s of ideas and get a pretty good idea of how they will work in the future. Of course I am sure that this will not be quite as effective as running your ideas forward in actual time but it will let you know if you are on the right track. Because i have now created about 1000 strats for each of the 11 pairs that i trade i am setting the validator setting more stringently. Currently COT 8 and Losses in a row 1. This normally takes my 500 – 1000 strats to about 50 that meet the criteria for the month. From there I am finding the best ones are top 5 sorted initially by NB and then filtered by PF but I am still testing. I then run these top 5/10 forward on a demo with a balanced selection of currencies. So always the currency appears an equal amount of times: – EU, GU,GJ, EJ. that covers the 4 main currencies. I am now experimenting with adding AUS and CAD so You need 9 pairs to get even exposure: AC, AJ, EC, EJ, EU, GA, GJ, GU, UC. I have only just started to realise the power of the validator so I encourage to have a play with it if you haven’t already….
October 27, 2020 at 9:51 in reply to: EA Studio on Chrome is pausing when another screen is maximised #64214ParticipantYes… I have swapped over to Edge and all good now…..
October 25, 2020 at 7:43 in reply to: EA Studio on Chrome is pausing when another screen is maximised #64013ParticipantJust tested it on firefox and on 2 different computers…. Same problem…..
October 25, 2020 at 7:26 in reply to: EA Studio on Chrome is pausing when another screen is maximised #64012ParticipantHi. Yes I have them all running in separate apps and have never had a problem for 1 year. But something changed a few days ago and now if you maximise another window in front of them they will stop running and as soon as you minimise the window in front of them they will start running again. Other people are reporting it as well so I am pretty sure that something has changed. If you use chrome can you please run a test. Start a reactor running, look at the counter then open any other window in front of it for a minute then minimise and look at the counter and see if it has stopped running for that period. I also run multiple “desktops” on my screen. When i “slide” off the desktop that is running the reactors and then come back to it the reactors have “paused” for this time…..
ParticipantThe highest magic number that you can have is 2147483647. So best just to stick to 9 digits to give you all the combinations you would want
ParticipantSo this is how I would set up to trade what you do.
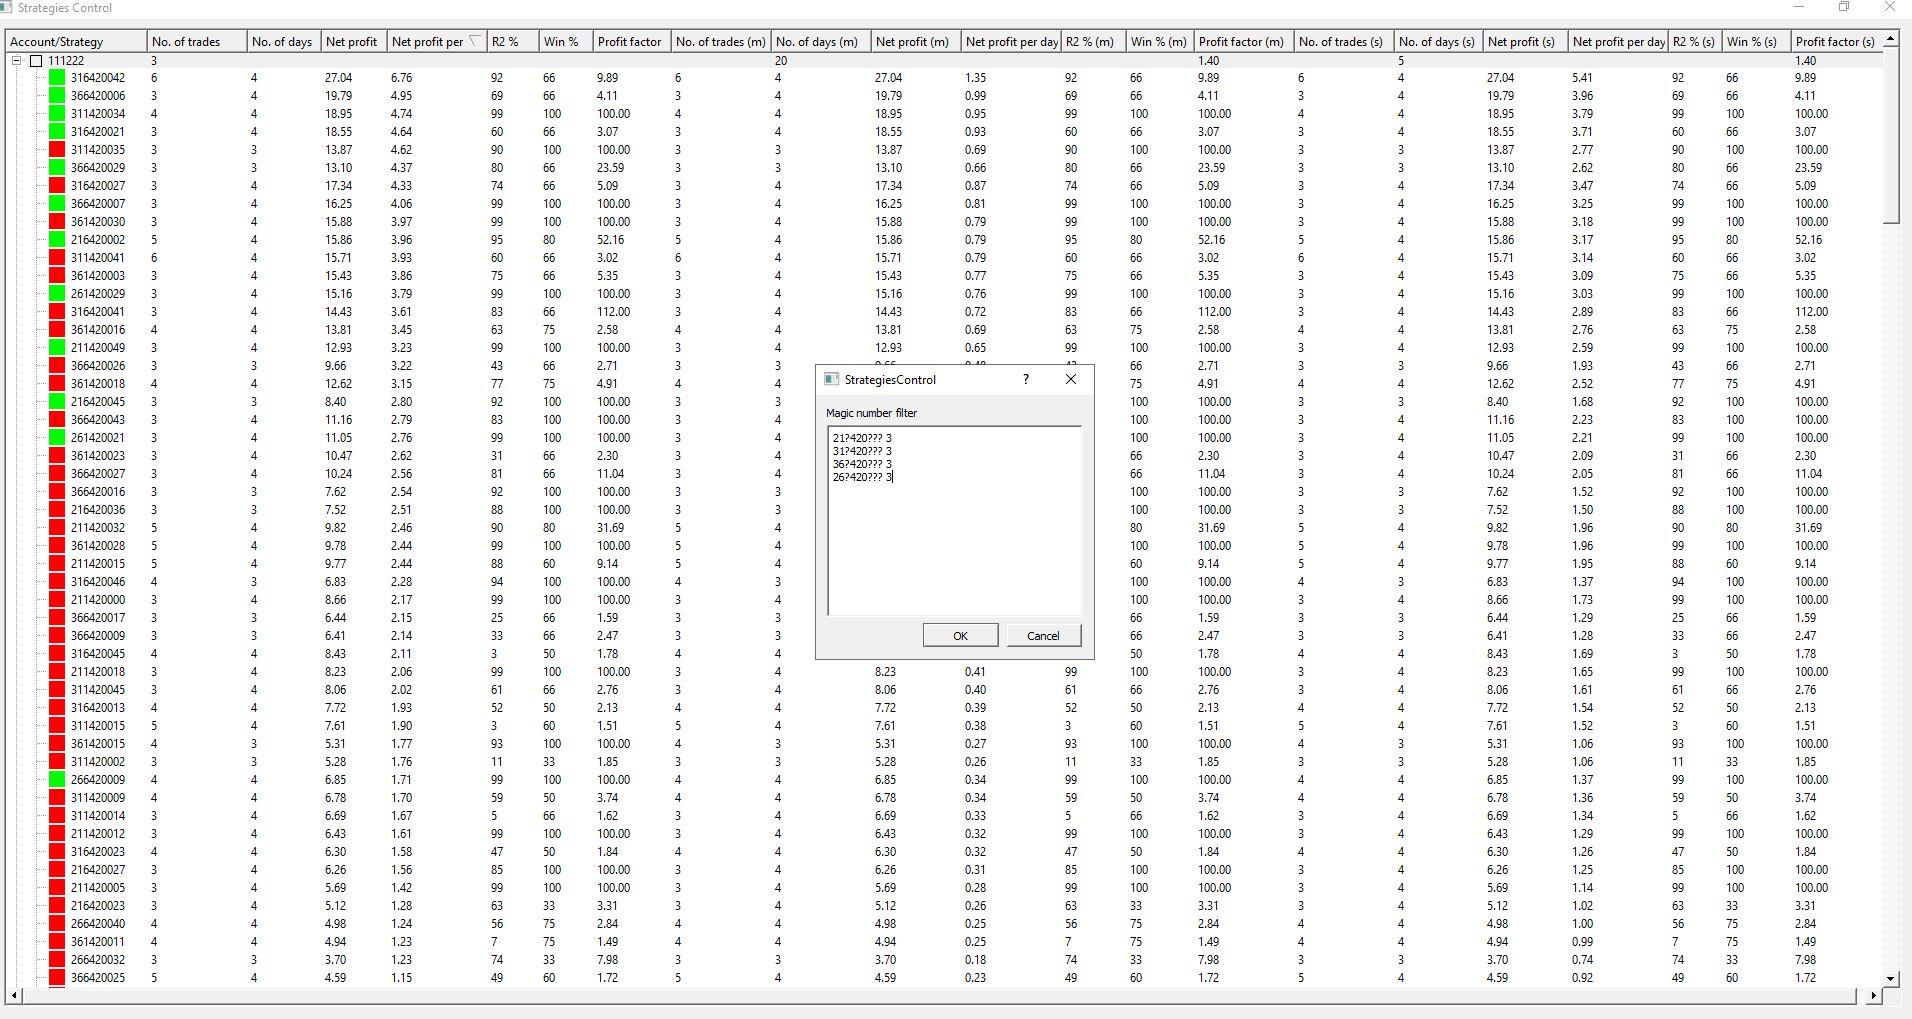
Minimum 3 trades. So you can see only strats with more than 3 trades are displayed. Then 20 days and 5 days set to 1.4PF, My system only reads trading days so this is 4 weeks and 1 week.
As you can see these strats were only started a few days ago so not ready yet but the system will automatically capture the last 5 days and 20 days and calculate the PF etc. Those that meet the criteria will stay displayed.
So that i send an even number of strats from each of the 4 currency pairs being traded I have also selected that only the top 3 of each currency are to be sent to live. (See pop up box) You can see this by the green boxes next to the strats. Again if a recently closed demo trade is better then 1 of the green strats then it will push it out of its spot and replace it……
 Participant
On Petko’s top 30 above it is set to live. The tick in the tick box next to the account number means that the filter is applied automatically and is live. So as trades close in the demo, the filter fields on the app are updated instantly. If those closed trades mean the strategy now meets the filter criteria that I set, then that magic number will be sent to the live account and held there. The next time the strategy opens / closes on the demo it will be auto copied to the live. Same as if a recently closed trade puts the strategy below the filter criteria the magic number will be removed from the live account. This way everything happens automatically and in real time…
I can also momentarily check the tick box and then untick it. This will send the filtered magic numbers to the live account but because it is then unticked the magic numbers will stay the same and not update as described above. This is what I am thinking I will do with my new demos when they have run for 2 weeks to emulate what you are doing. So i will set weekly and monthly to 1.4 PF, min of 3 trades and each week send the filtered magic numbers to the live. This will update the Live account. If any of the strats are the same it should just keep those running, remove any that no longer meet the criteria and then start opening in sync with the demo. The only issue I see with this is any strats that are already running on demo won’t start straight away on the live. I will have to wait for the next time they open on demo before they are copied to live. Anyway I will run some side by side tests with my system automatically running and manually placing them as you currently do and see what the results are….. Hope that makes sense……
ParticipantThis is the result from the first week of IIan’s Weekly Robots Course. (I’m hoping it is OK to post these results….. Let me know if not……)
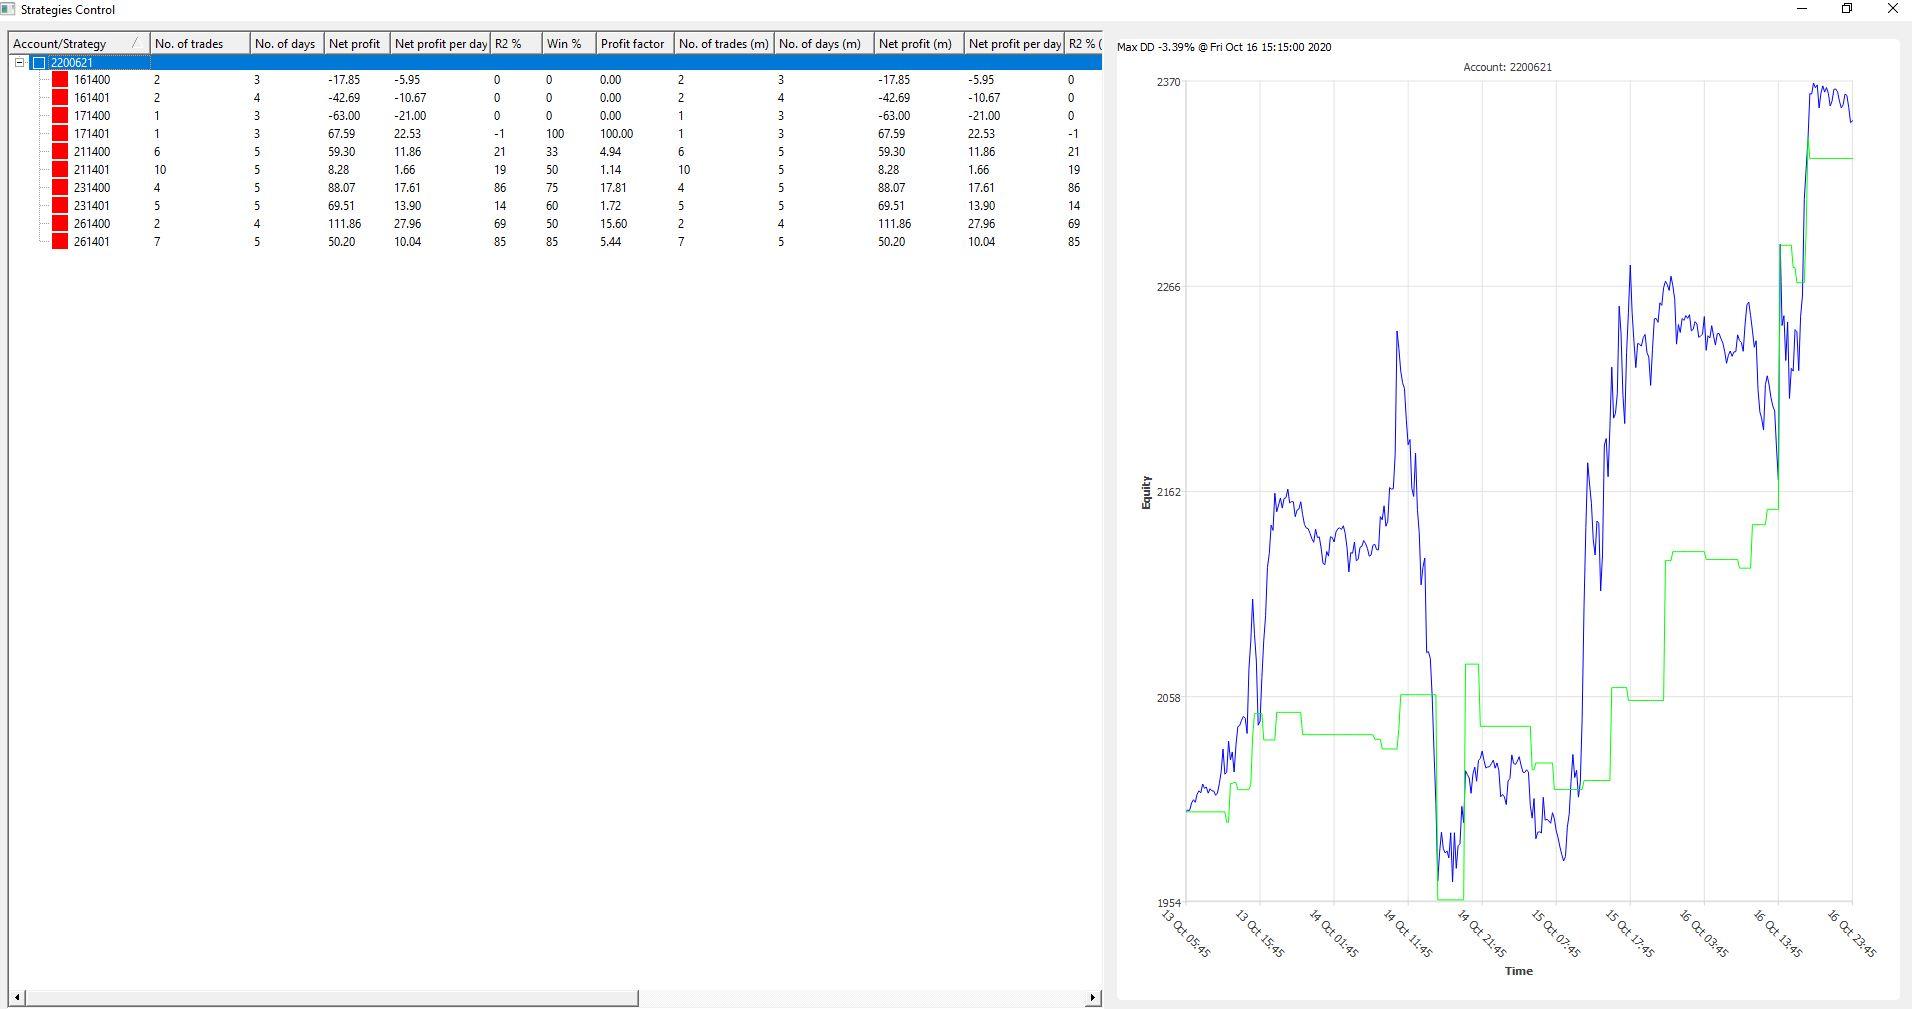
There is no filtering applied to these strats as they are already filtered for the week before installed. So they are simply left to run for the week as is. I definitely like this approach and have started running some demo’s looking to set up a similar system myself…..
But as you can see, a very successful week……
-
AuthorPosts