Home › Forums › Historical Data › Use of Historical data & Data Horizon

Tagged: custom datas, data horizon, fbs, Glitch, historical data, Historical data App, History Center ON MT5, IG, metatrader, sychronization, symbol settings
- This topic has 48 replies, 6 voices, and was last updated 5 months, 1 week ago by
Alan Northam.
-
AuthorPosts
-
-
June 10, 2019 at 16:11 #65581
Asser
ParticipantHi Petko,
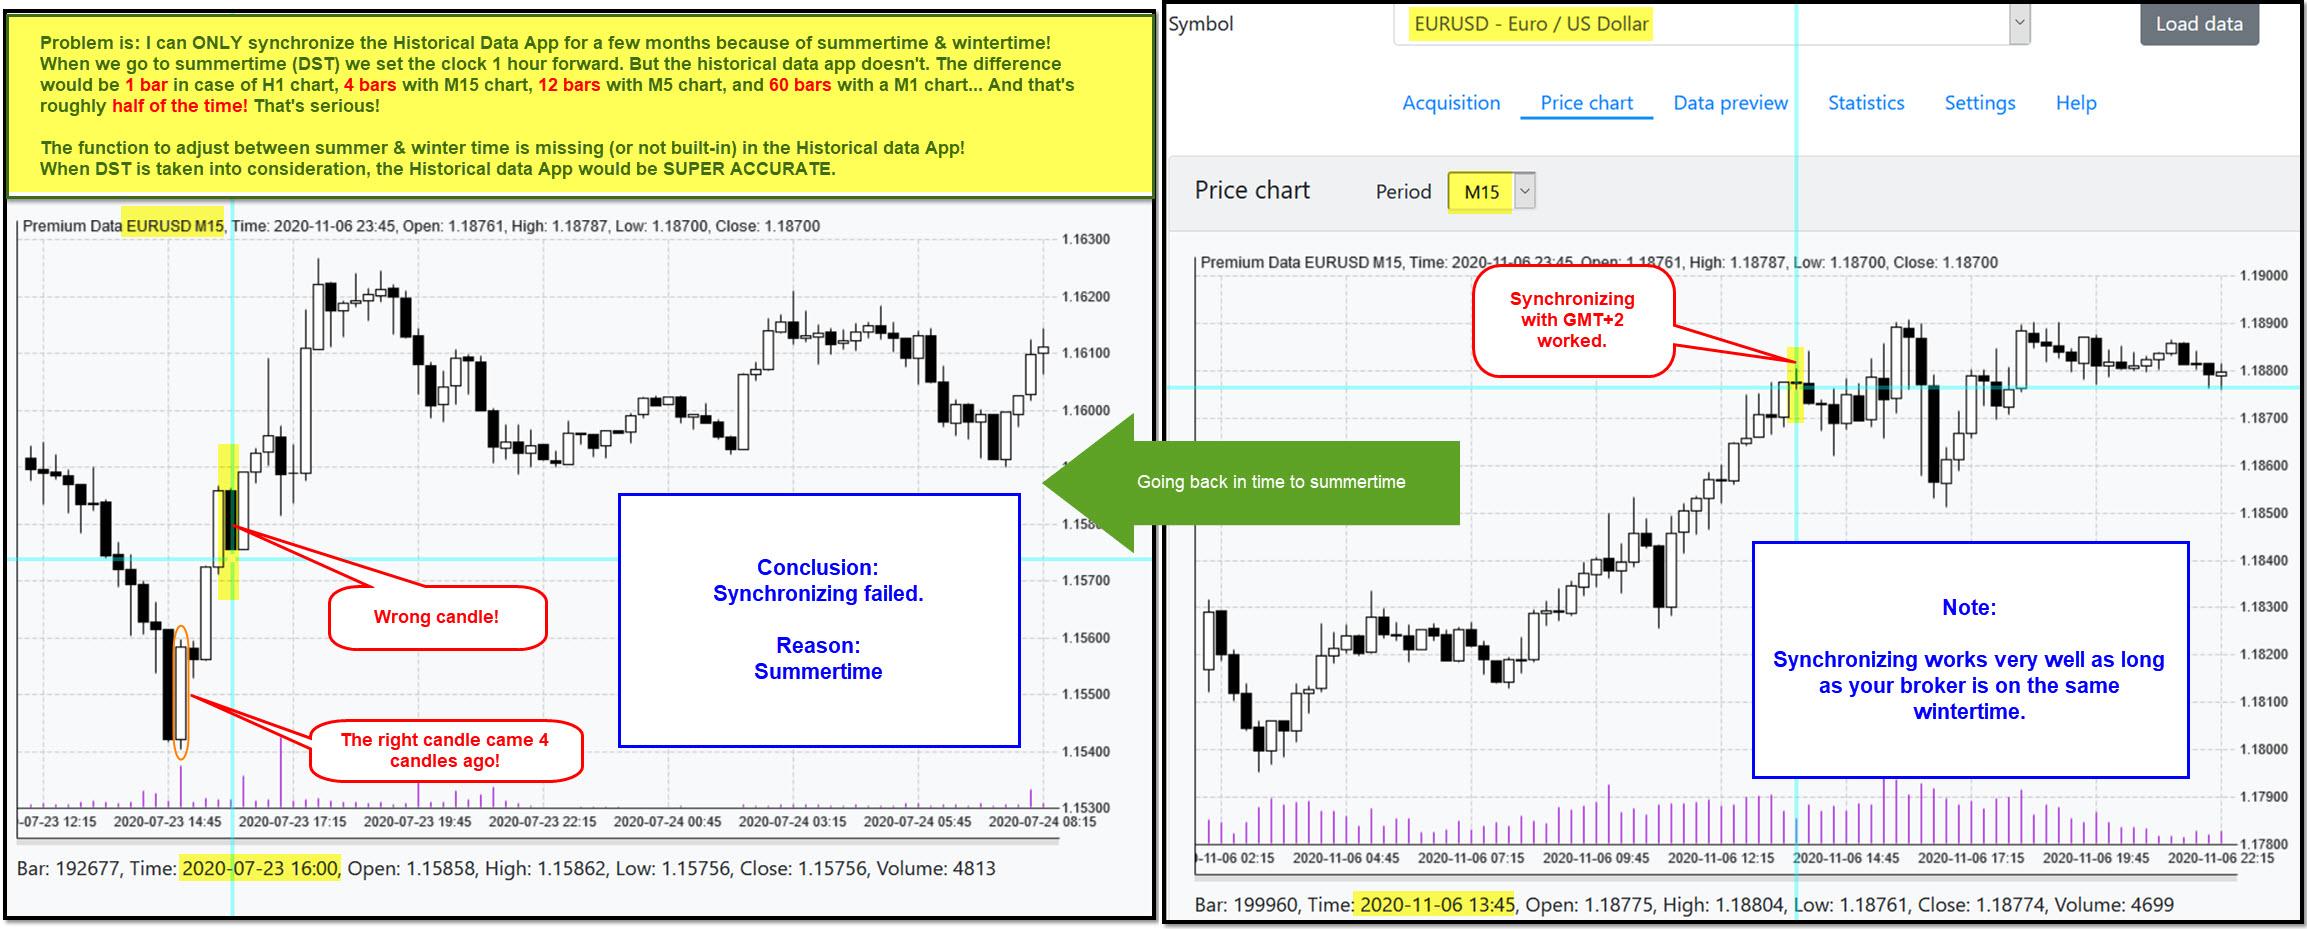
Thank you for pointing out to me that I was blocked because I shouldn’t upload more than one image per post. I have therefore created a one in all image.
I hope I’m wrong, but if I am right and if Mr Popov can update the Historical data App, it would become SUPER ACCURATE for all traders.
I’m adopting your best and newest gameplan which you showed in your course:
Forex Trading with Expert Advisors + 30 Best Strategies (Every Month)The plan consists of (in my words):
– Uploading 5 years (or so) of data with the Historical data App (Remember to adjust the timezone)
– Creating a portfolio of 10 strategies with the Reactor,
– Doing nothing for one month
– Recalculating the 10 strategies on this last month’ data and go live.So I made a gameplan of my own:
– I upload 5 years of data (UP TO 13. January 2020)
– I create a portfolio of 10 strategies,
– Using Data Horizon, and simulating that today is the 13. of January 2020, I run the 10 EAs on January month (13. January through 31. January)
– Next I do the same with February, March, … up to 30. October 2020.
– By recalculating & adjusting the 10 strategies every month (just like doing it live), I can see (month-by-month) what is the potential of this excellent strategy and what kind of profit I can make. That would boost my confidence and allow me to start trading live for the first time in my life.
Therefore the problem (as explained in the image) of synchronizing data with my broker with Historical data App is of a huge importance to me.
Please take it seriously!
Thanks.
-
June 10, 2019 at 16:11 #13353
baconltom
ParticipantIt seemed like you loaded the 100 EAs for us based on the historical data from your broker JFD. Won’t that effect our performance if we are on different brokerages making your updates invalid or even other EAs more effective? Or am I missing something?
-
June 11, 2019 at 0:21 #13362
Petko Aleksandrov
KeymasterHello! Yes, actually there is a difference between generated and optimized. The EAs are not optimized with JFD broker, but they were generated over the data. Noe, optimizing is when we fit the parameters of the indicators to the data and the tested period. Something we never do.
Obviously, I had to choose one broker to create the EAs, anyway, I would not have any data. And I can not create EAs with many brokers or all of them.
I tested many of the EAs generated(not optimized) with the data from the broker, and they seem to work well on other regulated brokers as well. The backtests are similar.
I hope this answers the question.
Regards,
-
March 23, 2020 at 10:35 #42308
Simon Chong
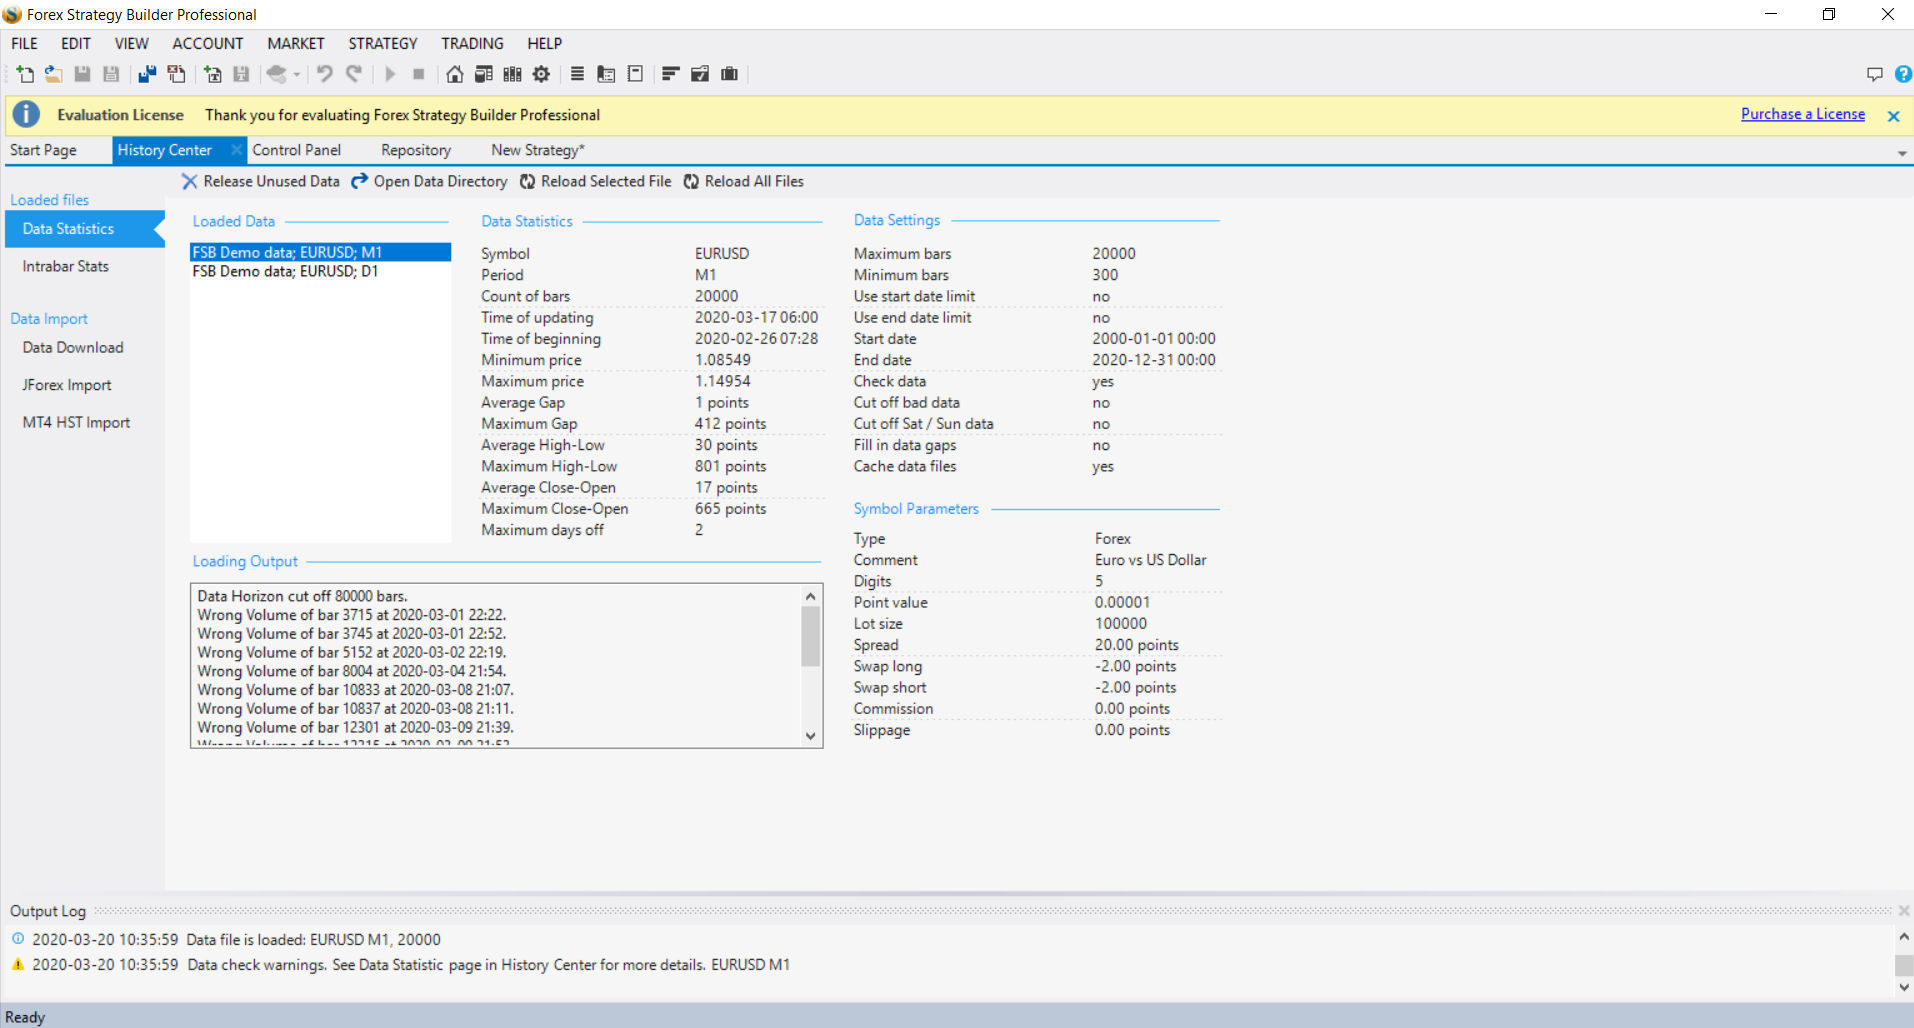
MemberI have only use the data from FSB at the moment and it seems that the data have problems. How to solve it?
-
March 24, 2020 at 21:25 #42494
Petko Aleksandrov
KeymasterHello Simon,
Did you try to open and close the FSB Pro?
Also, why don’t you import the data of your broker? It is much better to generate EAs using your Historical data.
Cheers,
-
November 10, 2020 at 10:01 #65669
Petko Aleksandrov
KeymasterHey Asser,
Let me have a look at it in detail later today, and I will give you the answer.
Kind regards,
Petko A
-
November 10, 2020 at 14:59 #65701
Petko Aleksandrov
KeymasterHi again,
Just going over it again I noticed you are talking about the summer and wintertime.
That is not a glitch. The data from the app is one, it is bars.
It is about if your broker actually changes it or not. Some brokers change it, others do not. Some synchronize it with your local time.
So a solution is to set your time on the computer to UTC, and then install a new MT platform and see if the broker will synchronize it.
If it does, great, you will have the perfect match in the data.
-
November 10, 2020 at 20:22 #65713
Asser
ParticipantHi Petko,
You say: “That is not a glitch. The data from the app is one, it is bars.”
If that’s the case, great! But then, why do we have to synchronize at all?
As you put it in your course: Even professional traders forget to synchronize the data with their broker.You say: “It is about if your broker actually changes it or not.” (“it” meaning summertime to wintertime and vise versa)
I don’t understand your point, but I followed your instructions:– I adjusted the timezone of my PC to UCT.
– I downloaded a new MT4 demo.
– My PC time showed: 17:32 (when it’s actually 18:32 where I live)
– My broker’s time showed: 19:32
– So I opened a EURUSD H1 chart on MT4.
– On Historcial data App, I loaded data from the App with (GMT) in the settings (GMT=UTC)
– The Price chart of EURUSD H1 showed a bar of 10. November 2020 at 16:00
– My broker’s MT4 showed the same bar of 10. November 2020 at 18:00
– So I adjusted the App’s settings to GMT+2
RESULT:
– The Price chart showed now the same bar of 10. November 2020 at 18:00 (PERFECTLY SYNCHRONIZED)
BUT…
– Going back on MT4 to 14. July 2020 at 10:00 (there is a distinguished bar)
– The same distinguished bar is showing at 09:00 on the App’s Price chart (SYNCHRONIZING FAILED)My conclusion: Even though I don’t understand the point of changing my PC’s time zone to UTC and installing a new MT4, I did what you said and the problem remained the same.
Again:
If what you’re saying is that DATA IS BARS (meaning without timestamp), so why do we have to synchronize?
Am I over-synchronizing?What if my broker changes the time from summer to winter and back again (as do many brokers)? Does that mean that the Historical data App is safe as long as the broker doesn’t change the time? In which case, the historical data App only applies to a few brokers.
Still confused Petko!
Can you or anybody else explain to me (in simple words) what am I doing wrong?
Thank you.
-
November 11, 2020 at 5:19 #65714
Asser
ParticipantI get it now (I think) …
The most important thing is that charts in MT4 match the charts from Historical data App of the same time-frame.
The synchronizing must match with a RECENT distinguished bar.
When going half a year back in time, the charts still match but there may be a difference in the time stamp due to winter- and summertime. This difference SHOULD NOT affect back-testing.
If understand it right this time, and in order to maintain my sanity (sorry – I’m like 62,000 years old), I’ll have to partially (only partially) disagree with you when you say in your course:
Forex Trading with Expert Advisors + 30 Best Strategies (Every Month)
Lecture: Preparation
Video: The best solution for historical data
Timeline: 04:03“but before you download the data, you need to do something VERY-VERY important. You need to SYNCHRONIZE the time zone. Something EVEN professional traders are missing. They ask me why their back-test in EA Studio doesn’t match with the back-test in Metatrader. The reason for that is the TIME ZONE.”
Any comments?
-
November 12, 2020 at 12:27 #66007
Petko Aleksandrov
KeymasterHey Asser,
I will try to make it very simple for you:
If your broker doesn’t synchronize with your time and is changing summer to wintertime, you can do nothing. You can not set in the App from this to this date to be one zone, then from this to this date to be another zone, and do that for 13 years.
If you are with UTC, there will be no changes with winter and summertime, and if your broker synchronizes it with you, you will have the data matched because the DATA IS BARs – open, low, high, and close.
I do not get into these details in the courses because the difference of the backtest is so minimal even though a winter-summer change doesn’t worth the time to do anything about it.
I hope that makes sense.
-
November 12, 2020 at 16:29 #66197
Asser
ParticipantHey Petko,
Your explanation is indeed simple and clear. Thank you sooo much!
As you say: There’s nothing I can do about it because whether I set my computer time zone to UTC or to GMT+1, the discrepancy with summertime and wintertime is the same. Meaning my broker does not synchronize with me. So, as you say, I cannot set the App to be from this to this date to apply on one time zone and from that date to that date to apply on another time zone… Understood!
Now: Can I do the following with the “Data Horizon” function? (regardless the discrepancy in summer-/wintertime)
In stead of training on a demo account for weeks and months, I had the idea of testing 10 best strategies I generate every month from the beginning of 2020 and up to the end of October 2020. I was going to do so, by forcing (via Data Horizon) a start date and an end date of 3 years (not 5) up to every month of 2020.Here’s an Excel illustration of my plan if that’s easier to understand:
It should be doable since the historical data is one huge block of data (timeframes and bars) – only synchronized at the end – Right?
Have you (Petko) or anybody had the same idea? Is it a good plan or a waste of time – honestly?
Please comment, fellow traders! Don’t leave everything to Petko.
Thanks.
-
November 12, 2020 at 19:57 #66204
Petko Aleksandrov
KeymasterHey Asser,
It is very simple to what I show in some of the videos.
You can generate EAs for any period of time using the Data Horizon and then just recalculate the recent period’s strategies.
That is what works best for me, and I really do not need to trade many EAs on Demo accounts this way.
-
November 13, 2020 at 2:08 #66206
richard
ParticipantI do something similar. To test my ideas for example on H1. I use 5 years of data COT 5 and PF 1.2. I go back 5 years and 2 months. I set the data horizon for 5 years and exclude the last 2 months. I keep the reactors running until I have at least 300 strats and sometimes up to 2000… I then use the validator to “feed in” all my strats (the validator does not have the limitation of 300 like the collection does). I set the validator settings to something a bit broader like COT 5 and 2 consecutive losses. I then set the data horizon to 1 month ago so 1 month following on from the five years that the strats were created on. I then experiment with different filters on the collection tab. COT 5 – 10, sort by PF, WL ratios etc….. Then i select the top 5,10,20 and create the portfolio. Then change the data horizon to the last month and recalculate. Now you will see how your portfolio would have run in the last month with the previous months filters you applied. This gives you the ability to test 100’s of ideas and get a pretty good idea of how they will work in the future. Of course I am sure that this will not be quite as effective as running your ideas forward in actual time but it will let you know if you are on the right track. Because i have now created about 1000 strats for each of the 11 pairs that i trade i am setting the validator setting more stringently. Currently COT 8 and Losses in a row 1. This normally takes my 500 – 1000 strats to about 50 that meet the criteria for the month. From there I am finding the best ones are top 5 sorted initially by NB and then filtered by PF but I am still testing. I then run these top 5/10 forward on a demo with a balanced selection of currencies. So always the currency appears an equal amount of times: – EU, GU,GJ, EJ. that covers the 4 main currencies. I am now experimenting with adding AUS and CAD so You need 9 pairs to get even exposure: AC, AJ, EC, EJ, EU, GA, GJ, GU, UC. I have only just started to realise the power of the validator so I encourage to have a play with it if you haven’t already….
-
November 14, 2020 at 13:07 #66243
Asser
Participant@ MODERATOR
Is it possible to change the title of this forum topic
from:
Glitch in Historical data App
to:
Use of Historical data & Data Horizon
Thank you in advance.@ Petko
Of course it’s similar to what you teach in your videos. I learned almost everything I know from you!
Not only do you teach me how to operate EA Studio, you also teach me how to think! I’m so grateful for that.
Love your teaching methods, your spirits and your optimism.@ Richard
Thank you for showing me your own method. Very interesting and inspiring indeed.
I totally agree when you say:“This gives you the ability to test 100’s of ideas and get a pretty good idea of how they will work in the future. Of course, I am sure that this will not be quite as effective as running your ideas forward in actual time but it will let you know if you are on the right track. “
This is exactly my missing link to getting started as a newbie.
Ilan (our teacher and moderator) has already introduced me to the Validator, and I studied everything I found about this tool in EA Studio. But pointing out that the Validator is not limited by 300 strategies as do the Collection, was new to me. An eye opener. Thank you again Richard.
-
November 17, 2020 at 2:30 #66508
Asser
ParticipantHey Petko, Richard & everybody
@ Petko:
YOUR BEST, LATEST & EASIEST METHOD (condensed – in my words):
1. Create 10-25 strategies over 3 years of Historical data
2. Wait one month
3. Add the that one month to the Historical data
4. Recalculate everything and create a Portfolio Expert with NEW 10 best strategies
5. Run the Portfolio Expert with these 10 EAs on the new month LIVE
6. Rinse & repeat (without waiting one month)MY METHOD (inspired from and built on your method):
1. Create a Portfolio Expert with 10 best strategies over 3 years of Historical data
2. Wait one month
3. VALIDATE the Portfolio Expert with 10 strategies on that month ONLY (BEFORE adding that month to the 3 years)
so that we can see what would have happened if we run them LIVE on that same month
4. Now we add the last month to the historical data (and subtract one month from the beginning of the historical data
to keep the period length of 3 years constant)
5. RECALCULATE and CREATE a NEW Portfolio Expert of 10 best strategies
6. Run the Portfolio Expert with these 10 EAs on the new month LIVE
7. Rinse & repeat (without waiting one month)Is my method useful or full of holes?
Please comment!Thanks.
-
November 17, 2020 at 3:39 #66509
richard
ParticipantSo if I read it correctly you are ultimately creating your portfolio of 10 from the 3 years of data. Of course at the end of the day you have to practice and find your own system. Which you are doing…. I prefer to create the strats leaving off the last month. Then run them on the last months data. And then select my top 5/10 based on the last months performance. In my mind that means that the strats have proved themselves over 5 years to be profitable and they have also proved themselves to be profitable in the last month. Because I use very stringent criteria they will be consistantly profitable over the whole of the month without any significant dips in the equity line…..
Example attached: Here I feed in over 1000 strats created over 5 years of data. Then run them over the last month. You see only 146 pass the criteria for the month. This is currently set to COT 8, Losses in a row 1. When I was only feeding in around 50 – 100 strats before I had to use much lower criteria to get enough strats to pass. (COT 5, Losses in a row 2. ) As I get more and more strats to feed in the tighter I make the
criteria.
-
November 17, 2020 at 3:42 #66510
richard
ParticipantThen bring up the PF till I get the best 10. Create portfolio:
-
November 17, 2020 at 3:45 #66511
richard
ParticipantThen I end up with some pretty good looking strats into the portfolio:
-
November 17, 2020 at 3:50 #66512
richard
ParticipantSo this is my latest way of doing things. I don’t think you ever should stop evolving your systems. Because I feed in so many strats to get my top 10 / 5 (I am actually starting to find the top 5 more profitable lately…..) I also have started playing with the correlation %. I bring it up from the standard .98 to .90 to ensure that all my strats are significantly different from each other. More diversity within the portfolio.
Anyway it is good to see you experimenting with different idea’s based on what you are learning here. This is what I do as well. Good luck….
-
November 17, 2020 at 4:44 #66513
Asser
ParticipantAlways happy to read your wise comments Richard. Yes, I’m experimenting with a few ideas. But now, I’m even more inspired by your thinking which I’ll certainly take into consideration.
My current plan is to turn everything into a routine – which (as you point out) always will have room for improvement. I’m getting closer to my goal everyday.
My theory (always based on Petko’s teachings) is to work with a Portfolio EA of 10 (will maybe move to 5 inspired by you if it works for me), because I could see the equity line of 10 strategies united into one PF EA equity line – almost regardless the weaknesses of each individual strategy because they complement each others.
Imagine if I could routinely turn creating a PF EA of 10 each month and run them live because I’ve tested them enough times with simulation. My current idea is NOT to use old EAs and validate them, but create 10 COMPLETE new EA each month. That would be my dream… But first, I’ll have to satisfy myself with enough successful simulations. In my view, that’s better than demo-trading.
Regarding playing with the correlation %:
Great idea. However, are you sure that .90 is stead of .98 will give you more different strategies? I’d think the opposite is true (but I could be wrong).Thank you Richard & good luck to you too.
-
November 17, 2020 at 5:34 #66514
Asser
ParticipantMy current goal (if it holds) is to set up a routine (a system) consisting of creating 10 NEW Portfolio Expert Advisers (PF EAs) each month, so that I avoid uploading old strategies and recalculate or validate them, making the routine a tad simpler. I’d rather avoid demo-trading but having enough successful simulations would be similar to demo-trading in my view.
-
November 17, 2020 at 5:40 #66515
Asser
ParticipantPetko’s demonstration of how 10 EAs work together in a PF as one EA with a pretty good united equity line (because they complement each other’s drawdowns) inspired me to focus on creating exactly PF of 10 EAs. I could narrow down to 5 PF EAs, inspired by you, but I must have enough successful simulations prior to doing that.
-
November 17, 2020 at 5:50 #66516
richard
ParticipantHi Asser. This is what Popov says regarding the correlation setting:
(Hope it is OK to copy and paste his remarks here….)
“The Correlation shows how equally trade two strategies. It compares the Balance lines of the strategies for the complete testing period.
A correlation coefficient of 1 means that two strategies have absolutely equal balance lines. It is possible to have strategies with different trading rules to rise very similar signals and we want to eliminate such cases.
When the Correlation analysis is on, it checks every strategy pushed to the Collection against all other included strategies. If the program finds that two strategies has correlation greater than the set value, it marks them as correlated. EA Studio removes the strategy with the the lower profit in such cases.
For example, a Correlation Coefficient of 0.96 means that the strategies differ by 4 percent.”
This week I am running some side by side tests to compare .9 vs .98 correlation…. At this stage .9 is about 20 – 30 % more profitable then .98 and tends to open approx 20% more trades, but early days yet obviously……
The top 5 vs top 10: Top 5 seems to out perform Top 10 by about 30% across a dozen test variations I have run over the last 3 weeks…. (this means that you are doubling position size on the top 5 obviously to give you the same margin % / risk as the top 10.)
Without getting to far ahead…… You might want to look at lot size for each pair regarding ADR. I am running some tests with fixed lot size (.03) vs variable (.01 – .08) depending on expected return for the week from each portfolio of 10. Again I am always looking for balance and smooth equity line. So that each pair is delivering a relatively even contribution to the overall system regardless of ADR…..
-
November 17, 2020 at 9:36 #66521
Ilan Vardy
KeymasterHey Richard,
This is really useful information for generating strategies.
Thank you!
Ilan
-
November 17, 2020 at 10:46 #66524
Asser
ParticipantUseful information indeed. What a great guy Richard is to share his thoughts in a very comprehensive manner. Thank you Richard.
-
November 17, 2020 at 11:42 #66526
richard
ParticipantYou’re welcome……
-
November 18, 2020 at 0:21 #66717
jbcdk
ParticipantHi Richard,
Thank you very much for sharing your thoughts and ideas, it is very useful and helpful, as well as very inspiring. When you start the reactor to generate EA’s and first stop after maybe 300 or 2000 EA’s, do you then also use robustness testing eg Monte Carlo, and how long are you about to generate eg 1000 EA’s ?
Thanks
-
November 18, 2020 at 10:58 #66727
richard
ParticipantYes I always use monte carlo as Petko teaches…. Set it to run within the reactor. The reactor can hold a maximum of 300 into the collection. I run up to 10 reactors at a time. 6 on one PC and 4 on another. I run them continuously at times and it has taken weeks and maybe months to get the number of strats I am talking about. Of course there will be a point when it is no longer a benefit to keep adding more and more strats and may even have negative effects…… I don’t know yet. I just keep running multiple side by side tests all the time to identify any consistent edges that I can add to the system….. I would probably just stick with 4 pairs like the EURUSD GBPUSD EURJPY GBPJPY if you are fairly new….This will give you the 4 main pairs evenly traded. (Each currency appears twice each) Create a few 100 strats for each pair and then experiment on how you will filter them to say a top 10 of each. Then trade all 40 together on one MT4. One of the key things I have learnt from Petko and my years of manual trading before coming here is to keep the currencies balanced for each MT4….. One of the bigger questions I have pondered lately is do you filter the trades more thoroughly initially and then possible run them for a shorter period of time (1 week) or do you not filter them so stringently and let them run for say a month but then apply some filtering as you go along to cull the poor performers…. If you have read through my posts in the last month I feel more comfortable creating a large amount of strats, filtering them more stringently and then let them run for 1 week. I am aiming to start them Monday morning and then shut them down at the end of the week and be out of the market over the weekend. I will have to see how I go……. Without getting to philosophical I believe that you have to ultimately make your own system that aligns with your personality. Any way enough ramblings for now……..
-
November 18, 2020 at 13:12 #66728
Asser
ParticipantAlways nice to hear (read) your method of thinking Richard.
Only now I understand why and how you’re gathering so many strategies over time. Nice tactic!I am systematically testing the exact 4 pairs you mention but I’ll be testing XAUUSD (gold) and XAGUSD (silver) as well.
Will use two computers: One with 16 GB RAM and another with 32 GB RAM.
I’ll be running a the live accounts on my new laptop. The idea is that the laptop will continue running on battery in case of power failure, provided Internet connection is still working.Started with Tools > Settings where I chose $1000 as initial account and 1/500 leverage (since my broker allows it).
In Generator, I chose an “Entry lot” of 0.03 since I’ll be using 4 pairs and 10 EAs on each pair.Regarding Historical data:
My two brokers delivered excellent data via EA Studio Data Export Script.
One broker delivered 33-58 months of data (M15, M30 & H1) and the other delivered 16-29 months of data for the same TFs (Timeframes).
I checked the accuracy of the data, they had a max. days off of 2 & 3 (better than Dukascopy. Not for longer period, but long enough)
Decided to stick to the scripts (in stead of Historical data App) because I’d save adjusting the data using Symbol Settings and avoid entering wrong values.I also noticed that one broker has normal commission (about $7.5 per lot on gold and silver) and the other has ZERO commission on gold and silver. So I’m excited to test the profits on gold and silver there.
Started by running the Reactor for 10 minutes with almost no criteria & no robustness to see how many strategies I can get.
Then I increased the working time to 30 minutes with more stringen Acceptance criteria & Monte Carlo.
30 minutes was enough to test-generate strategies and filter them down to 10 strategies which I added as a PF-EA (Portfolio Expert Adviser).
Recalculating the PF-EA gave me a pretty good idea about what kind of profit I’d expect per day and per month.If and when all goes well, I’ll let the Reactor run for many hours and thus create solid strategies with confidence.
-
November 19, 2020 at 6:29 #66733
richard
ParticipantSounds good……
-
May 21, 2021 at 15:48 #88226
SteveM2030
ParticipantHi Petko, can you advise if it is possible to merge JSON files to create an ongoing historical data set? For example: When I download M1 data from my broker, I can get about 65000 bars, which covers about 2 months of trading. I did this on 26th April and so was running the generator against M1 data covering approximate 24th Feb to 26th April (I forget the exact start date). However this week I wanted to update my data, so I followed the same process to export it from my broker, loaded it into EA Studio, but the new 65000 bar data set was covering 18th March to 18th May, so I “lost” 24th Feb – 18th March. Is there any way to ensure EA Studio keeps and stores previous data uploads with older trading data? Clearly this questions only really relevant for higher timeframe data – M1 and M5 perhaps. Thanks
-
May 27, 2021 at 0:22 #88712
Petko Aleksandrov
KeymasterHey Steve,
Actually, the 65 000 limitation comes from MetaTrader and not from EA Studio.
In most of my algo trading courses, I explain how to solve it but I have some youtube videos as well:
The solution is after 4:30 minute.
-
December 3, 2021 at 11:47 #101530
Paul Jervis
ParticipantHi Guys/Girls
I’m trying to import historical data into MT4, I have used the Forex historical download to export the data but i am having trouble importing and seeing it in MT4.
Ive also tried the expert Advisor studio but again this is not working for me.
Any advice would be much appreciated .
Thanks in advance
M
-
December 9, 2021 at 8:35 #102937
Petko Aleksandrov
KeymasterHey Paul,
Please, have a look at all the videos on this page:
have shown it all step-by-step.
-
October 25, 2022 at 12:43 #128843
Gerhard du Bruyn
ParticipantI bought the course called: ” Trade the 12 Forex Robots I Trade Live” Im trying to export Historical data to my MetaTrader MT5 .There is no historic center on MT5. What do I do?
-
October 25, 2022 at 12:43 #128845
Gerhard du Bruyn
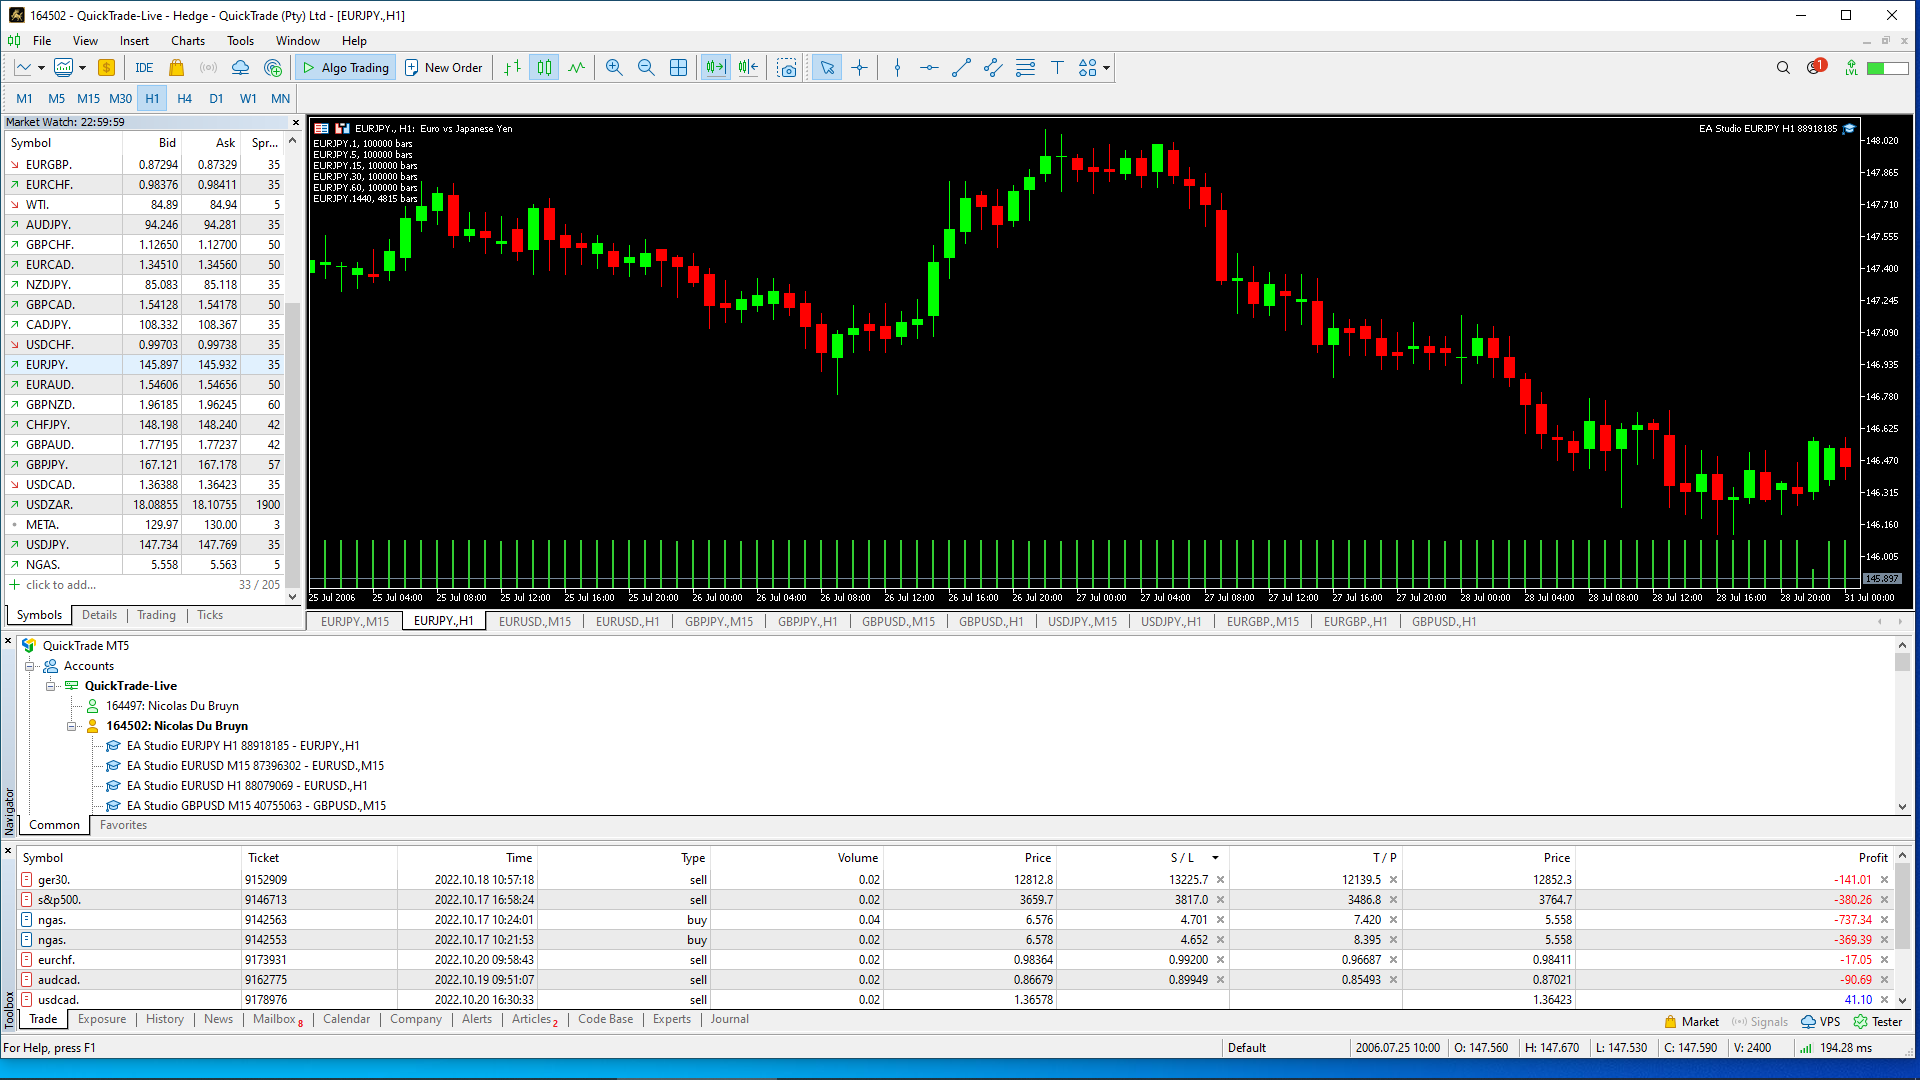
ParticipantI loaded a few EA robots on MT5 because my broker supplied enough historic data. I want to know if I did it correctly. Please look at the picture
-
October 25, 2022 at 12:48 #128917
Samuel Jackson
ModeratorHi Gerhard,
Things look loaded correctly to me. Can you be clearer with your concern please?
Also it looks like you are trading live? Is this correct?
This would not be advised if it is your first time trading these robots so I give the -live server does not mean real money
-
May 21, 2023 at 21:14 #171733
Thorsten G.
ParticipantHello,
can someone help me with the correct values for GOLD to the Data Export script (V. 4.5) ?
I’m not sure which data I can find exactly where. I use an ICMarkets raw spread account.https://ibb.co/j4Pb4gK https://ibb.co/6vMNSjD
Thanks a lot!
Thorsten
-
May 21, 2023 at 21:16 #171739
Thorsten G.
Participant -
May 21, 2023 at 21:20 #171754
Alan Northam
ParticipantIf you are looking for the data files for XAUUSD go to: File>Open Data Folder>MQL4>files
-
November 9, 2023 at 3:42 #210974
Bkennedy74
ParticipantI notice you have eightcapEU live as a datasource, if this is the broker I am using and I export the data, wouldn’t the data be identical? And therefor not need to go through the process of exporting data for each currency pair/crypto pair I want to run ea’s on?
-
May 20, 2024 at 7:07 #255843
Marin Stoyanov
KeymasterHi Bkennedy74,
You’re right, it should be identical.
Have you tried it?
How are the EAs working for you with that data set?Warmly
Matt -
June 9, 2024 at 18:27 #260344
timaddamz
ParticipantHi, I followed the video on how to export the historical data. I am using blackbull markets for my demo. This is 3 hours ahead of GMT in my Metatrader. So I have set it 3 hours ahead and loaded the data. When I compare the price chart against Metatrader as per the video it is still 3hours behind. It has not changed the timezone in the historical data app.
Can anybody help?
-
June 14, 2024 at 11:47 #261162
NIKOS KYRIAKOU
ParticipantHey timaddamz,
From what I can understand is that this might be happening as the historical data is set to GMT +0 by default and probably this is the reason you see the difference.
Kind Regards,
Nikos -
October 10, 2024 at 14:59 #314923
Goestaf Paul
ParticipantIt is supposed to be updated to coincide with your broker data. It does not. Up to the hours you can easily adapt the data by just moving everything 3 hours up/down, but that does not work for 4h, 1D. That data will then have to be reworked from hourly data. I do not think it is worth my while.
-
October 27, 2024 at 14:56 #373593
Vince
ParticipantHi,
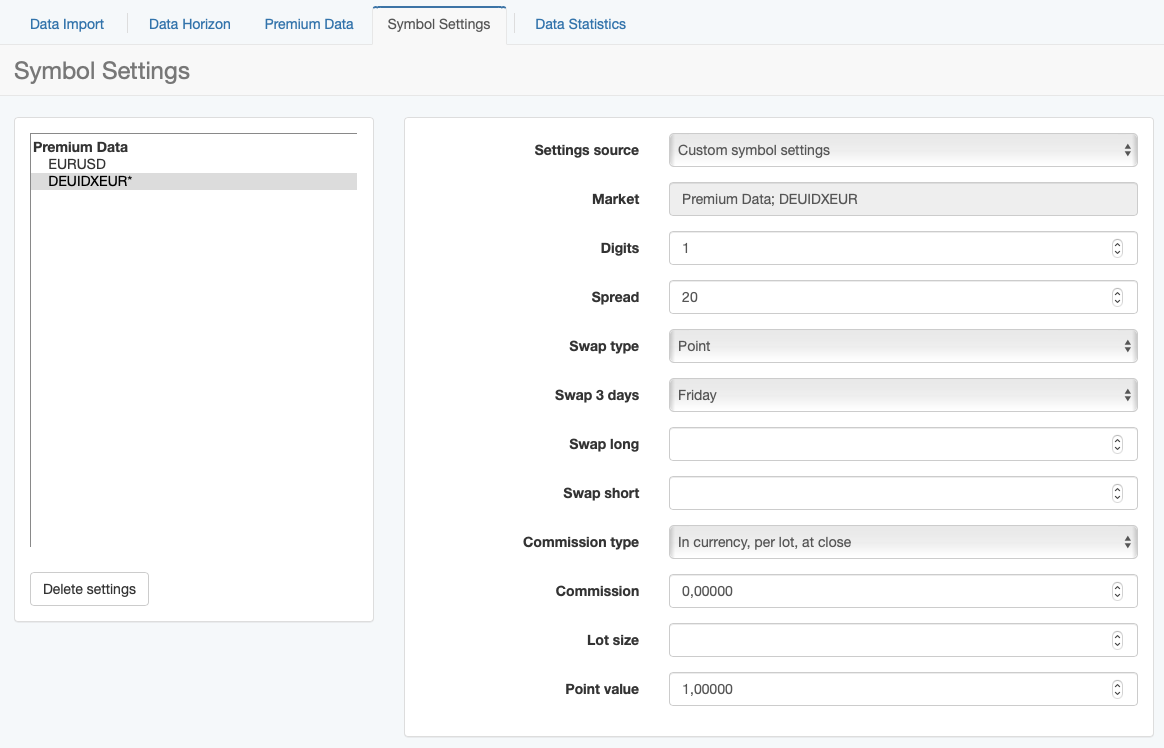
I have already used half of my trial period in EA Studio and still can’t use it properly because I’m stuck on data settings, especially to customize the settings for indices such as DAX. I use the broker IG and I do not find the useful information in the specifications. I have already been able to fill some sections of the symbol settings (EA Studio), but I don’t know for swap (long & short). With what numbers to fill? I do not know what to put for lot size also, I do not understand what is asked here? It is much simpler compared with FTMO for example, where you can read directly these data in the specifications section. Could you please help me?
-
January 26, 2025 at 18:34 #428272
Alan Northam
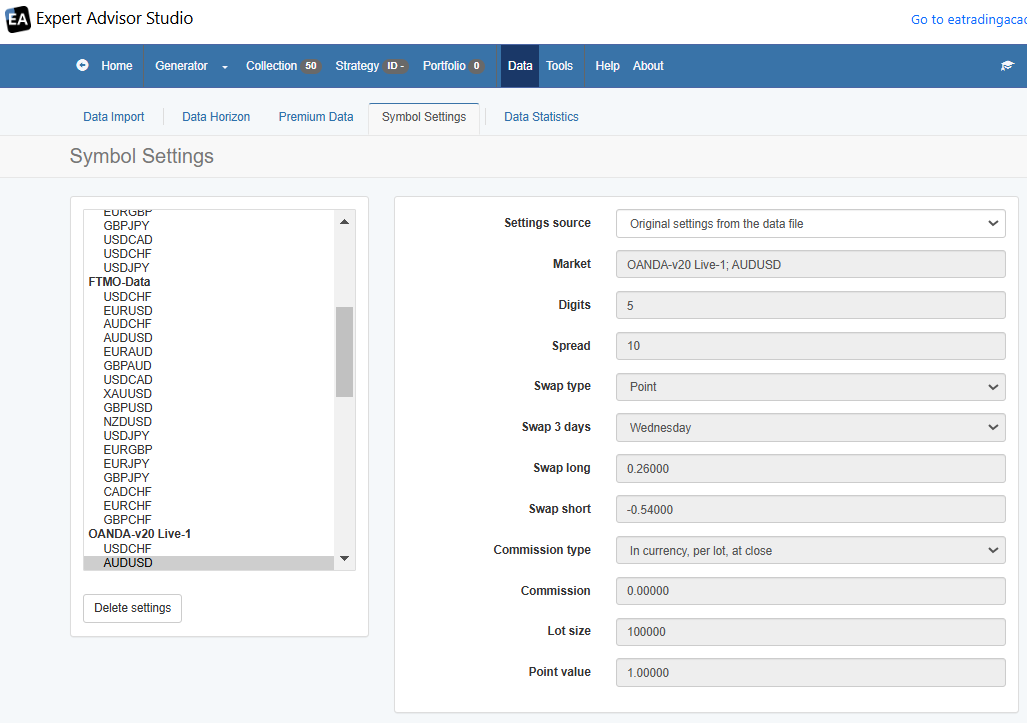
ParticipantClick on Data>Symbol Settings. See example below!
Alan,
-
January 26, 2025 at 19:28 #428284
Vince
ParticipantHello Alan. Thank you. But this is valid for a very specific case (Oanda and for forex). My question concerns the specific settings for IG broker and precisely indices like the Dax :)
-
January 28, 2025 at 11:42 #428585
Alan Northam
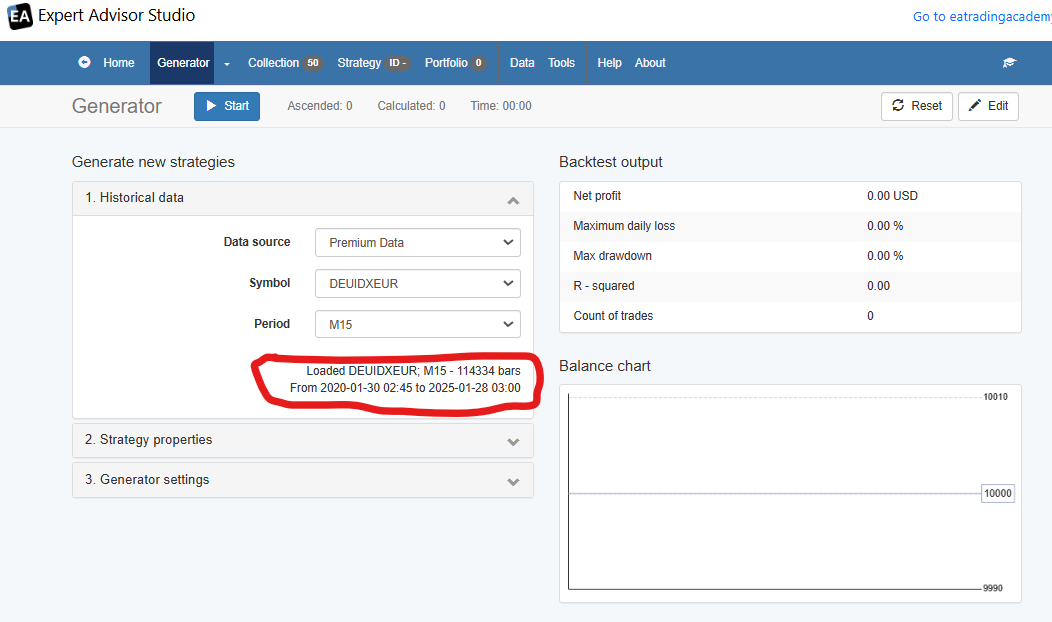
ParticipantGo here first and make sure data is loaded!
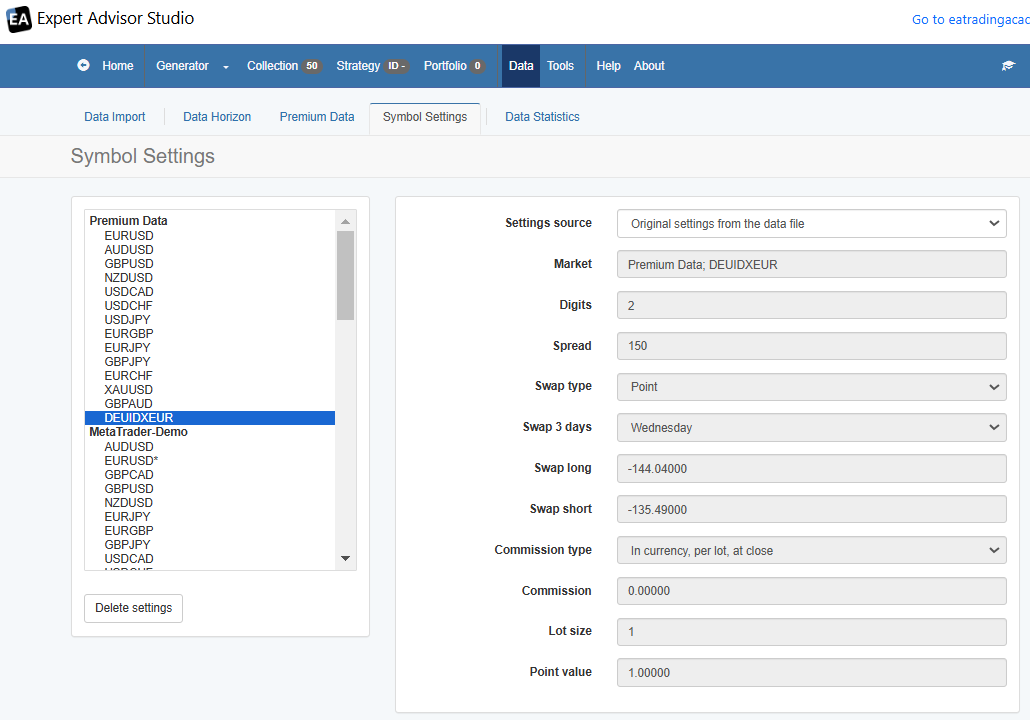
Then go here!
Alan-
-
-
-
AuthorPosts
- You must be logged in to reply to this topic.

