Home › Forums › Live Trading Results › Challenges › Ongoing Challenge: 10 EAs from EA Studio › Reply To: Ongoing Challenge: 10 EAs from EA Studio
Hi Traders,
WEEKLY REPORT
Week of May 5, 2024 through May 11, 2024. The following are the twelfth week results of trading 10 Expert Advisors (EA) I created using EA Studio. These Expert Advisors are being traded on my Infinity Forex Fund (IFF) 100K Algo One Step Evaluation account. I analyzed the results this week using FXblue where I sorted this past one week trading results by sorting the “Net pips” column from most pips gained to most pips lost this past week. I then looked at the Net Profit column to determine profits and losses for the week. The following are the results along with the changes made for trading next week:
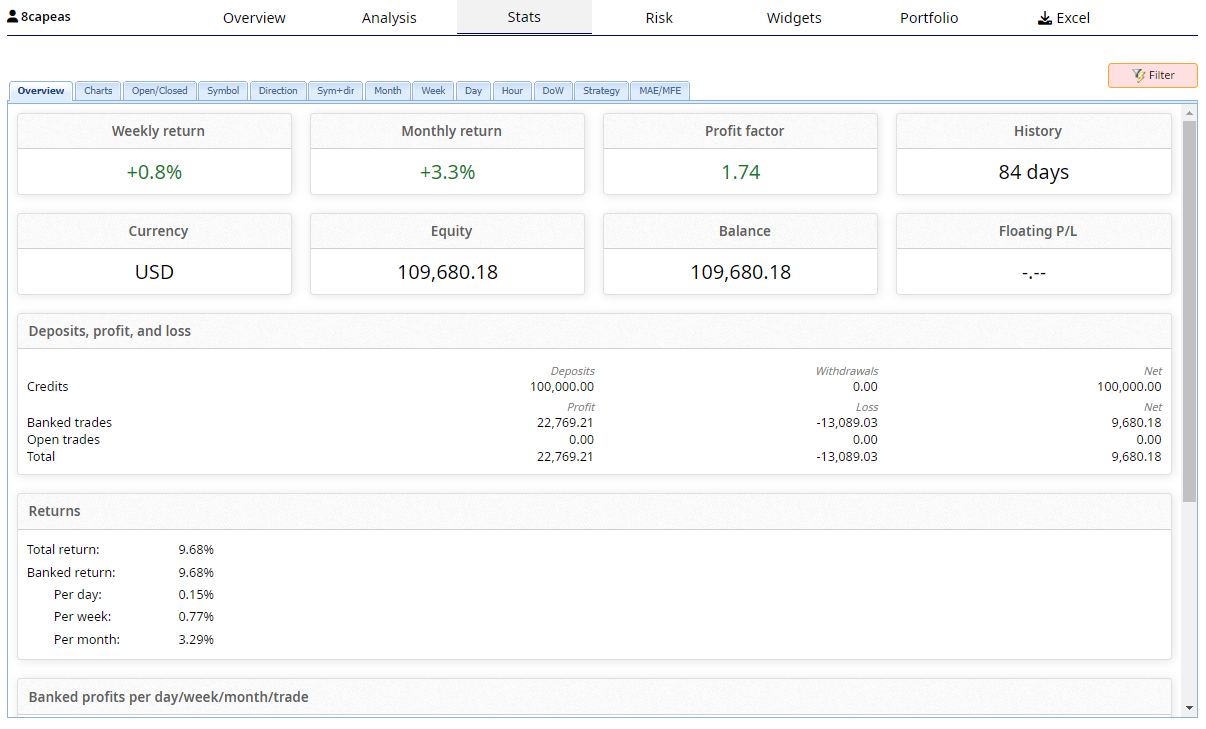
This past week ended with a profit of $1.91 and an account balance of $109,680.18. The price target to become a funded account is $110,000. To reduce risk of this next week of significantly drawing down this account, since it is so close to hitting the price target and becoming funded, I am going to continue to limit the risk to the account to 1%.
There were six profitable currency pairs this past week having a profit factor of 1.2 or greater. However, two of the pairs, NZDUSD and EURGBP, will not be traded this next week because over the last twelve weeks they produced an overall loss of -0.08% and -0.01% respectively. I will adjust the lot size of each of the four currency pairs I will be trading this next week to have an account risk 0.25% for a total account risk of 1%. The other six currency pairs will have their lot size adjusted to 0.01 lots.
USDCAD(+4.04%): 0.80 Lot size
USDJPY(+1.020%): 0.39 Lot size
EURUSD(+1.94%): 0.32 Lot size
USDCHF(+0.85%): 0.41 Lot size
AUDUSD(+0.93%): 0.01 Lot size
GBPUSD(+0.52%): 0.01 Lot size
EURJPY(+0.28%): 0.01 Lot size
EURGBP(-0.01%): 0.01 Lot size
NZDUSD(-0.08%): 0.01 Lot size
GBPJPY(-0.14%): 0.01 Lot size
Note: The percentages in parenthesis show the percent gain of each currency pair over the last 12 weeks.
This first chart shows the trading results for this past week:
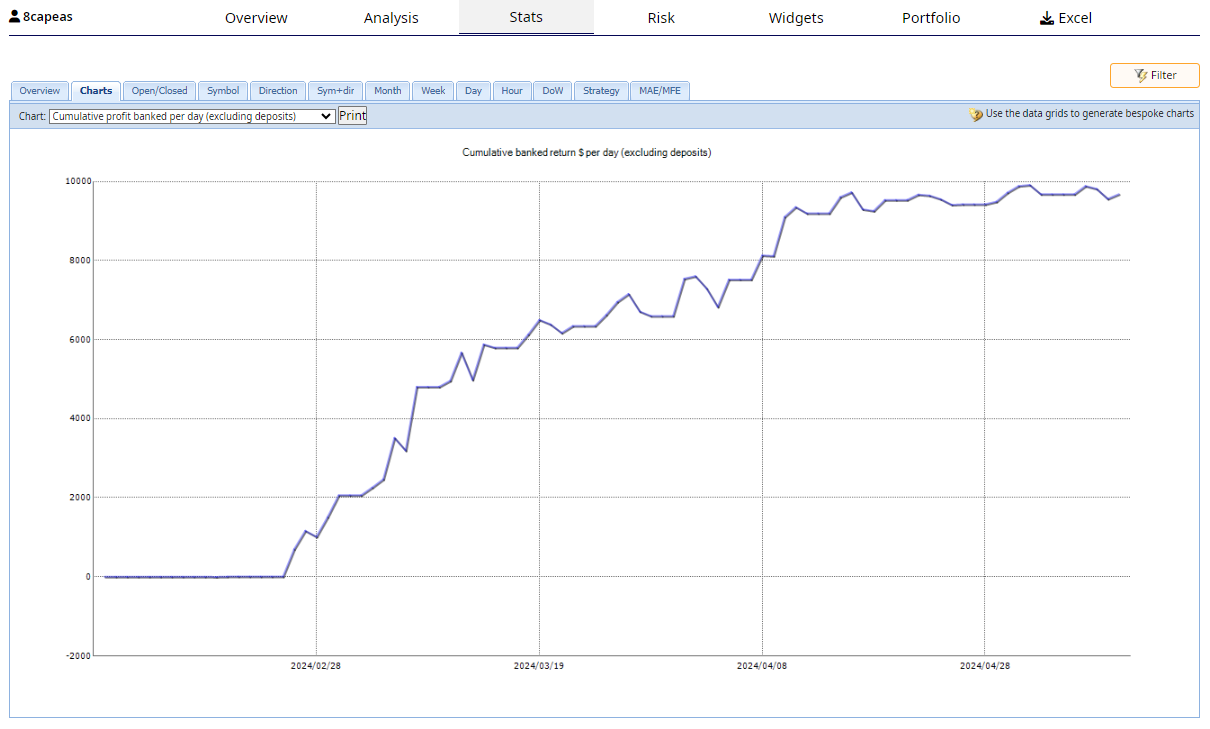
This chart shows trend line of the cumulative profit since inception:
This chart shows the statistics of this account since inception:
This chart shows 11 of the last 12 weeks of this Evaluation have been profitable:
Alan,


