Acceptance Criteria
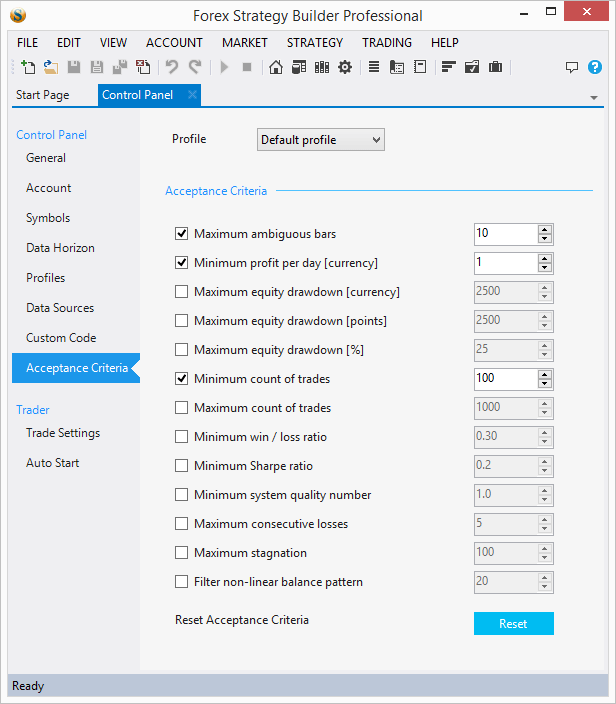
You can open this page from the Control Panel → Acceptance Criteria
The Acceptance Criteria are widely used in FSB Pro (Generator, Optimizer etc.). Those are minimal requirements for the strategy.
Each time the program backtests a strategy, it also computes if it passes the Acceptance Criteria. You can easily see in the Strategy Statistics if the strategy fulfills the acceptance criteria. If it did not pass the Acceptance Criteria – the row of the table would be orange, so it is easy to notice.
Maximum ambiguous bars (default: checked; 10) – the strategy has to have equal or less than 10 ambiguous bars
Minimum profit per day (default: checked; 1) – it should profit at least one USD or EUR per day. If you disable this option, the Generator and Optimizer will show strategies with negative profit.
Maximum equity drawdown [currency] – the account equity should not go below the given value of the account’s currency
Maximum equity drawdown [points] – the account equity should not go below the given value in points
Maximum equity drawdown [%] – the account equity should not go below the given percent value
Minimum count of trades (default: checked; 100) – how many trades should be at least in the backtest. This is important for the Generator and Optimizer, so the backtest statistical data is “realistic”. If there are too few trades, the parameters below might have good-looking values, but at the same time, harm your profits. For example, if you have a win/loss ratio of 1.0, it is great, but if the trade count is only one, this strategy not one you can rely on.
Maximum count of trades – you can set a number here, to make sure the strategy is not over-optimized. You can also avoid losing money on the spread by trading less.
Minimum win/loss ratio – The win/loss ratio is:
( (number of profitable trades) / (number of profitable trades + number of losing trades) )
Its value might vary between zero and one. We advise that, if you are using this requirement, keep the “Minimum number of trades” and “Minimum profit per day” requirements enabled too.
Minimum system quality number – “SQN measures the relationship between the mean (expectancy) and the standard deviation of the R-multiple distribution generated by a trading system. It also adjusts the number of trades involved.
Maximum consecutive losses – how many consecutive losing trades can the strategy have
Maximum stagnation – the maximum amount of consecutive days where the strategy is not making a profit. The stagnation is marked with a vertical orange-background zone in the Portfolio
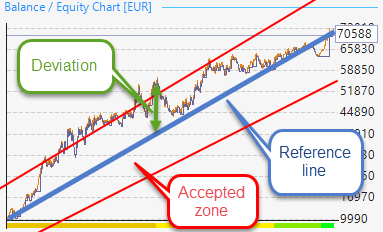
Filter non-linear balance pattern – on the picture below. The Reference line is an ideal line, which represents how the strategy’s balance should move up in ideal conditions. This is, of course, impossible. The line deviates from the Reference line. This parameter (the non-linear balance parameter) represents how far away the real balance moves from the Reference line. For example, if the parameter has a value of 20%, each of the points of the balance line, should not deviate more than 20% (up or down) from the value of the reference line for that bar. If the strategy’s balance line moves further than 20% of the reference line, the strategy does not fulfill these criteria.
You can create the following criterion: A line with a given direction with minimal fluctuation of the balance line. In other words – to test if the strategy makes regular profits, whereas its balance does not fluctuate much.
- Use the “Filter non-linear balance pattern” criterion
- To define the steepness of the line set the “Minimum profit per day” criterion
Those two actions will assure the strategy will make profits throughout the whole period of the backtest without fluctuating too much.
The Reset button will return all options to their default values.


