Forum Replies Created
-
AuthorPosts
-
Ricky Suen
Participant
I did another experiment. According to your suggestion, I used 3 years of data for training, 10% OSS and the trading period is one month. To avoid focusing on one type of market condition, I spread the trading periods between 2019 to 2023. The trading periods are separated by 4 months. In addition, I added Monte Carlo simulation for the market variations to increase the robustness. The result is shown above.
It seems that the result has no improvement. Do you know what is going wrong?
Ricky Suen
ParticipantI am also very curious why the result is so strange. If you generated a group of profitable strategies for the period 1 to period n, you expect that the group of strategies is also profitable in period n + 1. Or at least they are not losing. It seems that this assumption is not true. If the profitability of a strategy in the past is not related to the profitability in the future, what is the point to do backtesting?
Ricky Suen
ParticipantI understand that I can try all the combinations to see which ones are profitable. But I want to know if there is any before starting a full scale testing. My approach is just using the historical data to generate strategies and to use them in the next week or month. It is quite simple and straightforward. May I know if anyone had used this approach to get profit consistantly? If so, could you share the combinations they are using?
Ricky Suen
Participant
Sorry that I have taken a short trip so I cannot respond to your reply promptly.
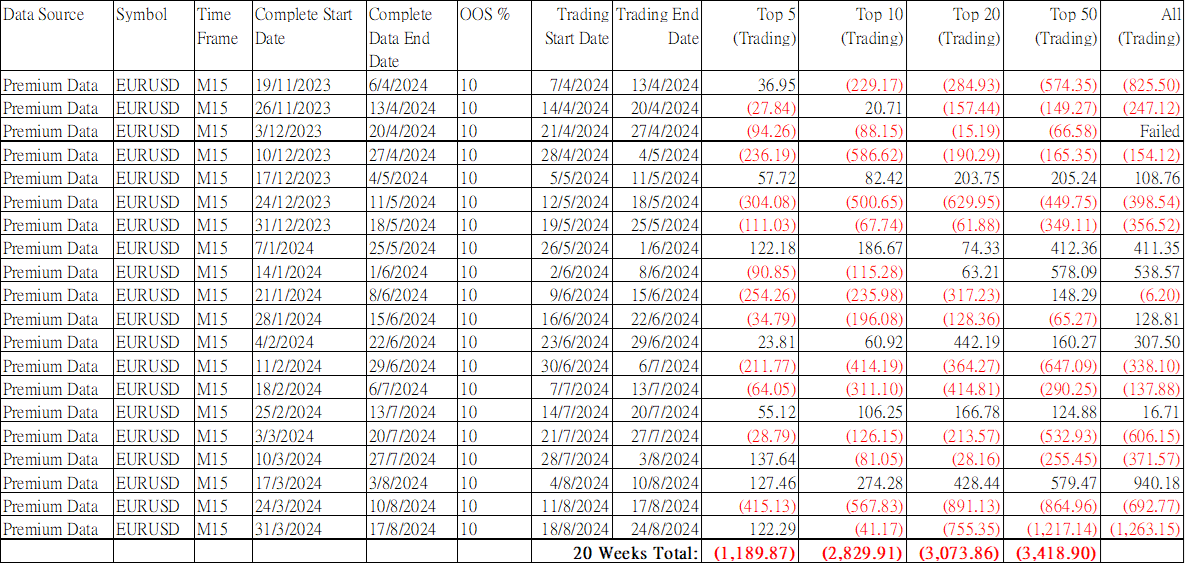
Nevertheless, I tried your suggestions and did an experiment. For the generator, I set the data horizon to 20 weeks and used 10% for the OOS which is about 2 weeks. The max entry indicators and max exit indicators are set to 4 and 2 respectively. For the round 1, I used the historical data of 19/11/2023 to 6/4/2024 (totally 20 weeks) to generate 100 strategies from EA Studio. Then I selected the top 5, top 10, top 20, top 50 and all strategies for trading in the next week. The results are recorded. The same process was then repeated 20 times for the subsequent weeks. The table posted above shown all the recorded results.
I cannot use 3 to 5 years for the generation because it will make the OOS period too long.
You can see that most of the trading results are still losing. May I know if you have any further suggestions to improve the result?
Ricky Suen
ParticipantThank you for your effort, Alan. I am sorry that I have already bought the EA Studio so I can also give you a verbal credit here ;). If I do not misunderstand, you suggested my using a longer period for the training and applying the strategies in a longer period. Both of the training period and the trading period should contain trending durations and ranging durations. I will try this approach in my setup to examine the result. Thanks again.
Ricky Suen
ParticipantWhy did I still get negative result?
Ricky Suen
Participant
Ricky Suen
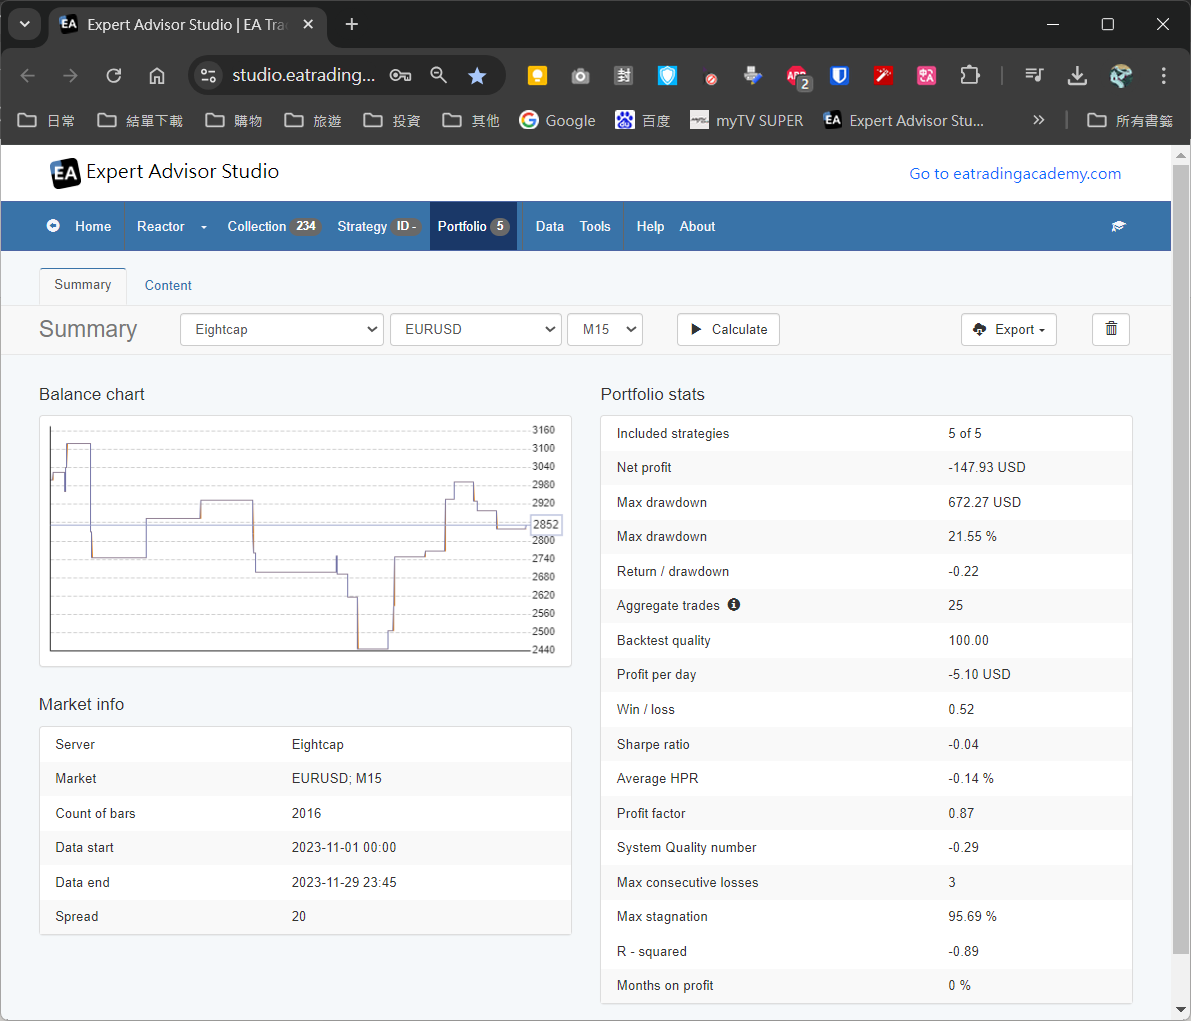
ParticipantAlan, could you change the data horizon to 1 Nov 2023 – 31 Nov 2023 and recalculate the portfolio?
Ricky Suen
ParticipantYes
Ricky Suen
ParticipantThanks for your prompt reply, Alan. I think I need to use an example to show my idea. Let me set up a reactor with the data horizon of 1/6/2023 – 31/10/2023, OOS = 40%, min. profit factor = 1.2. After execution, 23 strategies are collected.
Then I add the top 5 strategies to the portfolio and check the result. The net profit is 1233.18 which is normal.
To check how the strategies perform in the next month, I changed the data horizon to 1/11/2023 – 30/11/2023 and click the “Calculate” button in the portfolio page. The net profit became -39.82. It means that the generated strategies is losing in the next month.
I checked many symbols, time frames and data horizon, the negative profit is more common than the positive. So it means that I cannot rely on the strategies generated from previous months. Is this conclusion correct or I am doing something wrong?
Ricky Suen
ParticipantI think your method only means that you split the historical data into two sets and perform backtest on each of them. You assume that if these two sets pass the backtests, it will perform well in the future.
I want to use the historical data to prove if it is true. My method is: (1) Set data horizon to 1/6/2023 to 30/9/2023 (4 months); (2) Generate the strategies using EA Studio; (3) Add the top 5 strategies to the portfolio; (4) Change the data horizon to 1/10/2023 to 31/10/2023 (next month); (5) Recalculate the portfolio; (6) Advance the data horizons by one month and repeat the process ten times.
Since all strategies generated in step (2) are profitable, I expect that the result from (5) (i.e. next month after the sample data) is also profitable on average. However, the result is very disappointing. The average is losing. It means that if I used the generated strategies in the past, I would be losing money.
May I know if my testing is meaningful? Why the result is negative? Has anybody tried to perform similar tests and got positive results?
Ricky Suen
ParticipantHello, all. I am a new comer to the EA Studio. I have experimented a lot with the software but cannot find any consistantly profitable strategies. To find the strategies for a past month, I use the historical data of n months before that month. Although the strategies are profitable for the n months, when I apply them to the target month, they become losing. I tried a lot of symbols, time frames, acceptance criteria, robustness testing but the result is the same. May I know if anyone here can generate strategies which are consistantly profitable? What is your setting? Have you performed the same testing as mine?
Ricky Suen
ParticipantIt is very unpredictable. I randomly select many combination of data sources, symbol and period and they worked sometimes and failed the others. I cannot find the success and failure patterns.
Ricky Suen
ParticipantIt is still not working.
-
AuthorPosts
