Home › Forums › Live Trading Results › FX Blue results › Removing Strategies with Losses

- This topic has 7 replies, 1 voice, and was last updated 5 years, 7 months ago by
 Petko Aleksandrov.
-
AuthorPosts
-
-
January 19, 2020 at 16:59 #35337
facundo
ParticipantHi,
I am using FXblue to evaluate the strategies that are profitable and giving losses. How many trades you think I should consider per one strategy to evaluate if it makes sense to remove them or not?
I started on 1st january with AUDUSD and I have now some strategies did 2 trades 2 losses. Do you recommend me to remove them? Or shall I wait until I do more trades?
thanks
Facundo
-
January 19, 2020 at 22:54 #35366
 Petko AleksandrovKeymaster
Hello Facundo,
I would wait to see at least 5 trades. And what I normally do is not to remove strategies from the Demo account where I test the EAs.
I put in the live account the Top EAs, for example, having Profit Factor above 1.2 and min count of trades 5. but I keep trading the Demo account. Because some strategies that are losing at the beginning will turn out to be positive. And there might be potential in them.
-
January 20, 2020 at 13:53 #35415
facundo
Participantthanks. Good tip
-
January 27, 2020 at 10:40 #36129
 AndiMember
A good idea is to keep looking at different periods – last 1 month, last 2 weeks.
Because some strategies might be in a loss for some time and in order to get over the 0 will take you a lot of time. But if you look at the last 1-2 weeks you will see it faster getting on profit.
I am not sure if I wrote it clearly :)
-
February 2, 2020 at 9:33 #36532
 SimonParticipant
When would you get rid of a strategy entirely?
Some strategies just need a little time to perform well, but others just do terribly, what criteria would determine that a strategy just be deleted?
A PC can only handle a particular number of instances of MetaTrader, so it seems like a good idea to know when to free up space by getting rid of bad strategies?
-
February 2, 2020 at 23:26 #36603
 Petko AleksandrovKeymaster
Hi Simon,
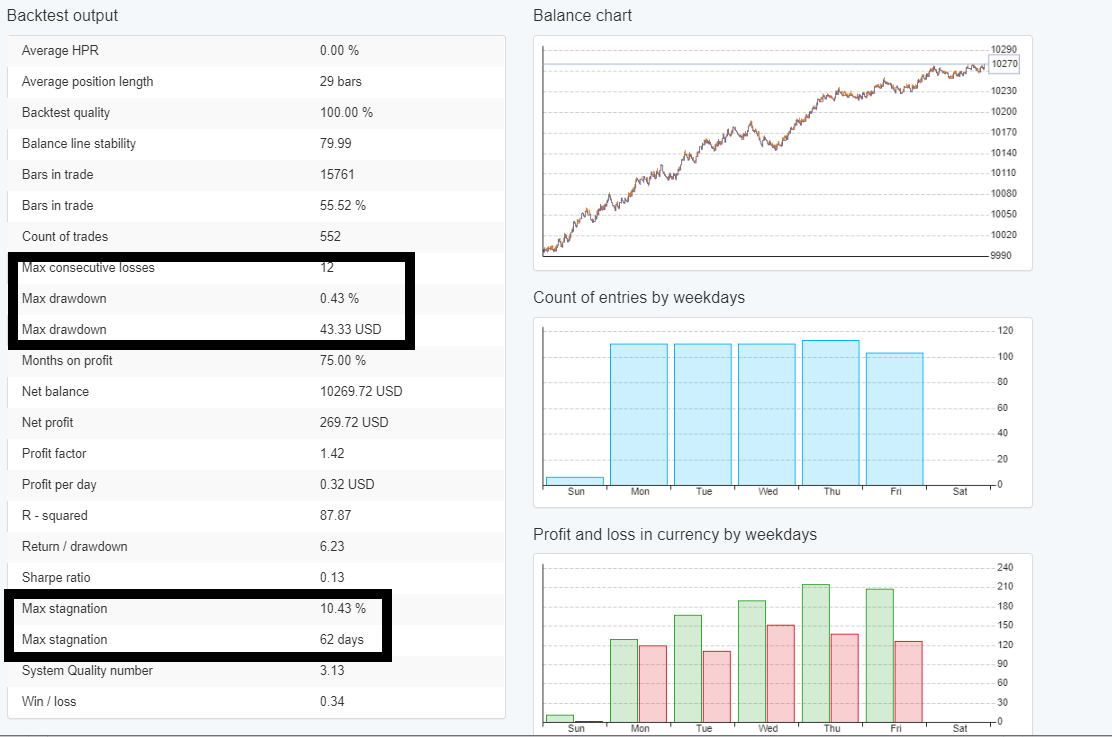
I get rid of strategies when I see that they are doing more prolonged stagnation compared to the one they had in the backtest.
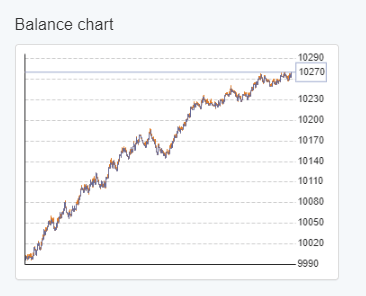
Let’s have that strategy as an example:

You can see where was the most significant stagnation. So if I see that there is a bigger one, this gives me a sure sign that the strategy was over-optimized, and I can not rely on it.
Also, I am looking at those statistics, and if I see something worse, I will delete it:

Now, it is hard to recognize it in FXBLue of Myfxbook, so I use the validator, or I upload it back in EA Studio and recalculate it with the recent data. This way, I can compare the stats.
-
February 3, 2020 at 8:16 #36639
 SimonParticipant
Thanks Petko, I have several strategies that need recalculating this way I think!
-
February 3, 2020 at 10:47 #36648
 Petko AleksandrovKeymaster
Hi Simon,
yes, simply this way we can see if the strategy started performing worse compared to its worst period. Meaning that it was probably over-optimized during the creation.
-
-
AuthorPosts
- You must be logged in to reply to this topic.
