
- This topic has 22 replies, 1 voice, and was last updated 2 years, 10 months ago by
 Samuel Jackson.
-
AuthorPosts
-
-
July 21, 2022 at 12:21 #120542
 SteveM2025Participant
For context I recently had a 1 to 1 session with Petko over video call which was extremely useful. I wanted his help in understanding why my EAs were performing so differently on demo compared to the backtest results shown in EA studio. I think my problem was that I over optimised all of my strategies, I was so preoccupied with looking for that perfect balance line stability, that I forgot to do any robustness testing.
I am now entering into a new period of testing. I have devised my Objective (see below).
Petko, can you tell me whether I have set the right Reactor settings to achieve my objective and if not, can you advise me what to change? Happy if anyone else wants to pitch in too.
OBJECTIVE:
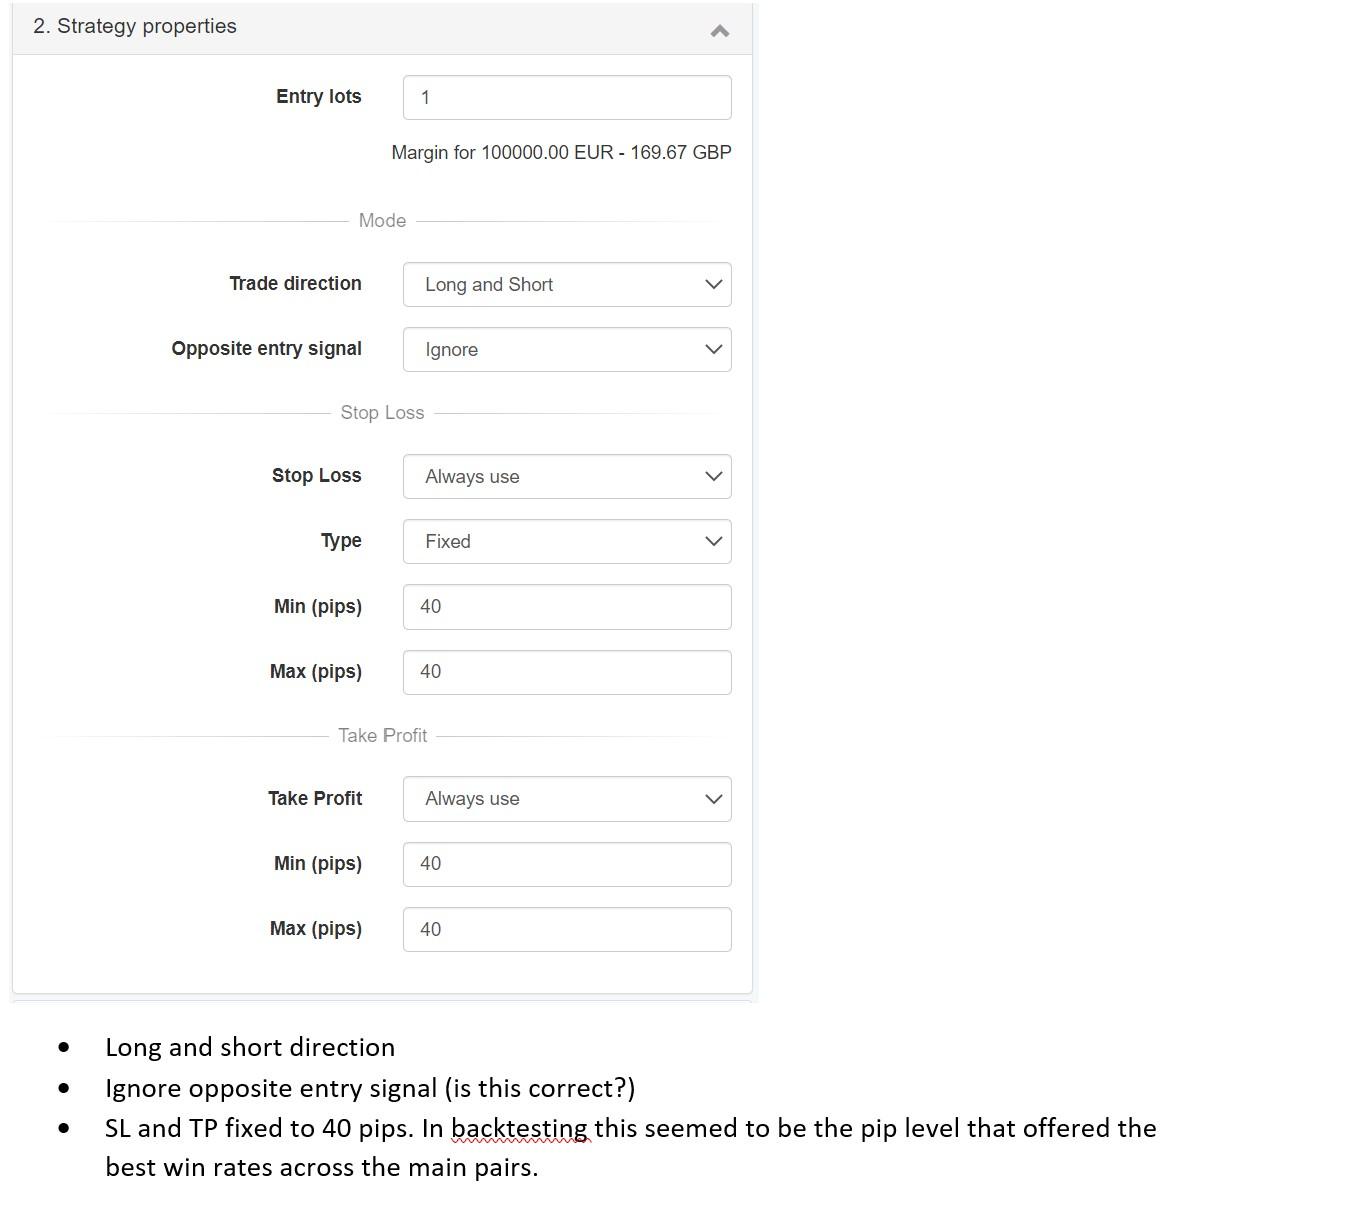
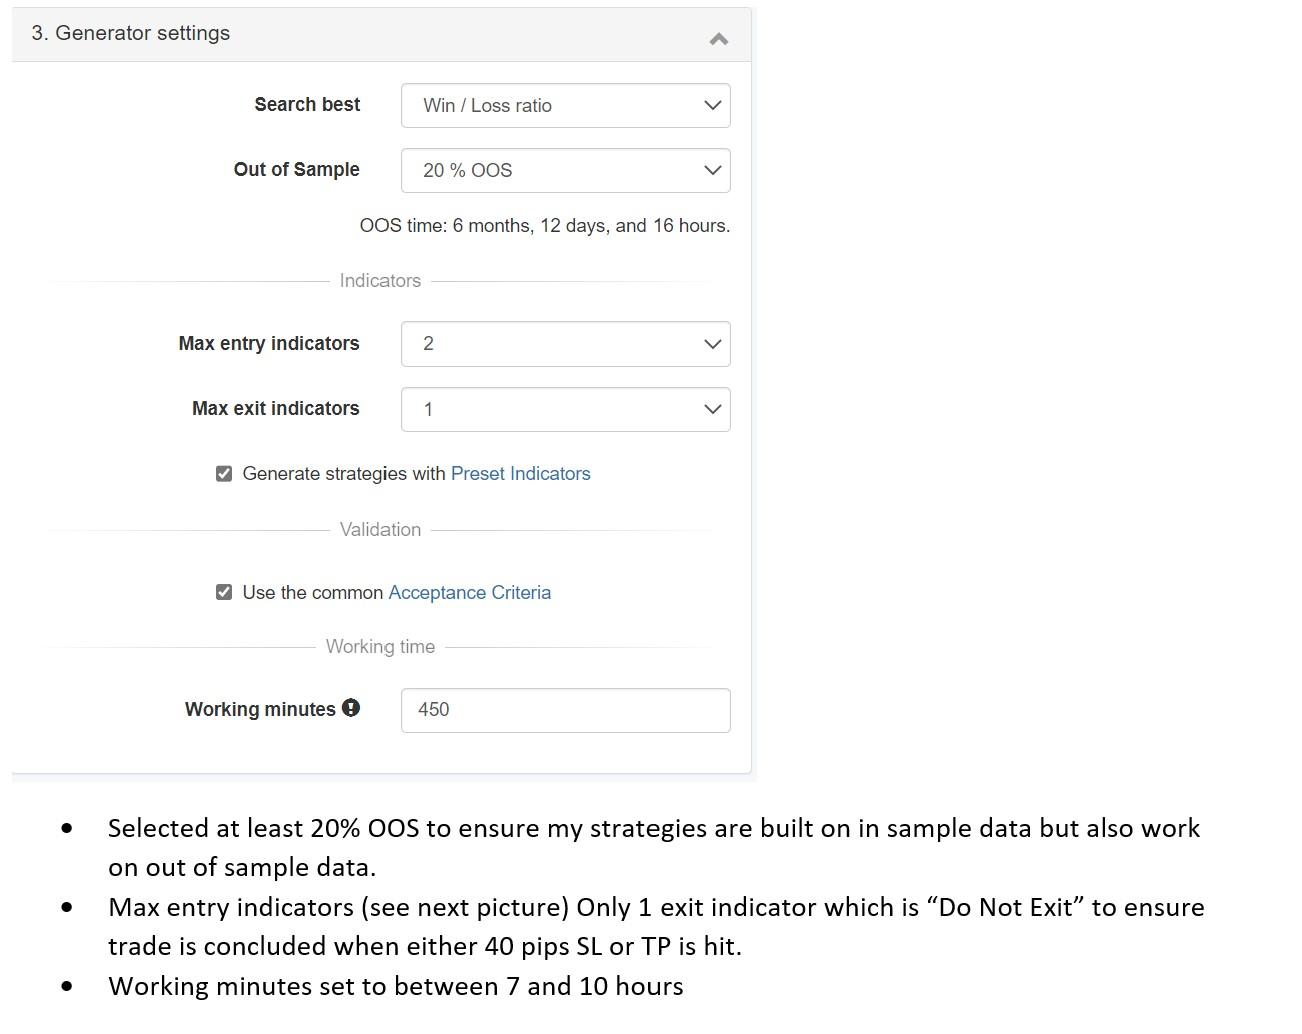
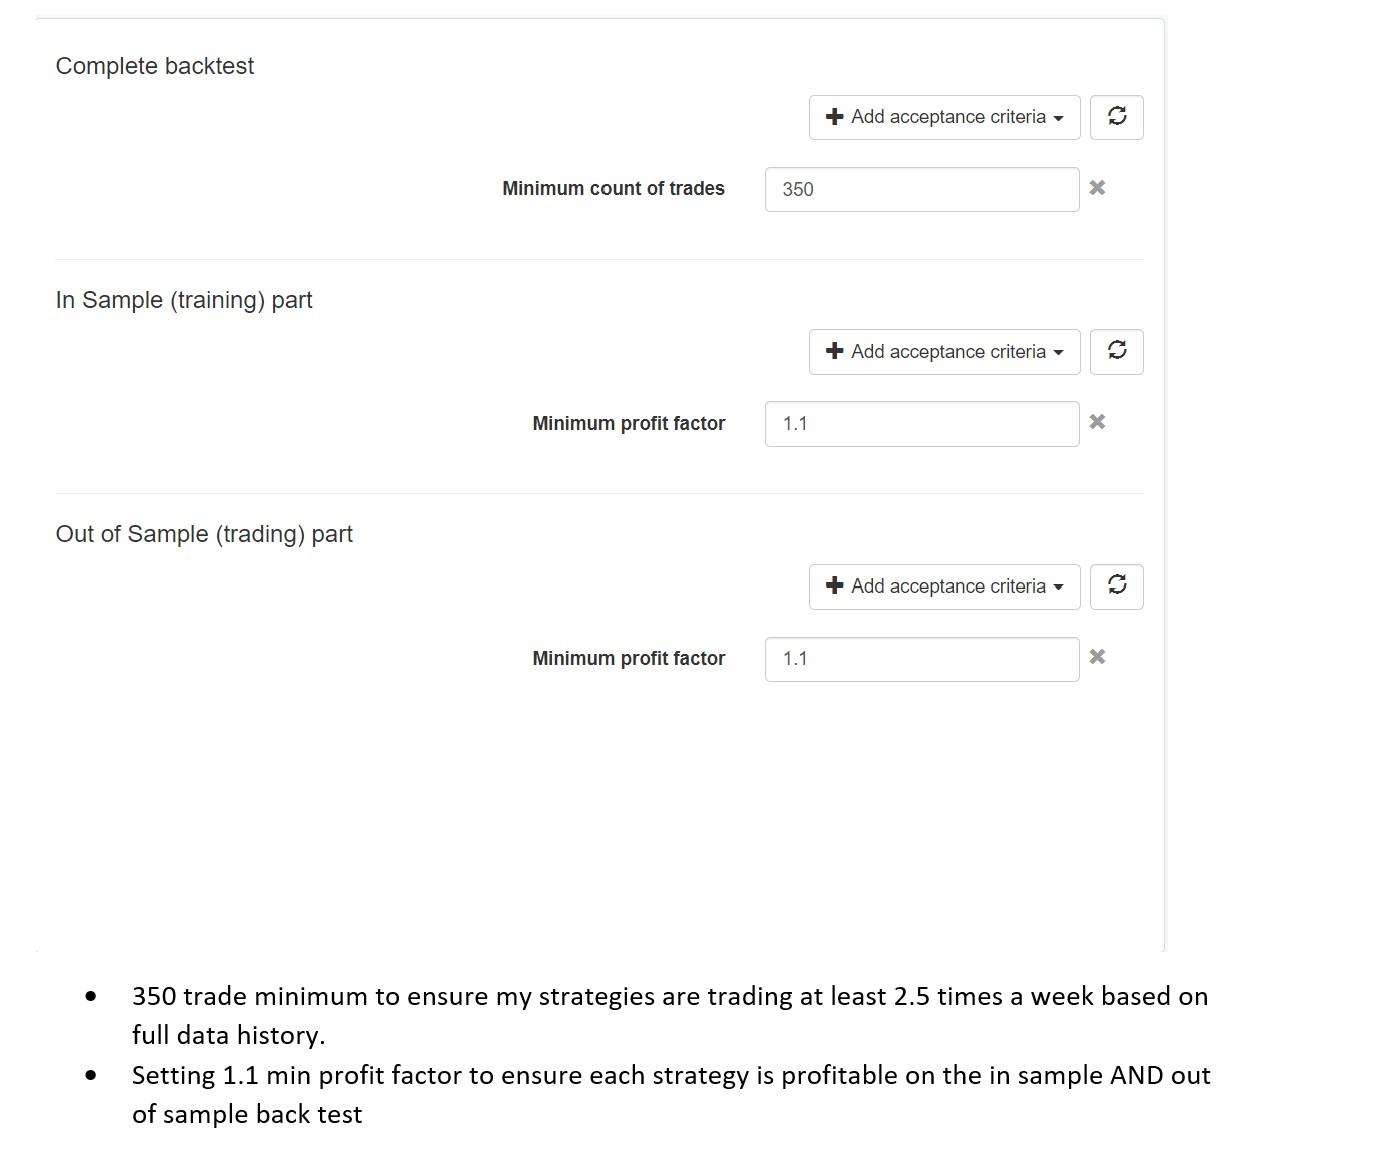
To find 1 unit risk to 1 unit reward EAs across the 6 main pairs, plus EURJPY and EURGBP to balance risk. Also on 5M and 15M timeframes. I want to ultimately find a basket of EAs that must collectively perform with a win / loss rate of c.55% to ensure consistent profits are generated. This is done by setting up the EAs with fixed and equal SL and TP values, ie 40 pip stop loss and 40 pip take profit. Statistically there is a 50% chance each trade will win or lose, but I am convinced there must be some indicators which would give a greater than even chance of resulting in a win, even though the distance from the trade open point to SL or TP is the same. 51.2% is my breakeven point taking into account spread and trading costs. I would like to find c. 30 EAs, each opening 2-3 trades a week, (c. 250-300 trades a month) that can collectively keep delivering the 55%+ win rate, month after month.
I ran large scale tests and ran multiple demo accounts and hundreds of EAs based on this idea, with a first project starting in August 2021 and a second (still under way) starting in April 2022, but in hindsight I believe I over optimised those strategies as I used no robustness testing in generating them, and the best performers have usually flopped when I have switched them from demo to live.
I have started running the Reactor again but with different and more robust settings.
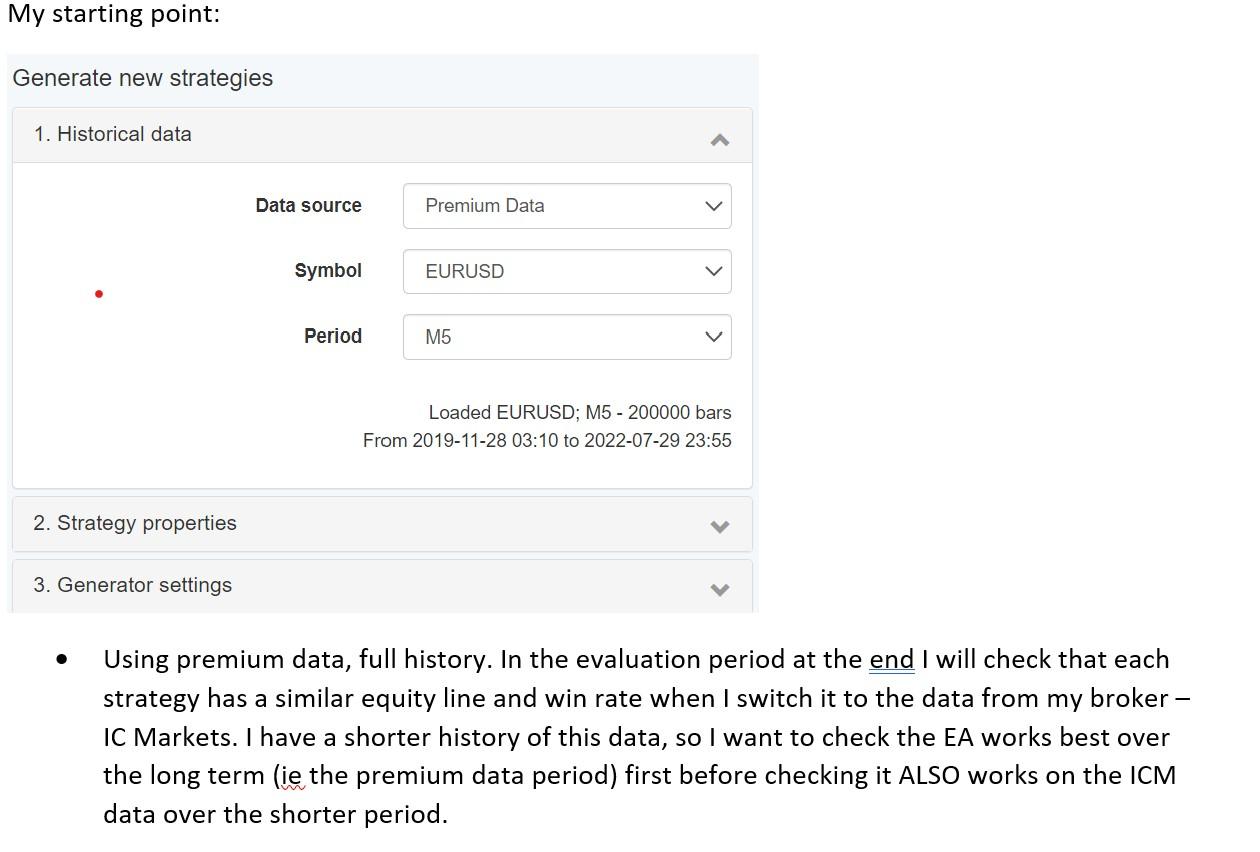
Are these settings correct to help me achieve my objective as per above?
I plan to run the below Reactor 16 times, 8 * 5 mins timeframe for the 6 main pairs plus EURJPY and EURGBP and 8 * 15m timeframe again for the same 8 pairs. I will collate and evaluate all EAs at the end of the 16 tests, to select the best c. 30EAs based on highest win / loss rate.


-
July 21, 2022 at 12:21 #119737Alan NorthamParticipant
I have been evaluating the EA Studio Free Trial. After running the Reactor I see that the results of the Monte Carlo (69) also shows up in Ascended (69) but the Collection shows 50. “What does Ascended mean and does the EA’s that pass the Monte Carlo show up in the Collections?”
-
July 21, 2022 at 13:03 #119743Samuel JacksonModerator
hi Alan,
Yes the EAs that he through the money Carlo are ascended to the collection. If 69 have passed the Monte Carlo but only 50 then likely you have automatically remove correlated EAs set on in the collection and some are being removed. If you click on the collection tab and scroll down then on the left had side there will be some stats to tell you why some have been removed from collection.
it could be that your collection size is set to 50 so check that but I expect it’s to do with correlated strategies being removed.
let me know if not and maybe send some screenshots
-
July 21, 2022 at 13:41 #119761Alan NorthamParticipant
Yes, it removed correlated pairs!
-
August 2, 2022 at 12:47 #120547Petko AleksandrovKeymaster
Hey Steve,
I appreciate you sharing your experience in the Forum. I am glad to hear that the 1:1 session was useful as well.
So here is my feedback:
1. I would add the reverse option because it is just logical if there is an opposite signal for the current trade to be closed and a new one to be opened (in the opposite direction).
2. I can’t really say about the 40-40 SL and TP because I always leave it on the reactor but give it a try…
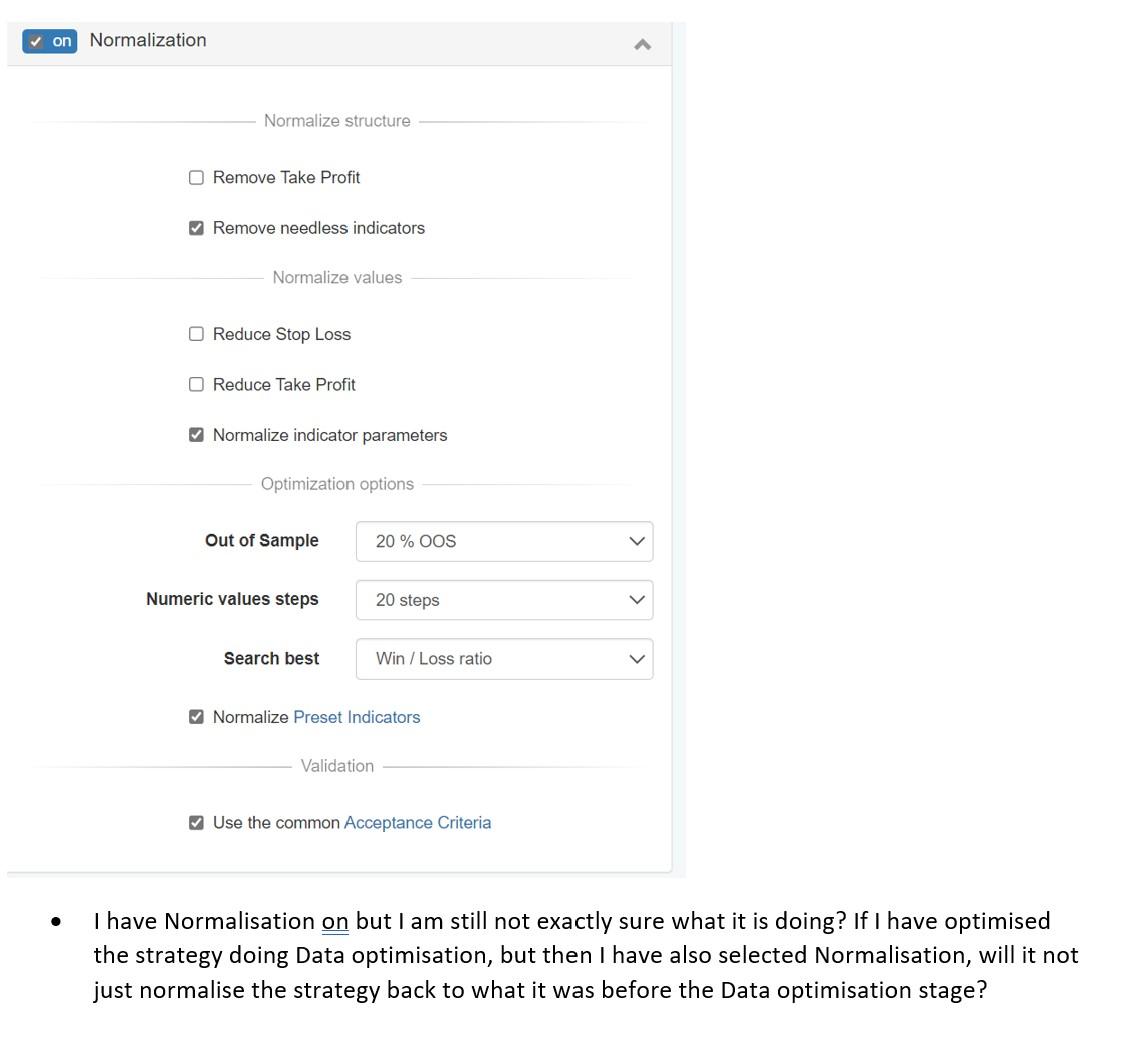
3. I am not a fan of Full Data Optimization. Normalizer is alright…check a video I recorded about it:
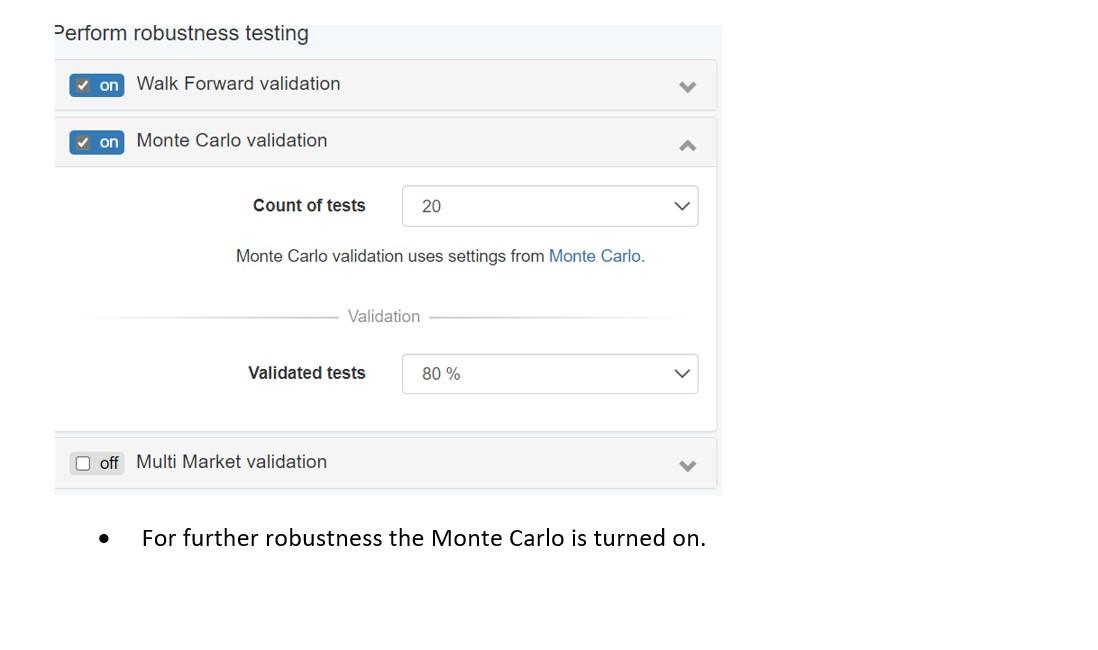
4. For Robustness I would use just the Monte Carl. For me, that is enough. With randomize Indicator parameters.
If you remember in the call I shared with you that I run the Reactor using 100k bars and then I recalculate the collection with the 200k bars so I see which strategies are performing well in the ”unknown” data. That is a trick that guarantees you are using unknown data, which is a great robustness test.
Let me know if I was useful or if I missed something.
Cheers,
-
August 2, 2022 at 18:20 #120621SteveM2025Participant
Thank you for responding so quickly Petko, I really appreciate it.
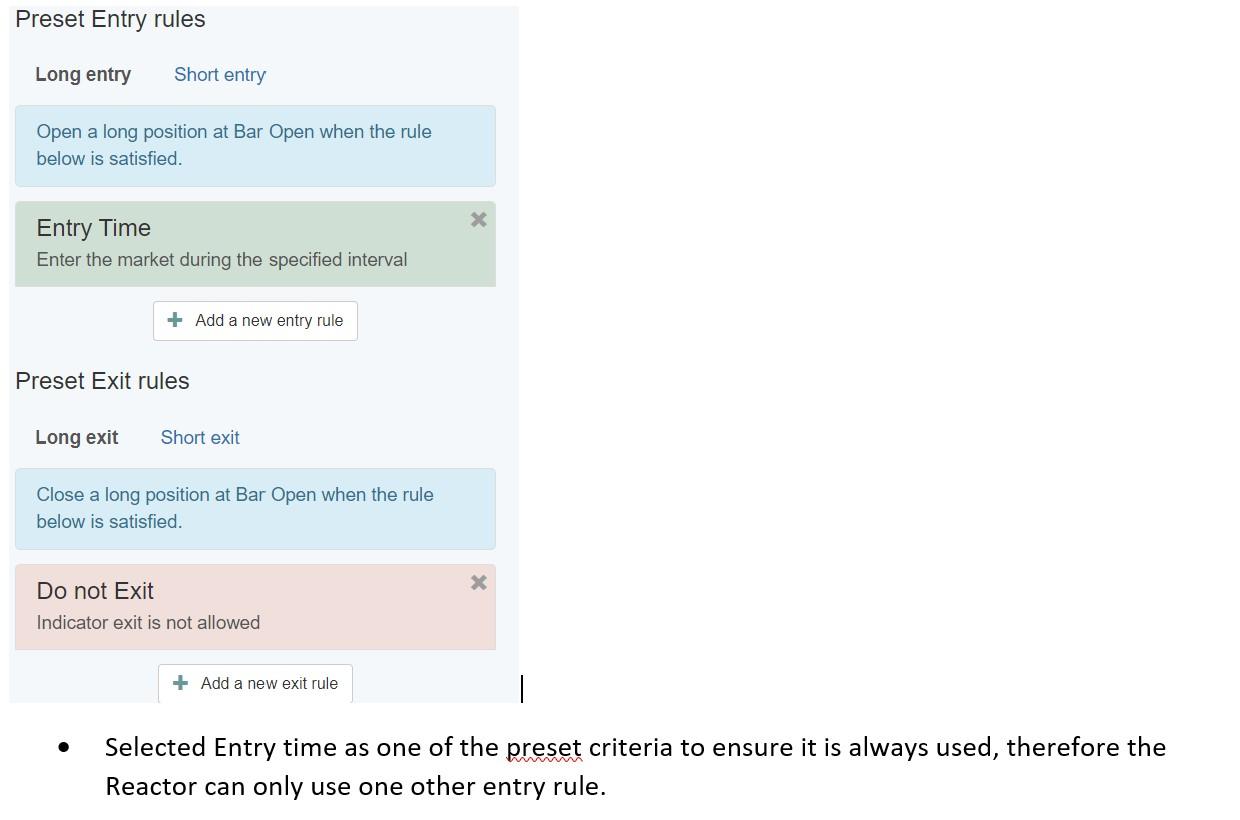
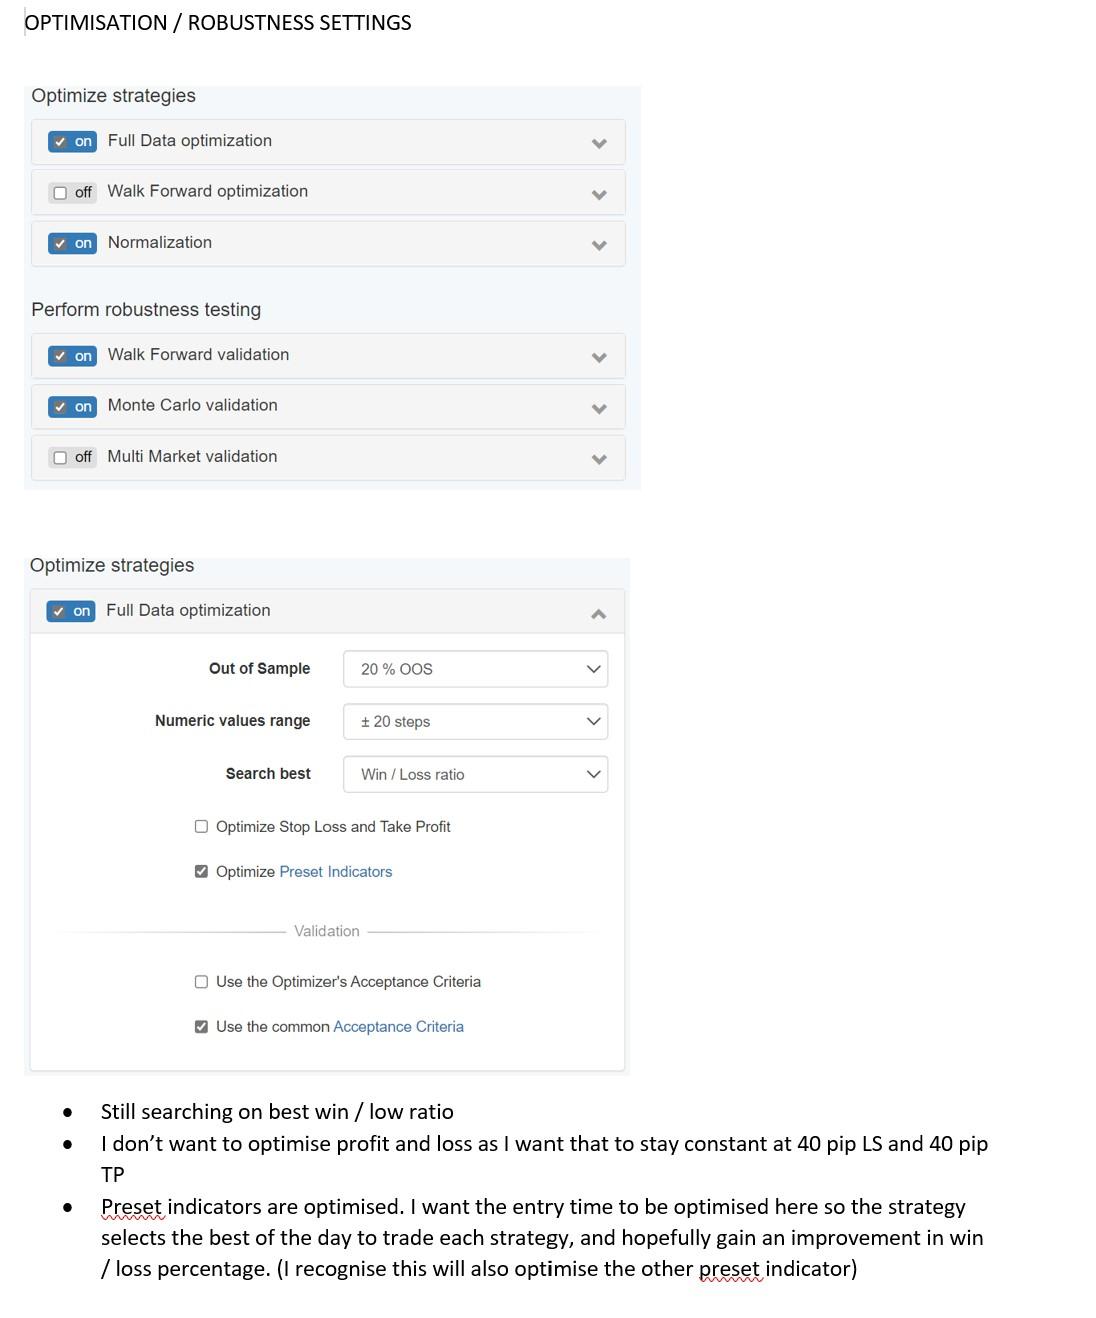
I am happy to leave out the full data optimisation. but is there a way to incorporate “Entry Time” into my strategies? I am conscious that almost all EAs perform better at certain times of the day and I’d like that setting to be in my EAs to ensure they only open trades at the most profitable times of the day.
The only way i could see to incorporate time of day into the EA was to have it as a preset criteria and then ask the Reactor to optimise it (ie select the most profitable hours of the day) in Full Data Optimisation, but if there is another way, please let me know? Thank you
-
August 2, 2022 at 18:24 #120622SteveM2025Participant
Also Petko, you mention running the Reactor using 100K bars and then re calculating with 200K bars. Is that not the same as running the reactor and in Generator Settings, setting 50% out of sample? That way your data history could be 200K bars, but the strategy would only be formulated using 100K (50%) bars and then then green zone on the chart would show you how the EA performs in the other 50% (100K bars) out of sample data?
-
August 2, 2022 at 19:49 #120628Samuel JacksonModerator
Hey Steve,
I’ll take a second look at your post tomorrow as there is a lot to digest in what you are trying to do.
A couple of initial points though.
One is that when Petko suggests checking with 200k bars if have generated using 100k bars this allows a check of OOS BEFORE the insample data as opposed to after the OOS which is done by setting OOS % in generator.
I agree also to stick with Monte Carlo only for robustness in the Reactor. You could increase it’s effectiveness further by increasing the number of tests, or afterwards running it through the validator a second time perhaps but for me it’s the best robustness tool.
I also never really using the optimiser but in this case I can see how it probably is useful for what you are doing. As you have so few indicators and no exit indicator along with not allowing optimization of stop loss and take profit I think it’s okay and has a much lower risk of over optimization than normal but generally I would avoid.
In this specific case I would personally either use only the optimiser in the reactor as you have the setting OR use the normalizer one the reactor as Petko suggests and then for each strategy optimiser only the time entry indicator with reasonable size steps (The more time consuming option but the better of the two in my opinion).
So ideally in a nutshell: Reactor with normalizer and Monte Carlo and then optimize only the time setting on an individual basis with hourly or two hourly steps for example.
Also check out the time setting in tools for either control of when your strategy trades.
Hope that helps
-
August 5, 2022 at 17:02 #120817Petko AleksandrovKeymaster
Hey Steve,
Yes, that is right, but when generating with 100k bars and then recalculating with 200k bars, you are doing the OOS in the opposite direction.
I am generating the strategies with the most recent data and then checking if they would work in the previous 100k bars.
I don’t say it is the better way to go, but just another way to check the robustness.
-
August 5, 2022 at 17:03 #120818Petko AleksandrovKeymaster
I guess Samuel explained it really well because his English is quite better than mine. But just making sure you got my point.:)
-
August 6, 2022 at 14:19 #120851SteveM2025Participant
Ok thanks Samuel and Petko, I really appreciate the advice. I am now working on a new 1:1 risk / reward project but the EAs will be generated using adjusted settings as per your recommendations.
The last couple of days i have been playing with the 100K / 200K bars method, or actually i have been testing using different date periods, for example generating EA using data horizon 1.1.20 to 31.12.21. Then downloading collection and re calculating based on data 1.1.20 to 31.7.22, so each EA shows performance in green on the chart for the “new” 7 month period ie 1.1.22 to 31.7.22. So far i have had mixed results with this, I would have expected that for EAs generated using robustness tools that performed well in 1.1.20 to 31.12.21 MOST (but not all) would continue to perform well in the 1.1.22 to 31.7.22 period. But that has not been happening, in fact i have yet to generate a collection which has a higher profit figure in Portolio as at 31.7.22 compared to 31.12.21. Is there any reason why that might be? I am sure they have not been over optimised as i have used the settings as per above.
As ever any advice always appreciated.
Thanks
-
August 8, 2022 at 5:52 #120919Samuel JacksonModerator
Hi Steve,
First point is that you can never be 100% sure that a generated strategy hasn’t been over optimized or will perform well in the future really. Robustness testing will certainly reduce this likelihood and I wouldn’t be trading a strategy that didn’t pass this filter.
It sounds like you are generating a collection using the reactor and then adding them all to the portfolio and then checking OOS and not getting a profitable single asset portfolio? This isn’t too surprising really
I would be putting together a multi asset portfolio rather than a single asset portfolio.
-
August 8, 2022 at 5:55 #120920Samuel JacksonModerator
Also you seem to be very restrictive in the strategies you are targeting with EA studio, care to explain your logic further?
Often principles of discretionary trading don’t cross over properly to algo trading
-
August 9, 2022 at 7:45 #120944SteveM2025Participant
Thanks Samuel
“It sounds like you are generating a collection using the reactor and then adding them all to the portfolio and then checking OOS and not getting a profitable single asset portfolio? This isn’t too surprising really”.
That’s basically right, for example I create a collection of my best looking EURUSD 5M strategies, generated using the Reactor with above settings, and over data period 1.1.20 to 31.12.21. I load them into portfolio and calculate and check their collective profit figure at 31.12.21, then change data horizon to 1.2.20 to 31.7.22 ie 7 months extra data, but invariably the collection has lost money over the extra 7 month period.
I take your point re a multi asset portfolio. I am running my tests across balanced pairs. Then i load collections of EAs and check them in the Portfolio, asset class by asset class, but it is not as if I am seeing great results for say, EUR JPY, which i know will compensate for mediocre results for USDCHF. None of the collections seem to be showing continued profitability for the newly added 7 month data period.
Unless I am missing something the Portfolio feature can only be used for one asset at a time? You can’t create a portfolio showing EAs from USDJPY, EURUSD, AUDNZD etc at the same time?
-
August 9, 2022 at 7:53 #120945SteveM2025Participant
Re your second point Samuel, I think you’re right. I have become fairly obsessed with the principle of the 1:1 Risk: Reward strategies. If you set a strategy that has an equal pip value of stop loss to take profit, the win rate would average out to 50% in totally random market, exactly like a coin toss. But we don’t believe the market is random, and we believe that indicators DO have some predictive qualities (if they didn’t, again we would expect to see a 50% win rate over the long term). So I have left compelled to find those indicators that can tip the win rate to 52/53/54/55%. But as you say it is a very restrictive approach and i think i need to focus on other methods. In my 1 2 1 Petko suggested EAs with large stop losses and smaller TPs have performed better in his tests, have you found the same? Is there any particular approach which has generated strong results for you in the past?
-
August 9, 2022 at 12:28 #120957Samuel JacksonModerator
Hi Steve, yes you are right in EA studio you can only create a single asset portfolio. But can check the combined results manually easily enough.
Also I would say that expecting 7 months results to be good for a strategy only developed using 2 years of data on M5 is also pretty unrealistic.
2-3 months would be a better wf amount in my opinion.
Also remember you are not managing robots in anyway with that system but simply putting them on and leaving them for 7 months (which is ages).
-
August 9, 2022 at 12:42 #120959Samuel JacksonModerator
Yes I agree with Petko on large stop loss and small take profit being able to work well.
Your logic is reasonable, however remember it is the average winning trade / average losing trade x the probability of winning that is important.
For example what would you prefer:
Strategy A: 1:1 stop loss or take profit ratio with a 60% win/loss ratio
Strategy B: 2:1 stop loss to take profit ratio but with a 80% win/loss ratio
Let’s use 100 dollars risk as an example;
Strategy A should make 10 trades and win 600 and lose 400 which will mean 200 profit with a profit ratio of 1.5
Strategy B should make 10 trades and win 400 and lose 200 which is also 200 profit but has a profit ratio of 2
That example is only expecting a much smaller relative increase in probability of winning against a halving of the tp/sl ratio also and still outperforms it.
The probability of the trades winning combined with the risk to reward ratio of each trade is what’s important.
-
August 9, 2022 at 13:01 #120962Samuel JacksonModerator
Also it’s by design that Ea studio portfolio only does a single asset portfolio. It’s purpose is to create a portfolio expert advisor that can only be attached to a single chart so all the strategies in the portfolio must be for the same symbol and timeframe.
I initially thought it would be good to have a feature to do a combined asset portfolio but its not something I would use anymore even if it existed actually.
-
August 10, 2022 at 2:29 #120970SteveM2025Participant
Thanks Samuel, you are being super helpful.
All of that makes sense, but this comment caught my eye:
“2-3 months would be a better wf amount in my opinion.
Also remember you are not managing robots in anyway with that system but simply putting them on and leaving them for 7 months (which is ages).”
Apologies what did you mean by “wf”? Again my mindset here has been – what robots can I identify and then just leave on charts indefinitely, knowing that they always trade on profitable win rate over the long term. But it sounds like you manage your robots and swapping them in and out on a more frequent basis, is that right? How then do you determine which ones to swap in and which to swap out?
Do let me know, I should add I am going through two of Petko’s courses:
Forex Strategy Course + 12 EAs I Trade Live
EA Studio Professional Course…so if the answer is in there, feel free to tell me to review those courses first!
-
August 10, 2022 at 2:40 #121007Samuel JacksonModerator
No worries Steve, glad it makes sense and is helpful :-)
Thats fair enough in wanting to leave them on indefinitely however I believe there should be some ongoing tuning of the EAs wether that be to keep the same EAs and tune them ongoingly as Petko does in the top 12 course you are going through.Or switch out new robots monthly like is done in the professional course.
Or you can manage your robots by moving too performing EAs from a demo account to live or mock live account (which is just an alternative way of achieveing the same thing as is performed in the professional course without demo trading really)
i personally prefer just managing my robots by having lots on demo and then using FXBlue to monitor and select the EAs but it’s the same as professional course method so just a preference.
-
August 10, 2022 at 2:44 #121008Samuel JacksonModerator
Also I think that for finding EAs that will work long term I would be putting say 100 or so EAs that you have generated onto a demo account and just leave them trading for a few months and then view the results, but a quicker way would be to run the reactor with an end date set the 3 months in the past and then use the validator to check how they performed for the 3 month walk forward.
It all depends on how proficient and confident that you can match EA studio with demo trading effectively.
In my opinion people new to EA studio should start out managing with demo for a while before transitioning to purely using Ea studio to manage a pool of EAs.
-
August 10, 2022 at 9:24 #121022SteveM2025Participant
Thanks again Samuel
I have now watched those lectures on Petko’s professional course re identifying the 12 balanced robots and swapping them monthly. This is very different to the approach I have been instinctively pursuing, but it is one I am going to try straight away. I have seen many an EA do brilliantly on demo, and then totally flop when I switch it to live, which is why i thought i just need to worry about the 2-3 year picture and not worry about the 3-4 month stagnation periods. My thinking has been – Maybe i have just been unlucky in switching performing EAs to live accounts after good periods and at the start of stagnation periods.
Re Petko’s approach – I’m intrigued as to why last 6 month performance, and then last 1 month performance is a strong indicator of good performance in month 7, but not beyond. Any views / insight on that?
Also I note in the professional course that this method – ie swapping out 12 balanced EAs each month was being demonstrated in November 2020.
Petko (or Samuel if you follow this approach) can you confirm this approach is still working in August 2022, and also provide some performance information for this approach over the last 21 months since Nov 2020, ie how many months of profit / how many months were not profitable, what has been the average profit per month etc etc.Thank you
-
August 10, 2022 at 12:26 #121024Samuel JacksonModerator
Regarding Petkos 6 month and 1 month, I believe Petko has determined through experience that it works well and has some logical sense but I’m sure he will confirm his reasons when you reads this.
My feel for these date ranges is that the longer filter is serving as more of a general robustness test of the EA and then the shorter filter serving as a selection based on what is performing best on a shorter more recent timeframe. Wether 12 months and 2 months or 4 months and 2 weeks may perform better I don’t know.
Also It’s not to say that the Ea won’t perform well after a month but just that the process should be repeated on a reasonably frequent basis to adapt to changing market conditions.
I agree with the logic of the approach and certainly used to get good results on demo when I started out using it. I remember my first months results were 50% profit that steadily grew over the month (using 10k account and 0.1 lot size) but I personally would be at least halfing my lot size in order to reduce my risk.
I would practice it for a few months and see how you get on (using demo account of course). Fairly easy to run other tests alongside it as it only takes a couple of hours at most once a month.
-
-
AuthorPosts


- You must be logged in to reply to this topic.