Home › Forums › Ready-to-use Robots › Top 10 EAs › Top 10 EAs: Results & Track Record › Reply To: Top 10 EAs: Results & Track Record
 Alan Northam
Hi Guys!
This first graphic show the performance of the EATradingAcademy Top10 App Robots I have selected to use in this Oanda dot com test demo account. This graphic shows this account is now 68 days old and has gained $10,363.59 or 10.4%. This graphic also shows a calculated monthly return of 4.6%. Not too shabby!
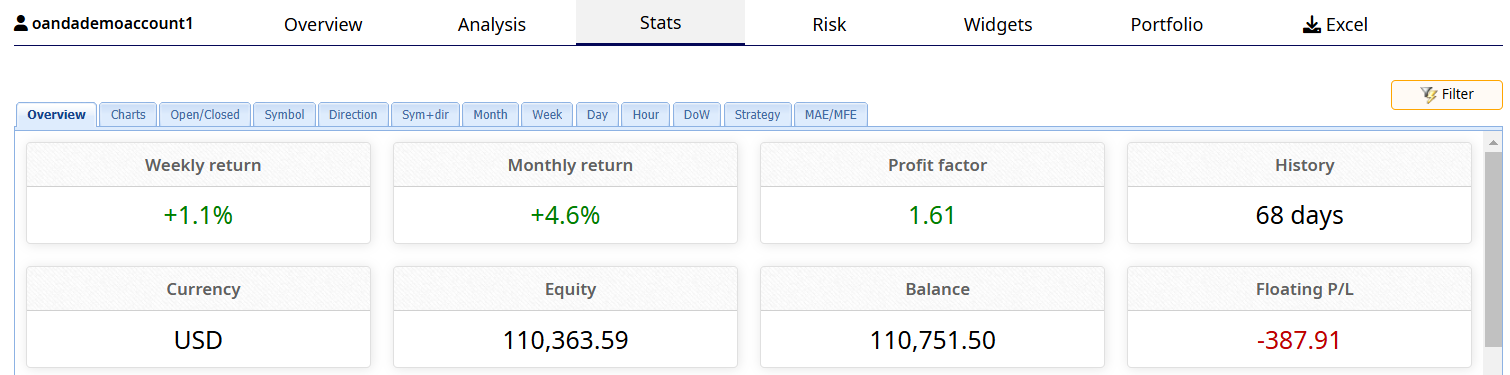
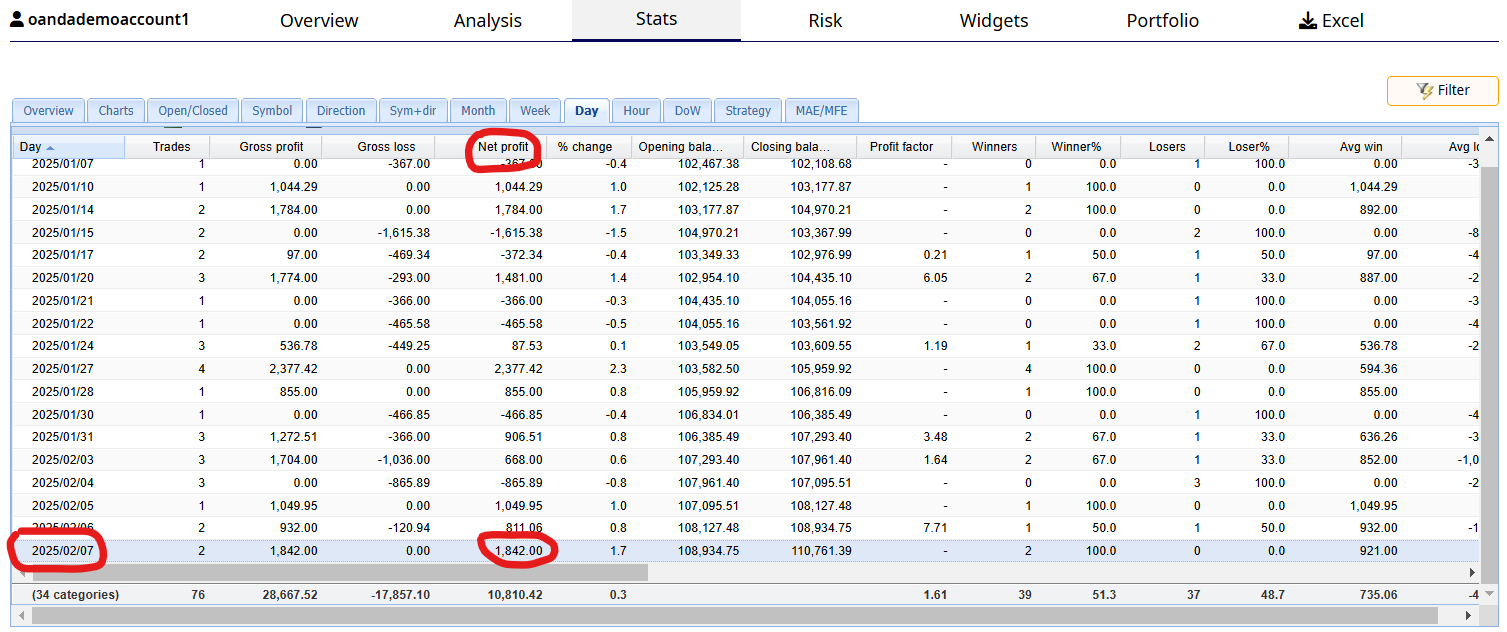
Oh, by the way what about Open Positions represented by that negative 387.91 Floating P/L? Well this second graphic shows a closing profit on Friday of $1,842.00 so I am not too worried about this floating loss. It is very possible these open trades could turn into profits before they are closed.
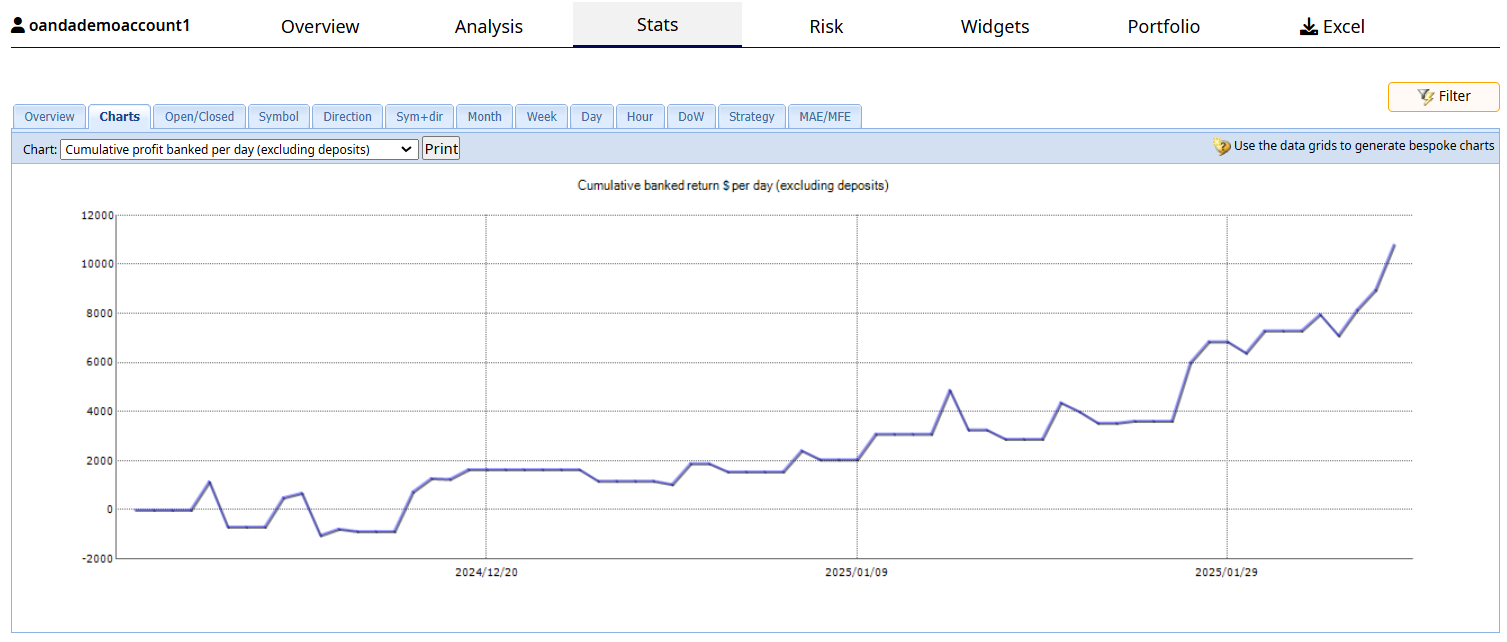
This third graphic show the balance line of this demo account since its beginning. Had a bad beginning but otherwise, Nice!
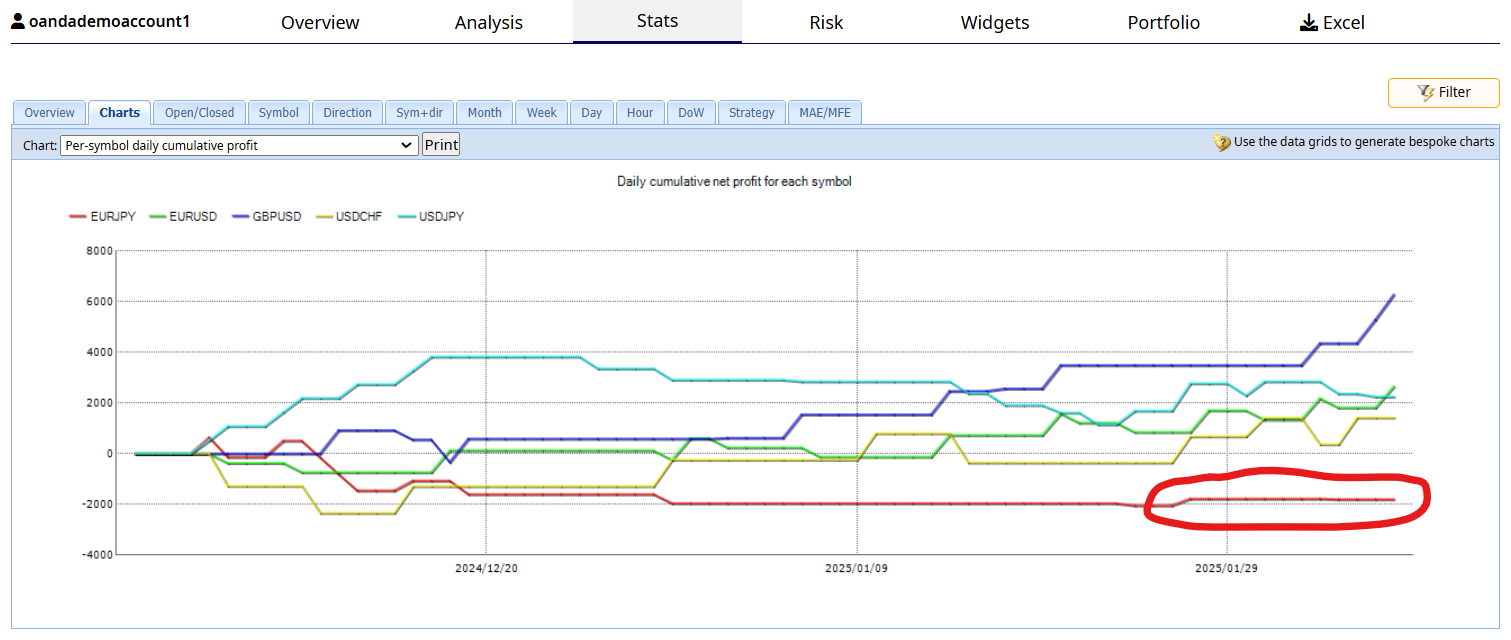
This last graphic shows the balance line of each of the assets. This graphic shows EURJPY as being the underperformer. However, when I look at the last several days I see this asset may be starting to move higher. So I will continue to keep this asset in the demo account to see if it continues to move upward.
Overall, I am quite happy with the results so far for this demo account!
To view the Top10 robots click here.
To go to the beginning of this thread click here.
Let me know what you think!
Alan,