Home › Forums › Ready-to-use Robots › Top 10 EAs › Top 10 EAs: Results & Track Record › Reply To: Top 10 EAs: Results & Track Record
 Alan Northam
TOP 10 ROBOTS / OANDA DEMO ACCT
Hi Guys!
It has been 40 days now since I started this Oanda dot com demo account test using the EATradingacademy Top10 app robots so I thought I would go ahead and do an update.
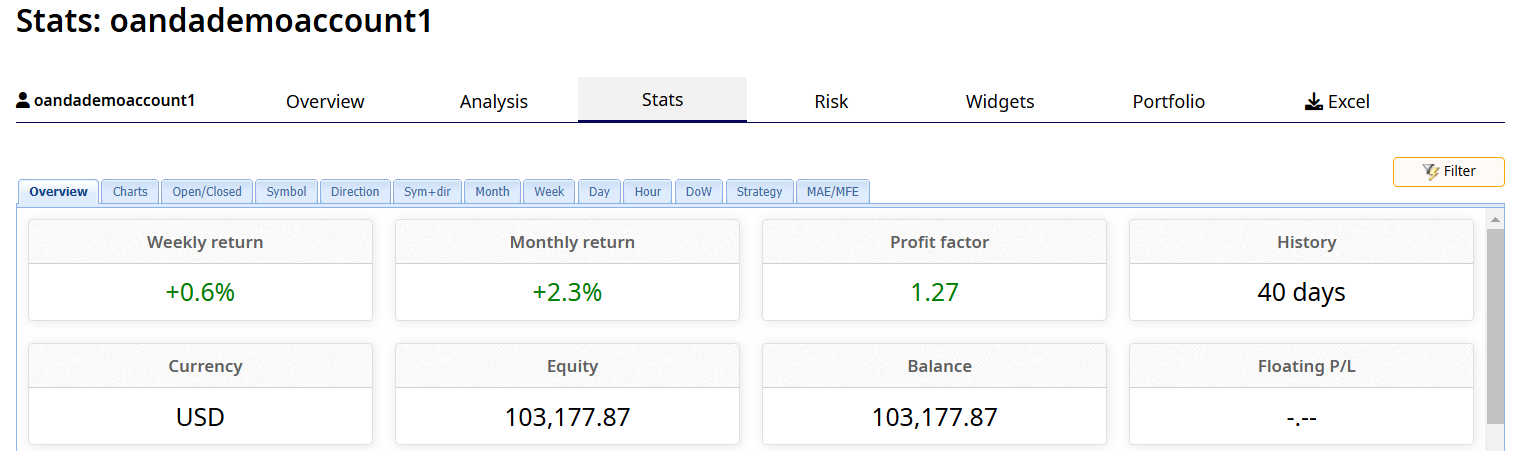
This first graphic shows a calculated monthly return of 2.3%. This graphic also shows a total equity of $103,177.87. Since this account started with a $100,000 it can be calculated this demo account has $3177.87 profit or a profit of 3.1% over the last 40 days.
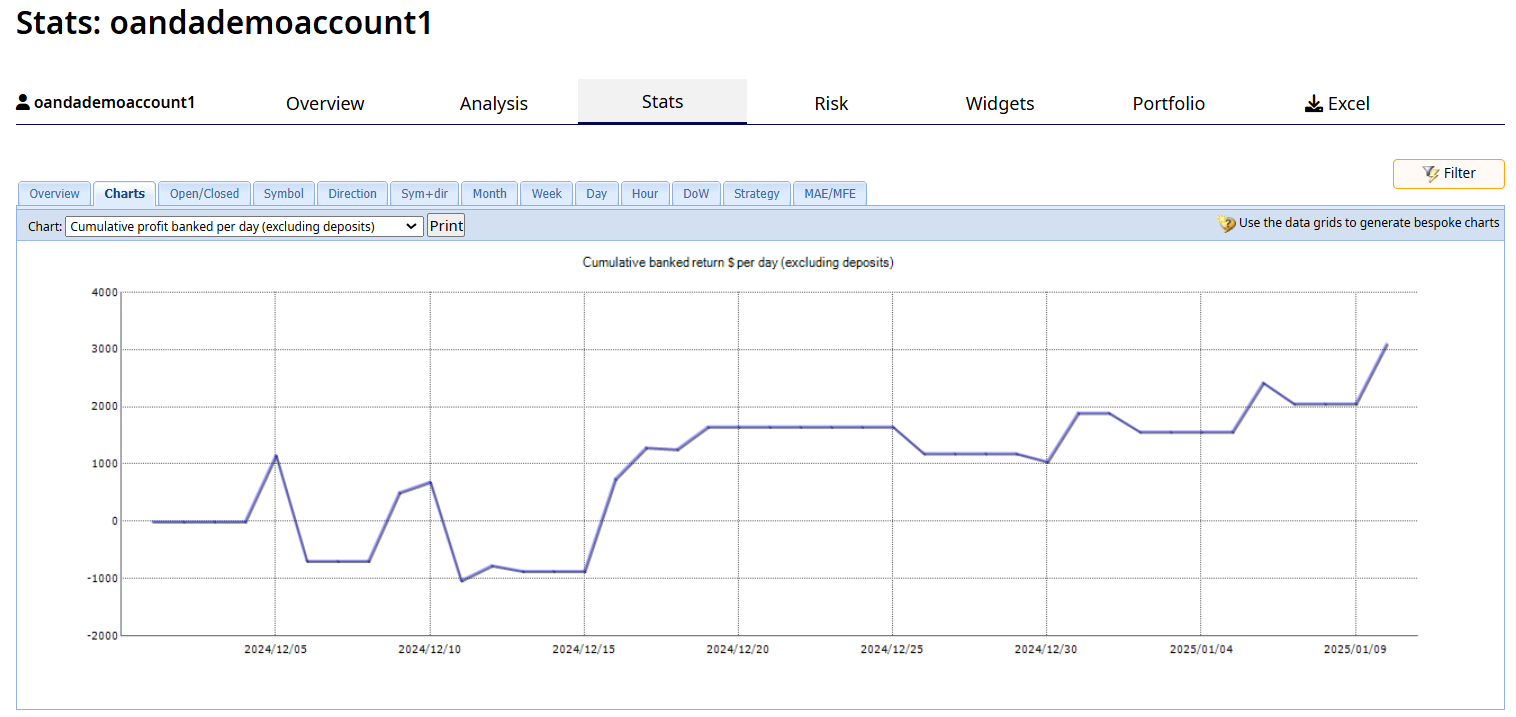
This next graphic shows the balance line over the last 40 days. The first part of this graphic shows the demo account had a rocky start moving in an up and down direction making lower highs and lower lows indicating a downward trend. From December 20 through the end of the year the balance line moved mostly sideways. This is an indication of the lack of trading activity of the big traders during the Christmas holidays. Now that Christmas and New Years is over the balance line has started moving in an upward direction making higher highs and higher lows indicating an upward trend.
This account seems to be making good progress. Keep in mind when I selected the Top10 robots to use in this demo account I only had about two weeks of historical data to use in the Strategy Tester in selecting the best performing robots. I have not made any changes to the robots since I selected them 40 days ago.
As to this demo account only having a monthly return of 2.3% is just used to show progress. A higher monthly return could be easily achieved by doubling the lot size to 2.0 lots.
Overall, at this point I am satisfied with the results I am getting using the Top10 robots on an Oanda demo account in the US contending with the FIFO requirements, the lack of significant historical data and using the MetaTrader Strategy Tester to make the selection of robots.
Alan-