Forex manual trading for Gold strategies.
Forex manual trading strategies may apply to many assets as the Gold, Oil, Apple and many others. In this article, I will share with you three strategies that I included in my Top 5 Gold trading strategies course.
Hello, dear traders, this is Petko Aleksandrov, and I will share with you how the Expert Advisors work and what are the strategies behind.
This way if you want to trade them manually you will know how to do it and if you are not a fan of Forex manual trading and you want to use only the Expert Advisors, you can take the Expert Advisors from the course and trade with them.
Forex Manual trading with Expert Advisors that are included in the course
Now, I will use the Expert Advisor Studio because we have a very lovely indicator chart and we can see exactly where the trades were opened and closed. And on the home page, you can see that there is a video of mine and below the useful links.
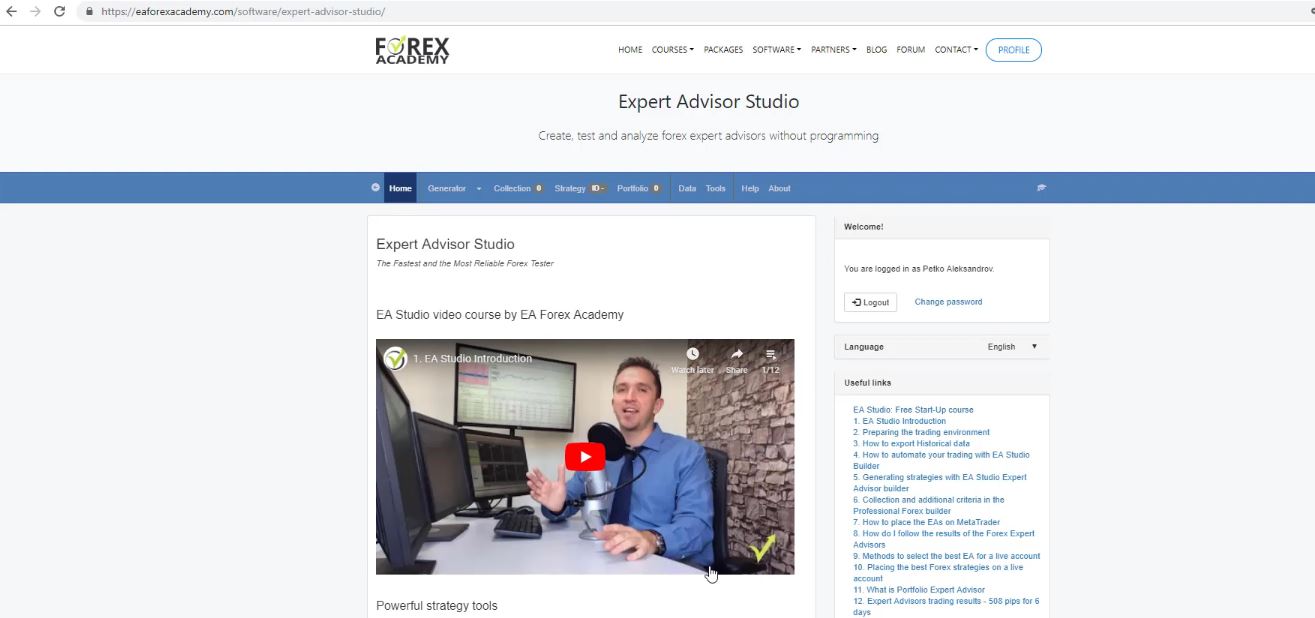
There is a new series of videos that are recorded recently, and I just uploaded them today. And they are free, and you can have a look at them if you want to learn how Expert Advisor Studio works.
Learn about the EA Studio.
It’s actually a complete startup course, and I show all the instruments, I go through them, and I show some examples of trading as well. So if you are interested to learn more about the Expert Advisor Studio, you can watch these free videos. Now, I will go-to strategy.
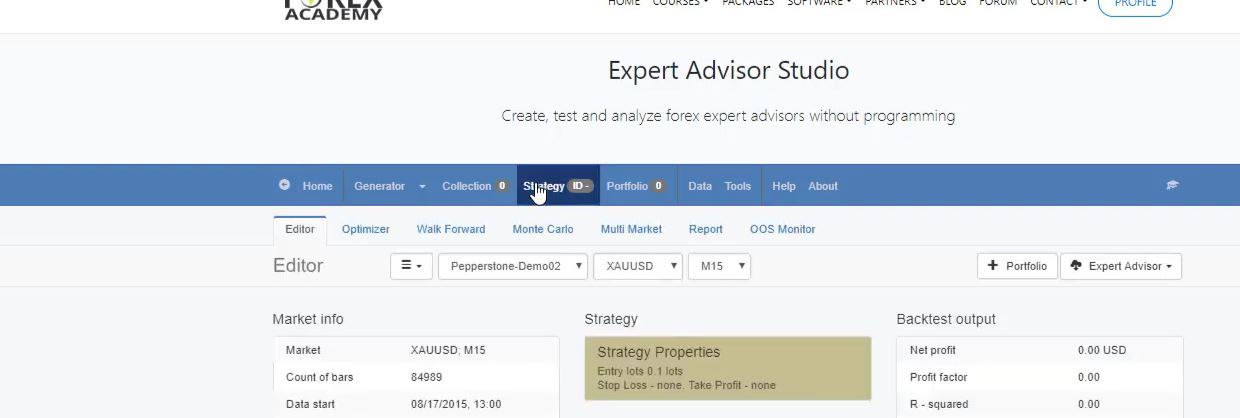
And I will import back the first Expert Advisor.

This is the one ending in 559.

I will click on open, and you can see what I have. I have one entry rule, the RVI Signal, and we have the RVI line crosses the Signal line downward.
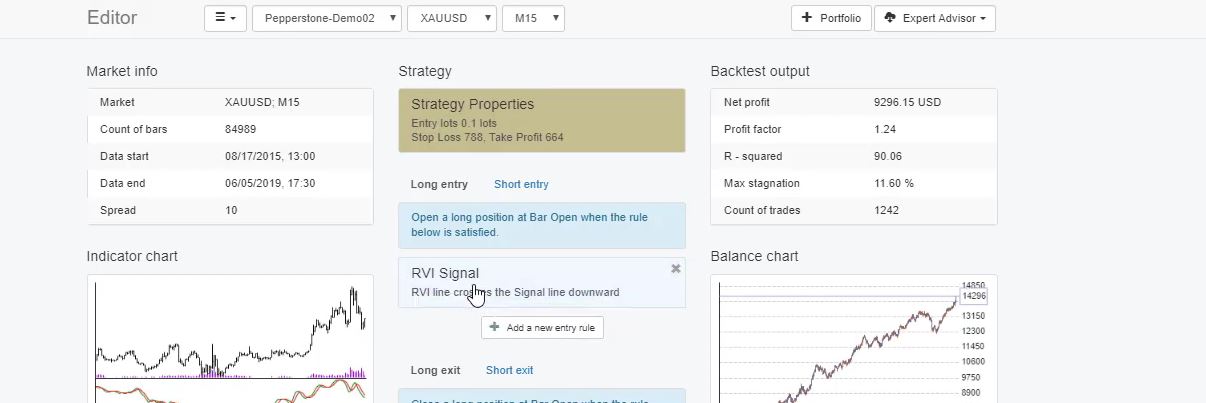
This is the rule to buy for the long entry. And to exit the long trade or to exit the buy positions, we have Volumes. Volume crosses the Level line upward. This is the exit condition.

So for the RVI, we have a Period of 46, and for Volumes, we have a level of 11,912. So these are the parameters for the initial Expert Advisors. Now, of course, with time, I will be updating these strategies.
Because of the market changes, I will do some optimization, I will do some analysis according to the new market conditions, and I will change these parameters. Whenever I do a change, I will let you know.
How to see the new parameters for Forex manual trading
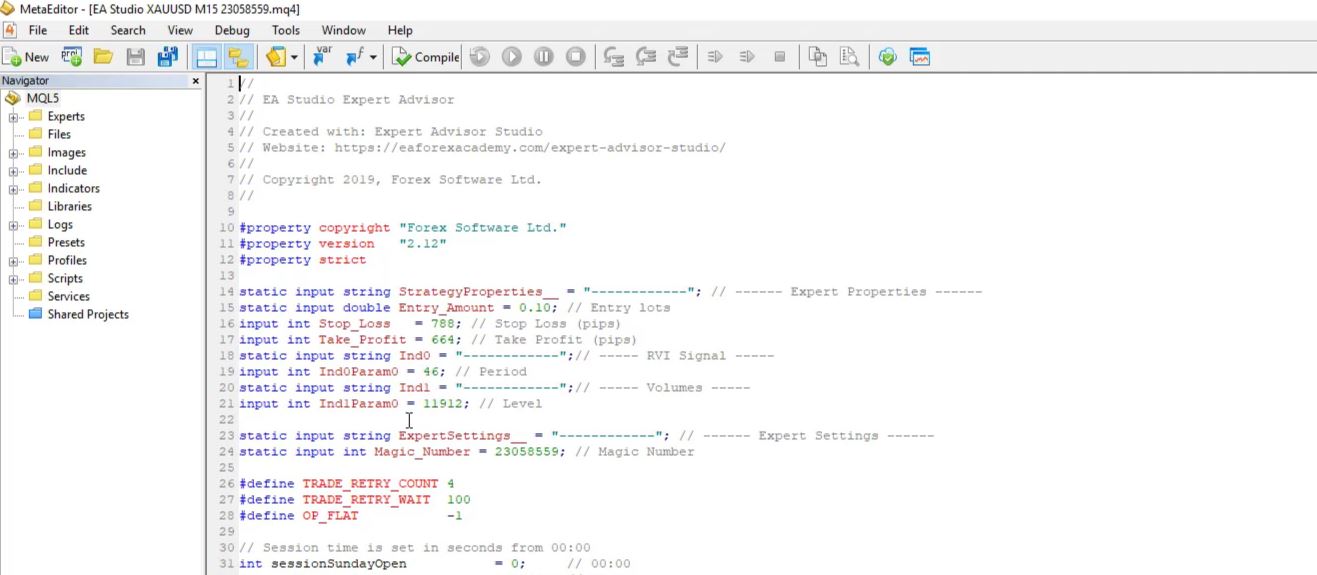
I will replace these strategies with the new ones, with the new settings. And one of the ways to see the new settings is if you open the strategy in the Meta Editor. You can see at the beginning of each strategy we have precisely the Stop Loss, the Take Profit, we have as well the indicator parameters.
So you can see the new parameters inside the code of the strategies.
So let’s see the indicator chart of the first strategy, how it looks. We have the RVI line crosses the Signal line downward. This is our entry rule. And we have Volumes as an exit rule. I click on the strategy, and you see here with the Expert Advisor Studio we have a very lovely indicator chart.
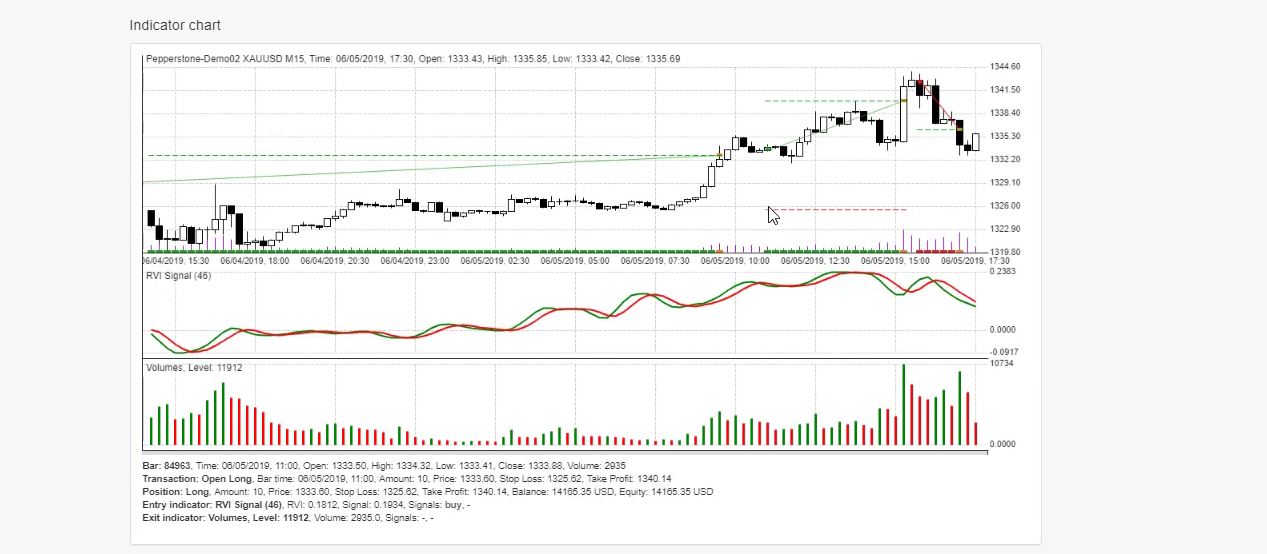
We see exactly where the trades were opened and closed. And right here we have a long trade because the RVI crosses the signal line downwards. And on the opening of the next bar, the trade is opened.
So when we have the event happening, in this case, the event is the RVI line crossing the signal line downwards, on the opening of the next one the trade is opened.
You can use any platform for Forex manual trading.
But the EAs from this course work with MetaTrader. And with the Expert Advisors, the Take Profit and the Stop Loss are placed immediately. But if you do that manually, you need to place the indicators. You need to wait to see the cross.
And on the opening of the next bar, you need to be ready to open the trade. After that, you need to place the Take Profit and the Stop Loss. In this case, the Stop Loss is 788 pips and Take Profit of 664 pips which is $7.88 and $6.64.

So once you are into the trade, place your Take Profit, place your Stop Loss and keep watching the exit rule as well. Because if it reaches above 11,912, you need to close the position. In this case, from the indicator chart, you can see that the Take Profit was hit.
So it doesn’t really matter which platform you will be using. For Forex manual trading, you can use any platform. There are many web-based platforms.
I personally prefer Meta Trader because it is possible to trade with the Expert Advisors, but for Forex manual trading, you can use any platform.
Place directional indicators on the chart.
You can see it happened after the RVI crossed the signal line upwards, the opposite direction.

But in this case, the trade was closed because of the Stop Loss. So this is how the first strategy works, two indicators, Stop Loss and Take Profit. You can see it has a lovely balance chart so far.

I will remove this strategy from the collection, and I will upload the next one.
It will be the one with Magic number ending in 184. I click on open. What we have here is the Directional indicators and Envelopes as an exit condition.
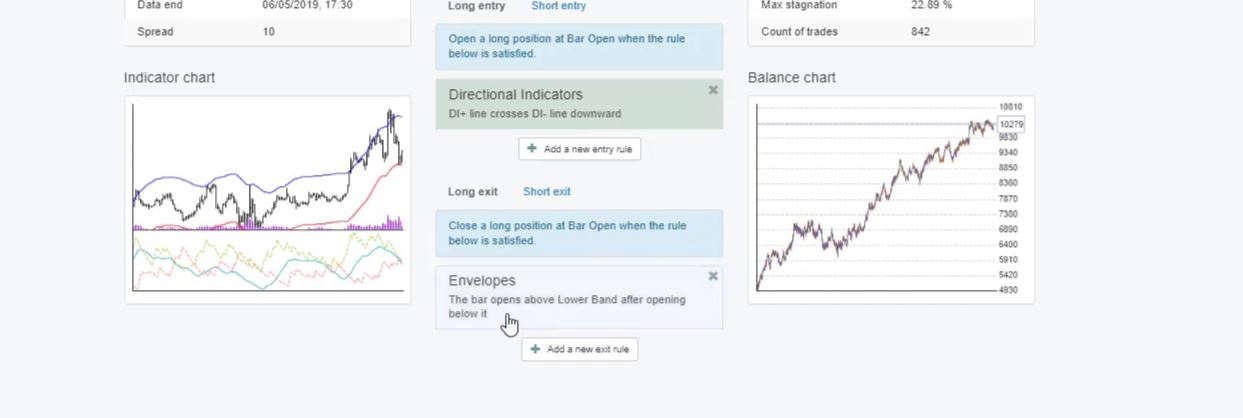
We have Stop Loss of 832 and Take Profit 945.

Directional indicators, we have the DI+ line crosses the DI- line downwards with Period of 44. And with the Envelopes, I have the bar opens above Lower Band after opening below it.
So it means that we will exit the long trade once the price was below the Envelopes and when it gets into the Envelopes we are out. Period of 20, deviation, 0.36. So these are the two indicators with the strategy.
What you need to place on the chart if you want to trade it manually are the directional indicators that display below the chart. And the Envelopes, it is over the price chart.
A trade closed due to the Envelopes.
So we have the DI+ crosses the DI- downwards. You can see the green line. The positive one crosses the red line downwards.

So we need to buy on the opening of the next bar, the trade is opened. And you can see in this case. It goes to the Take Profit.
So once you see the cross of the two lines you need to open your trade, and you need to place your Take Profit and your Stop Loss, and you need to look for an exit from the exit rule which is the Envelopes.
Let’s have a look at an example where the trade was closed due to the Envelopes. I will go back and look for such a case. So the entry here is obvious when the two lines cross.
Now, in one example, we have the opposite case. We have a short trade because the positive line crosses the negative line upwards. So we are selling.
Let’s see what happens with this trade, it closes over here, and it closes because of the Envelope.

We set for a long trade. We want to see that the bar opens above the Lower Band after opening below it. So for the short trade, it will be the opposite thing. The bar will open below Upper Band after opening above it.
Forex manual trading with the Average True Range.
So we want to see the price going above the band, and when it gets into the Envelopes between the two bands, it closes straight on the first bar open. This is why we say that we will exit the short trade when the bar opens below Upper Band after opening above it.
This bar opens above on the opening of the next one. We are out. This is how the Envelopes work in this Forex manual trading strategy. I will click on the editor one more time so you can view the strategy.
One entry rule, Period of 44, one exit rule, Period of 20, deviation 0.36. We have the Stop Loss and the Take Profit.
I will remove this strategy, and I will import back the third Expert Advisor ending in 637. I click on open, and you will see that here we have 2 indicators as an entry rule and we have 1 exit.
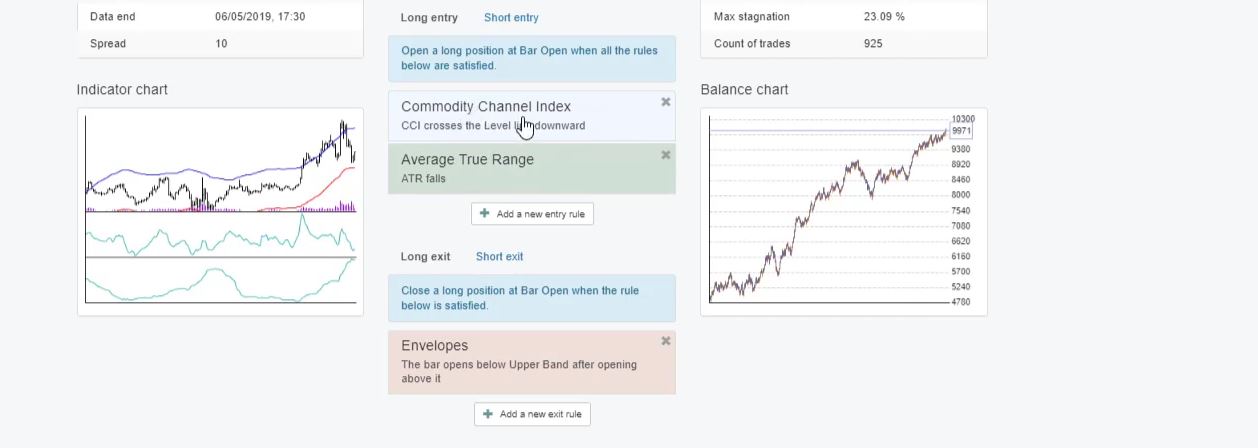
The first one is the CCI, and it says CCI crosses the Level line downwards, Period of 23 and it applies to Typical method.
And let’s have a look at the Average True Range, we want the ATR to be falling. Period of 21, Level of 0.01. And the Envelopes is our exit indicator. Again, the bar opens below Upper Band after opening above it.
So this case is different. The bar opens below Upper Band after opening above it. This is for the long trade now. We need to see that the price gets into the bands in order to exit the long trade.
The confirmation in Forex manual trading is vital!
And here we have Period of 27, deviation of 0.39. Let me have a look at the indicator chart. We said that we want to have the CCI crossing the Level line downwards in order to buy and it will be upwards in order to sell.
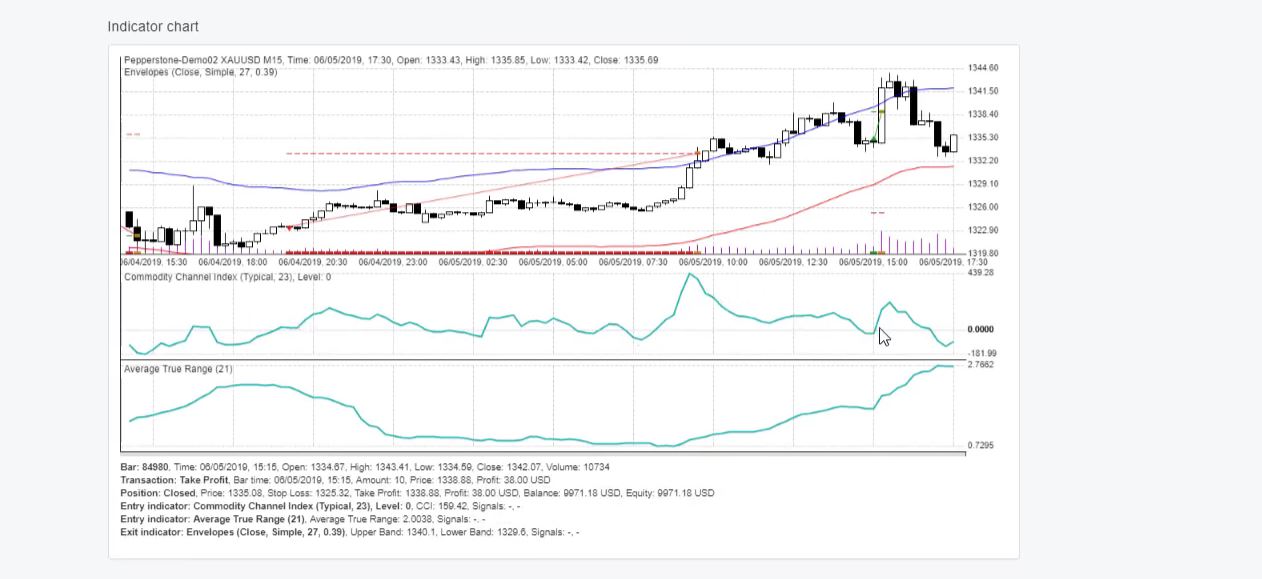
You can see here the CCI crosses the Level line upwards. Let’s have a look one more time at the level, yes it is the 0 line.
You can see that it is displayed over here so when it crosses upwards, we sell, and when it crosses downwards, we buy. So you can see here is a sale and here it is a buy.
And as a confirmation, we have Average True Range falls. This is for the long trades and for the short trades, it should be rising.
So at this moment over here it is rising at the opening of this bar, I’m not sure if you can see it but here there is a small move down then it’s going a little bit up and then goes down again.
And many traders actually make a mistake to look over the chart over trading platforms to analyze strategies with indicators. But the thing is that they repaint and they are very misleading when you look at them, back over time.
Sometimes it is very clear where the entry is but sometimes the indicator at this moment was not exactly what we see it as right now. So here we have a long trade, you can see that we have the cross of the CCI of the Level line is going down, it’s crossing downwards the line.
The Stop Loss and Take Profit.
This is why at the opening of the next one, we have a long trade. So right here was the cross on the opening of the next bar. The trade is executed, and at the same time, we need to have the Average True Range falls.
It’s falling at this moment right over here. And what happened with this trade, it hit the Take Profit, and you can see where the Stop Loss is.
So the red line shows where the Stop Loss is. And this one over here shows where the Take Profit is. And you can see there is a small arrow where the trade was open. It is green if it was a buy position, and if it was a sell position, it is red.
These are the first 3 strategies that I selected and that I placed for algorithmic trading, but I want to show how these strategies actually work.
If someone is interested in Forex manual trading, they can use them. And as I’ve said, I will update these strategies whenever it is needed according to the recent market conditions. I will do some optimization. I will analyze them according to the new data that comes, the new bars, the new historical data.
I attached resource files in the course as well.
So in these 3 lectures where I show the manual trading of the strategies, I will attach PDF files as resources. I will describe the strategies there with the parameters and exactly the rules that are followed.
If you want to trade these strategies manually, it will be easier for you. And the other thing is that when I update these strategies, I will update these resource files and I will put there the new parameters.
If any other parameter is changed, I will underline it. For example, if I change the CCI to 25 but no longer 23, I will just underline the 25, so you know this is a new value, and you can start using the new value. And as well, I will update the Expert Advisors with the new parameters.
I will upload the new Expert Advisors with the new parameters. And the other way that I told you to see the new parameters is from the code of the Expert Advisor. But I believe with the resources files that you will find attached to this lecture and the next 2 lectures. It will be much easier for you.
Thanks for reading.
Cheers.


