How to do Backtesting in Forex – the method to test an Expert Advisor in MetaTrader
Backtesting trading Forex strategies is what we will cover in this free lecture from Petko Aleksandrov, the Head Mentor at EA Forex Academy.
In this article, we will talk about the update that we have in the report and how to backtest Forex trading strategies with EA Studio, or when we are generating strategies.
For those of you who already know EA Studio and have tested the 15-days free trial, we will update you with great tools that are available in the Report. If you have not tested the two weeks period, give it a try because you will learn how to do backtesting Forex trading strategies even you do not have programming skills.
Also, to use the EA Studio strategy builder you do not need to have any trading background. The program is easy to be used and there is a free course attached that will help you get started faster. In the beginning, it might look difficult but when you do it one time, you will see that it is easy.
Backtesting Forex trading strategies with Petko Aleksandrov, our Head Mentor, and trader.
Hello traders! This is Petko, and today I will talk about the new update in EA Studio. So if I go to collection, I have some collection here for EURUSD on the M15 chart, and I will click on any of the strategies. So far, when we were backtesting trading strategies in the backtest output, we had exact statistics, and we were not able to change it:
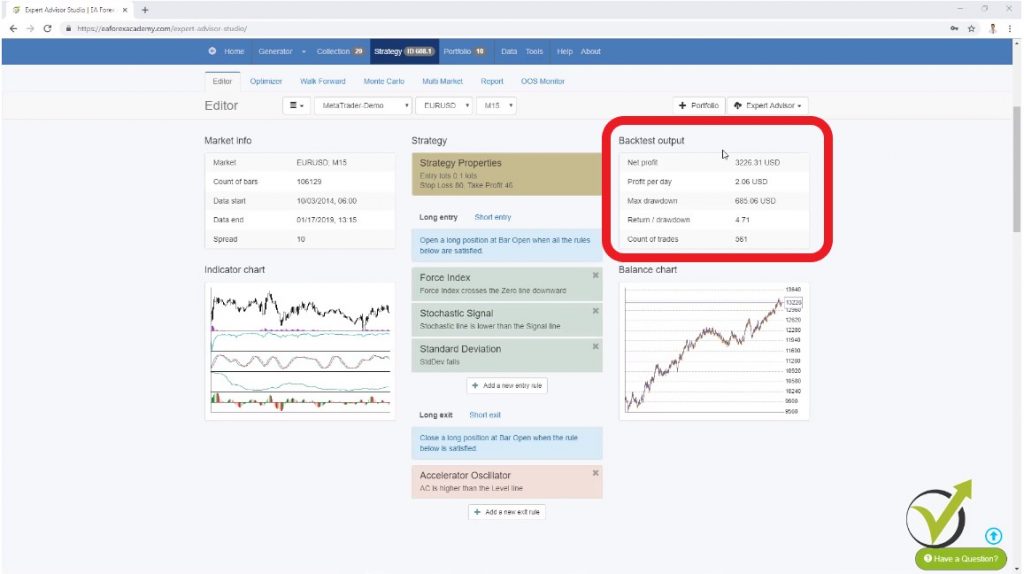
But now, if I go to tools and below, you will see backtest output metrics. Here you can select which metrics you want to see in your strategy. You can see they are 5. So you can change it to any other metrics that you want to have while backtesting trading strategies.
For example, the first one I will leave it to net profit, but then instead of profit per day, I can select maximum drawdown in percentage, then instead of maximum drawdown, I can have the R-squared.
This is a new feature in EA Studio, which I will explain in some of the next videos about the EA Studio updates. It is very nice, and by using it, we can have a very lovely equity line with the strategies.
And for example, I can change return to drawdown. I can change it with maximum stagnation in percentage. And instead of the count of trades, even I like to see the count of trades.
I will select the win/loss ratio.
This is a critical criteria when we are backtesting Forex trading strategies. And we can say it is one of the most important criteria.
Alright, and if I go now to the strategy, you will see that I have the net profit, the maximum drawdown, R-squared, maximum stagnation, and win/loss ratio. So depending on which ones you want to see while you are backtesting trading strategies, you can change them from here from the backtest output metrics.
Now, if I go to the strategy one more time and I go to report you will see very very interesting charts here.
What can we do with the EA Studio backtesting trading tool?
- backtesting Forex trading strategies
- generating strategies over Historical data
- optimizing strategies for better results
So here, we have more information and a more visual outlook of the strategy, and I will explain each one along with the video.
On the left side, we have the backtest output.
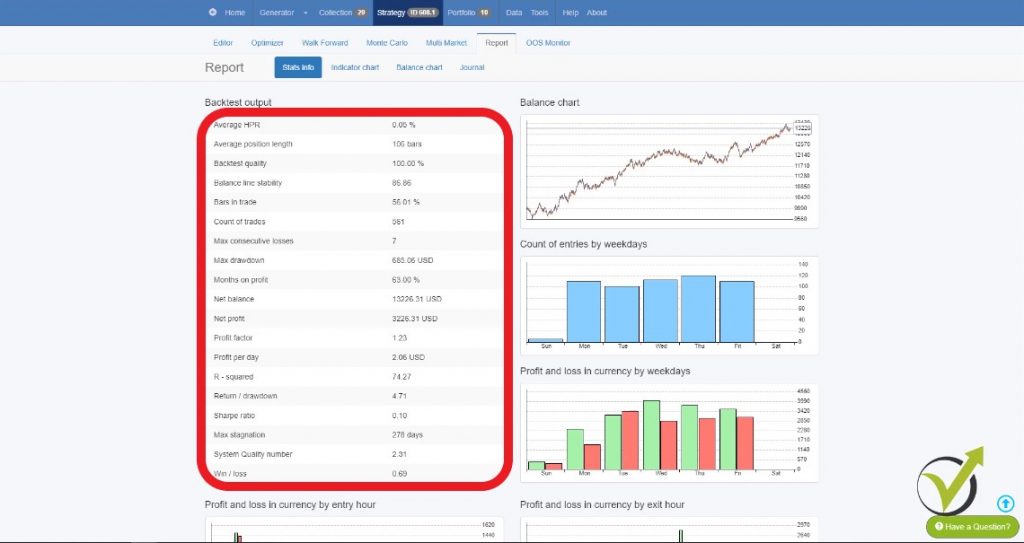
Here we have some updates as well. We have backtest quality, which before was called to be maximum ambiguous bars. And for the new traders with EA Studio:
“What that means while we are backtesting trading?”
The ambiguous bars or the backtest quality is when we are backtesting trading strategy that uses stop loss and take profit, and the stop loss and the Take Profit is within the range of one bar.
So let’s say in the backtesting trading strategy we have the trade open somewhere here, and then we have the stop loss and take profit within the range of this bar.
So the program cannot decide which one was first. Did the price reach first the take profit? Was it Stop Loss? And it’s normal because what we have from the historical data is the open, the high, the low and the close.
This is all the information we receive when we export historical data from MetaTrader. And here, the MetaTrader backtesting trading gives you a result that is better for you. So it will show you that the take profit was hit, but this is not the reality. We don’t know if first was the Stop Loss or first was Take Profit.
While EA Studio uses an account protective algorithm.
Meaning that when there are such bars, it will take it as a negative. If there are such situations or such bars, while backtesting the trading strategy, it will show you a more negative result. So this way, it will show the more secure result for the trader. It will avoid showing overestimated results in backtesting trading.
So one more time here about the backtest quality, which before was known as ambiguous bars. This is when we have a huge bar, and our trading strategy has a stop loss and Take Profit within the range of this bar, and EA Studio, just like MetaTrader, doesn’t know which one was hit first the take profit or the stop loss.
And EA Studio will always show the stop loss. So it will show you the more secure results.
Going down to the backtest output, we have bars in trade. This is updated as well.
Which is very interesting! We can see how active is our strategy. So here we have 56%, meaning that the strategy is trading nearly half of the time. We have the R-squared, which, as I said, I will dedicate a whole video in the next days, and I will explain what exactly that means and how you can use it while optimizing the strategies or while you’re generating strategies.
Alright, so now on the right side, we see the balance chart, and then what we see is a count of entries by weekdays. So this is the count of entries. Please, pay attention to the names above the charts! It is set there exactly what it is. This one shows the count of entries:
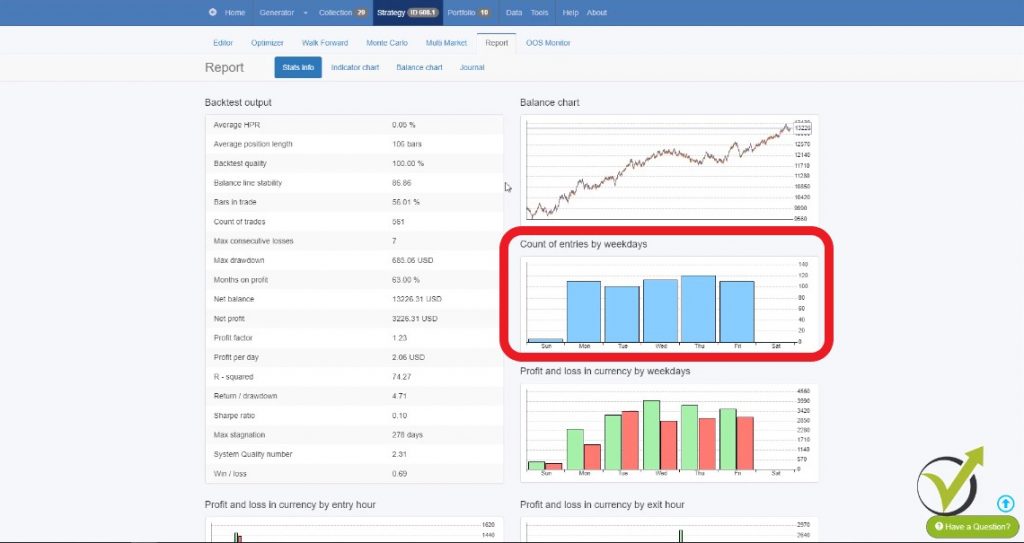
This is not the profit, but this is the count of entries by weekdays. As you see with this historical data, we have some trading on Sunday. So there are some trades over there. And then on Monday, Tuesday, Wednesday, Thursday, you can see it is most active.
So here with this visual backtesting trading stats, you can see if your strategy is balanced and if it opens trades every day during the week.
Now the next one is profit and loss in currency by weekdays.
How to backtest Forex trading strategies and see actual results?
- The green one shows the profit
- the red one shows the loss.
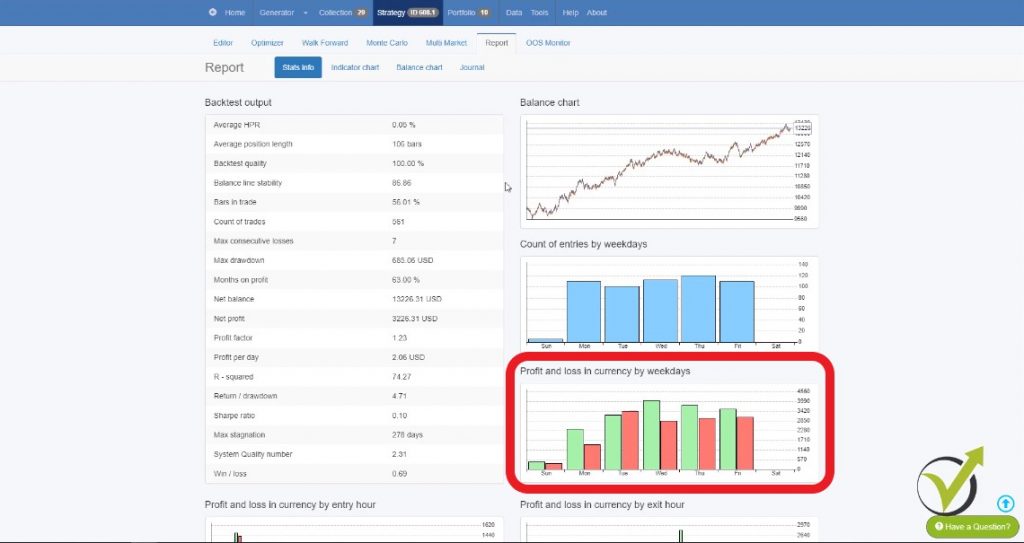
And the first thing I see here is that this strategy on Tuesday makes more losses than profits. Here is in currency. So we can say this is profit and loss.
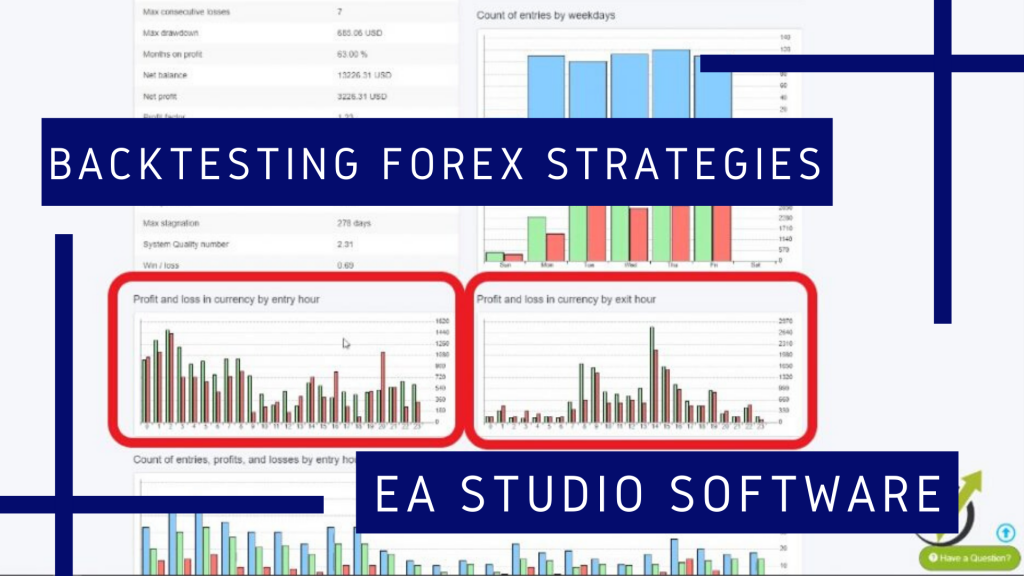
Now we have profit and loss in currency by entry hour.
Profit and loss in currency by exit hour?
- during which hours this strategy makes more profit
- when it makes more losses
- the backtesting trading by hour gives us a better understanding
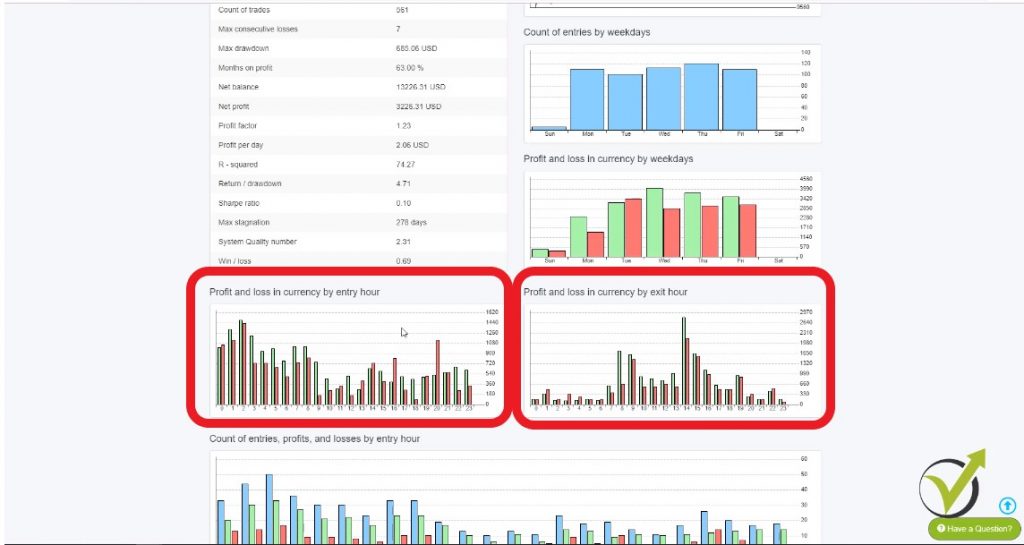
Here obviously, the strategy makes more profit during the first half of the day. And in the afternoon, the trades that were opened in the afternoon, they are making more losses.
So here one more time, please, carefully read what it says: Profit and loss in currency by entry hour.
This means that we see the entries of the positions during which hours the entries are leading to a profitable trade and during which hours the entries are leading to losing trades. And here we have the exit hour.
So here we can see between midnight and 6:00 we don’t have an exit, tiny exits here. Then we have good exits from 8:00- 9:00, and then we have a great exit at 2:00 p.m., and then we have smaller results by exit hour.
Alright, and let’s see here what will happen if I go to tools, and I set Monday till Thursday for backtesting trading. So let’s change just the hours and see how the graph will change. Let’s make it from 10:00 trading till 14:00. And I will do the very same thing for Friday I will do it from 10:00 to 14:00 , and I will go to strategy, so you see it changed.
I go to report, and you will see exactly where I have trading only between 10:00 and 2:00 p.m., but I have exited with the SL and the TP all the time. If the strategy has exits conditions, they will work only within the selected hours.
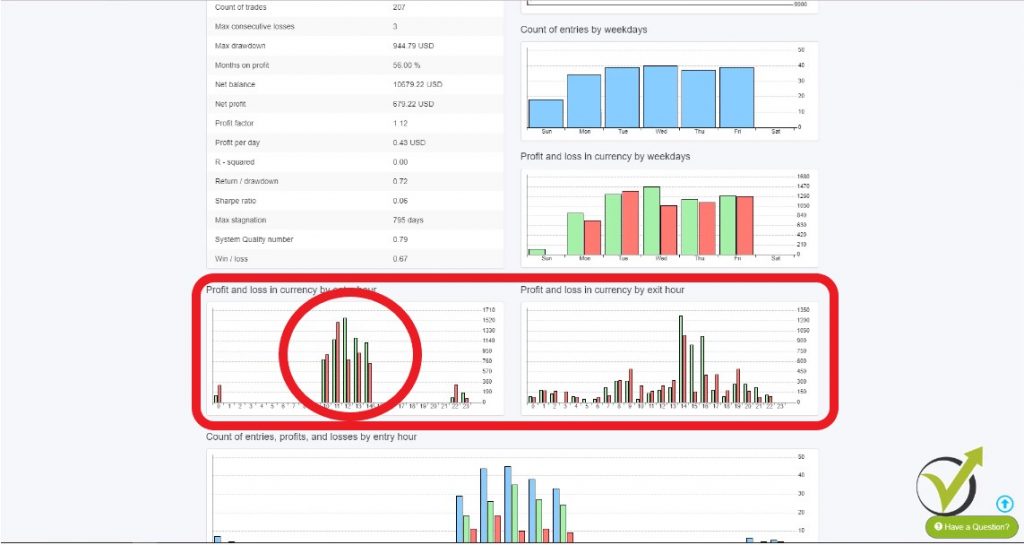
Because this is only the entry and the exit could be at any time. And there is some trading over here at 10:00 and 11:00 p.m. I think this is just because of the trading on Sunday. Because this broker has some trading on Sunday, and I didn’t eliminate it.
If I eliminate it, I will go back to the strategy, and I will go to report, and you see there is no such backtesting trading result over here. Alright, so I hope that by changing these hours I made it clear.
This graph on the left shows the profit and the loss by entry hour.
And on the right side, we have the profit and the loss by exit hour. Let me put it back to the normal that I’m keeping. It’s from midnight till midnight, okay. I’m not missing any trading time! And keep in mind that these settings in tools are general.
And if you change them, and then you load some old collection or strategy or Expert Advisor, it will affect their backtesting trading report of this strategy.
Alright, and I will go back one more time to the report, and I will show you what I have below. We have two more things. One is the count of entries, profits, and losses by entry hour.
How to read the backtesting trading results?
- blue bars show the count of trades during the backtesting trading
- green bars are showing the profitable trades
- red ones are showing the count of the losing trades
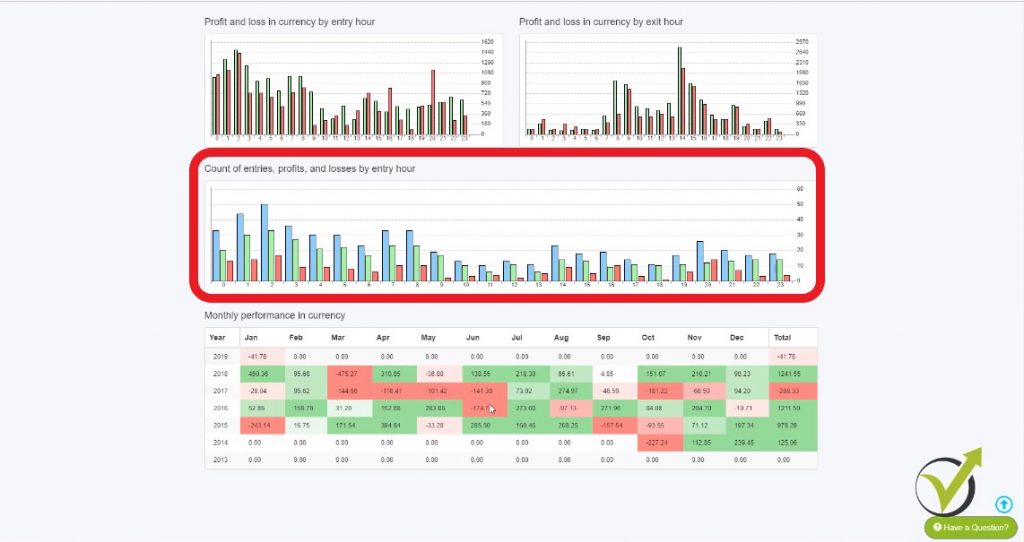
The blue bar equals the green bar plus the red bar. So here we have the count of the entries, the profits and the losses by trading hours.
Alright, and below, we have the monthly performance in currency.
Many people are backtesting Forex trading strategies, and when they see a losing month, they give up from the strategy. It is quite reasonable to have a losing month with a strategy. Do not expect to make profits every day.
Something exciting to me!
You can see the results while backtesting Forex trading strategies for the whole trading period that we have with the entire historical data. In this case, it started in October 2014 and:
- the months where we have huge losses are colored in red
- those where we have smaller losses are in a lighter color
- the profitable months where we have profits is in light green
- where we have more profits is in darker green.
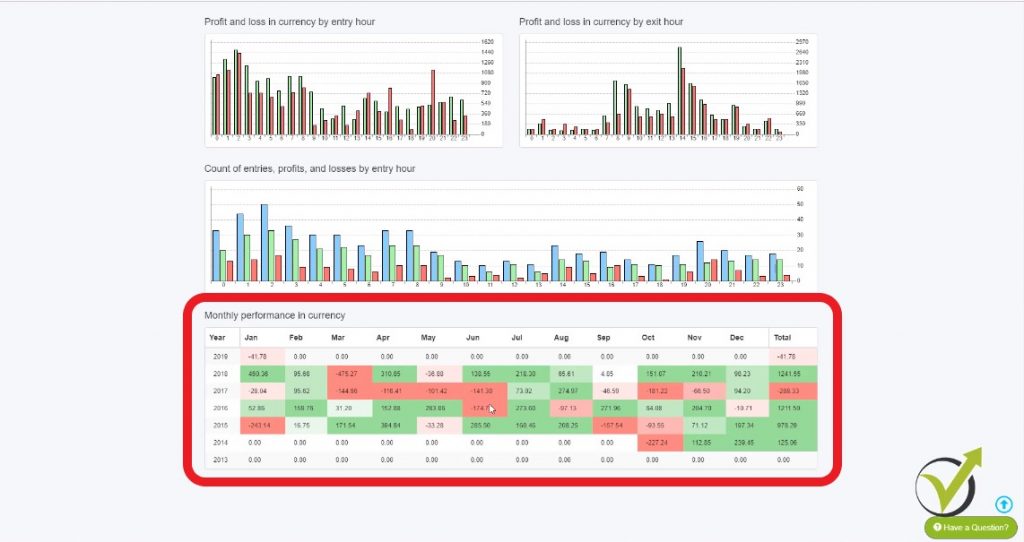
And this way with the backtesting trading we can see, for example, that this strategy makes profits in July.
It makes profits as well in February. With the other months, it is having some months on profits, some on losses. You can see in June it has two months on profit and two months in a loss.
By having these statistics over here, you can have a much better idea about the trading strategy, about the profits and the losses.
And if you decide, you can pause the strategy when it is not making a profit. For example, in the afternoon with this trading strategy or you can have a look at months as well. You can make a lot of conclusions over here, and it is up to you how you will use these statistics to improve your trading while you are backtesting trading strategies.
This was about the statistical information that we have now as an update in EA Studio, which is very useful to analyze our work while we are backtesting trading strategies or when we are generating strategies, and we have them into the collection.
We can quickly go to the report and have a better idea about the strategy, not only looking at the balanced chart but looking at all of these statistics.
On our website you can see more information about EA Studio. In our trading Forum, we have a topic called EA Studio Updates. This is where you can follow all updates with the strategy builder EA Studio.
It is updated all the time, and it is essential for you as a trader to follow along, so you will use the builder with its full capacity while you are backtesting trading, and while you are generating strategies.
If you have any questions, you can always write in our forum and open exciting topics.
Thank you for reading, and I wish you safe trading.
Cheers!
What is Backtesting Forex trading strategies?
That is a process of testing a certain strategy over past Historical data on the market. The data normally is taken from the bar's information - open, high, low, and close prices. This way the traders can see how the strategy performed for the last couple of month or years.
Why is backtesting important?
The traders want to use profitable strategies. If a strategy was profitable in the past it has a higher chance to bring good results in the future. Backtesting the strategy is the only method to see if a strategy was profitable in the past.
How do you backtest a Forex trading strategy?
There are different methods to backtest a strategy. You can use the MetaTrader platform if you have an Expert Advisor for the strategy and use the backtester. If you do not have it, you can use any strategy builder which will help you with the backtest.
How backtesting strategies will improve my trading?
It is much better to have a strategy that is backtested compared to trade with a strategy that has no backtest. The backtest is a huge advantage for many traders because they can analyze and improve their strategies.

