
Celer Price Prediction
In today’s lecture, I’ll be talking about Celer as one of the recent investments that I have in my crypto portfolio and I will explain exactly why I have bought it and what is the realistic price prediction that I have for the CELR coin.
So on my spreadsheet, I have the Celer as the last investment, 2,000 coins at a price of $0.06 and this was an investment of about $120.
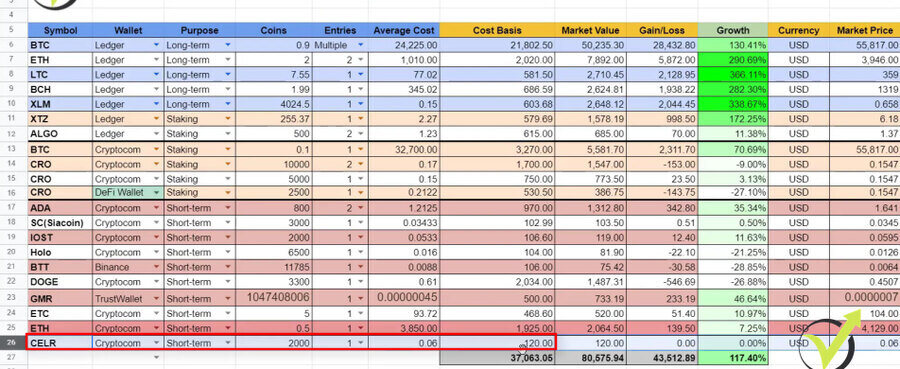
And if you are a beginner to our Academy, on Patreon I share all of my investments. I send buy and sell alerts. So, for example, I have a sell alert for Ethereum where I gained a profit of above 220%. As well, on my Patreon’s page, you can download the spreadsheet and use it for yourself or track all of the investments that I currently have. So this crypto portfolio spreadsheet is available on my Patreon’s page.
Celer Coin Community
So Celer is quite an interesting coin that grabbed my attention because it did a decent retracement after the move in March and April 2021. And a few words for the beginners, if I go a little bit higher on the CoinGecko website where I am doing the analysis you will see that Celer Network has a Twitter and Telegram community.
If I click on Twitter, I will see that Celer already has above 50,000 followers which is not bad at all for a coin with a price of $0.05 where it sits at the moment. And if I open their website you will see a well-designed celer.network website where you can read more about the technology, what is it all about?

I’m not going into details, at least not in this lecture. What I want to focus on is the Celer price prediction and the levels at which I’m comfortable buying it.
So for every asset when I’m starting to analyze, I look at the community, I look at the website, what’s the idea? Do I like the idea of the coin? There are hundreds and thousands of assets so it’s really hard obviously to analyze and decide which altcoin you want to buy or you want to buy the assets that are already listed on some of the exchanges.
What is the support level?
So Celer is already listed on a couple of exchanges, I have bought it from Crypto.com.
Check out our Brokers & Exchanges section, where you can see the exchanges that we’ve been using that are trusty and I don’t have any issues when I’m withdrawing because I know that many beginners worry about that which is normal.
But I already tested quite many exchanges and I’m always dropping the links to the trusty ones that I’m using.
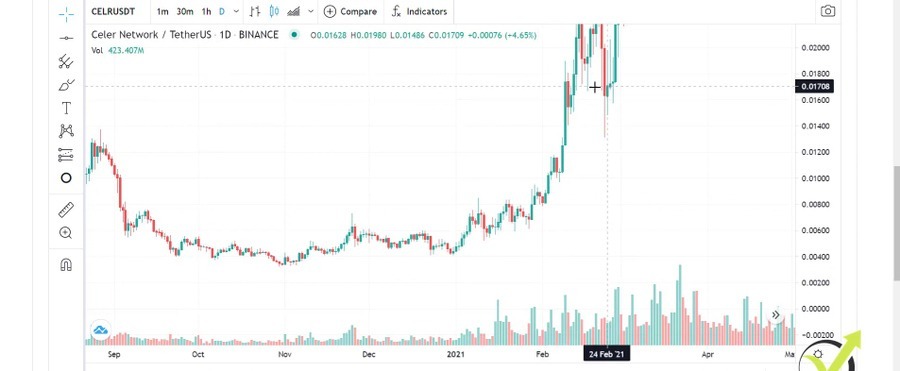
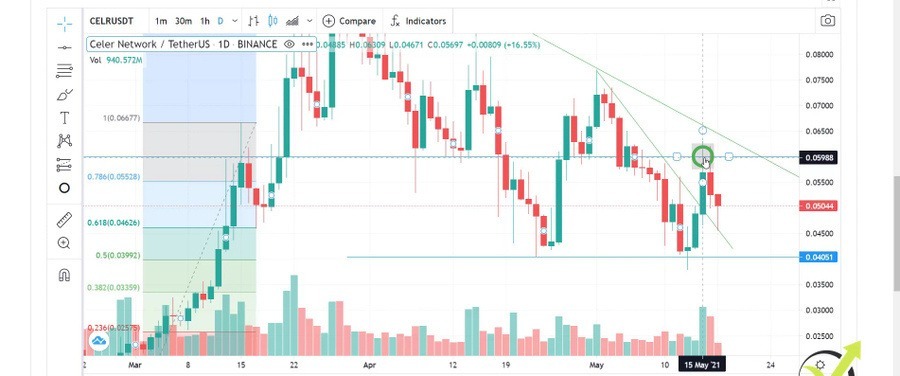
So with the Celer, what’s important to point out for me is that we already have a nice support level at the level of $0.04.
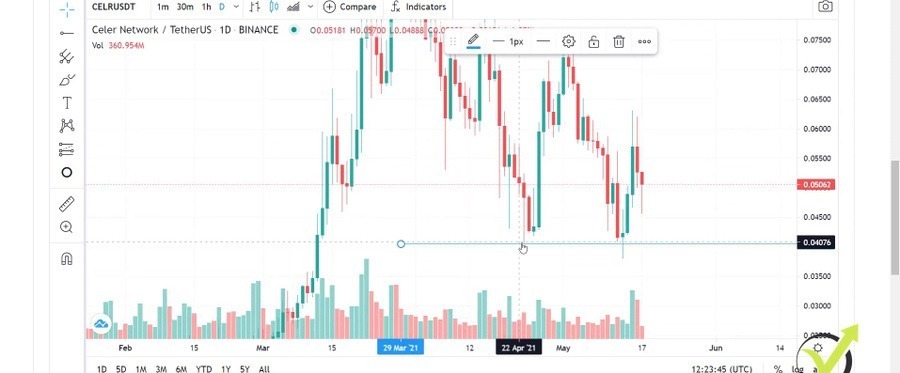
So this is where the price stopped on the 23rd of April, then it went higher, and then we had another failure. With this, we can say almost a doji daily candlestick on the 13th of May and the price failed to close below the level of $0.04 which makes it unimportant.
And usually, when I notice that there is strong support with some of the coins, I start looking for buying opportunities.
And for beginners, what is the support level? This is a level where the buyers stop the price or in other words, it means that at this level the buyers get stronger than the sellers.
The counter-trend line
Obviously, the sellers are pushing it down, they’re selling, they’re taking profit or swapping to other coins but when the price reached $0.04, the buyers are stronger. And this is where I bought my recent Celer coins and I will explain it super simple. So what I am using are the counter-trend lines. I will draw one counter-trend line over here. Here it is.
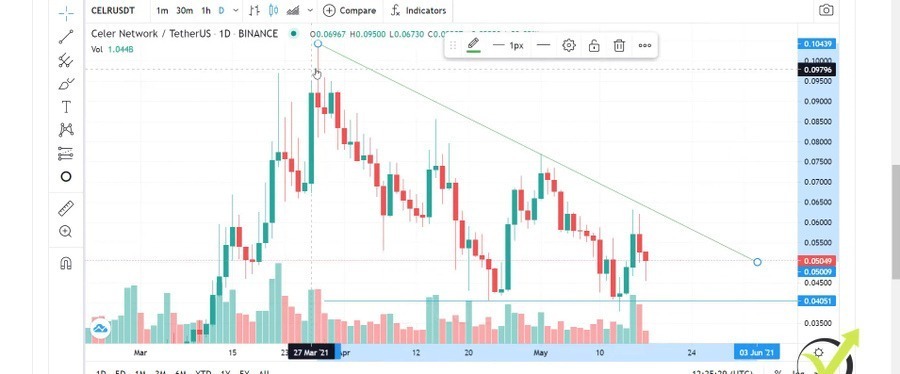
So I call it a counter-trend line because I draw it against the major trend which is an uptrend if we look at the bigger picture.
We have a very bullish movement and then we have a decent retracement which gives us great levels to buy. Now, I will go down to the hourly chart and I will show exactly what I have done.
So here is the counter-trend line. I will draw it precisely through these levels and then what I usually do is I draw more aggressive counter-trend line which was right over here.
Initially, it was here through this top, let me just zoom it. But I didn’t have a failure of the recent low so after that, I moved it over here. I’m looking for the failure of the recent low so you can see that right over here the price failed to take this low and there was a higher low.
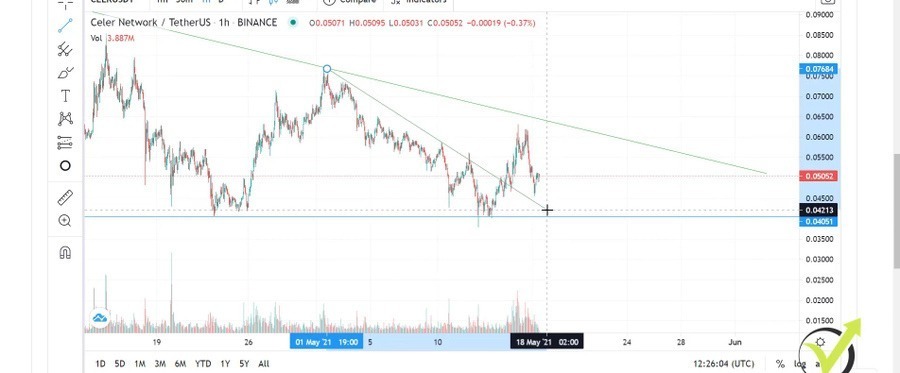
And simply said, we had a new uptrend on the hourly chart and when the price broke the counter-trend line, I was ready to buy. However, I wanted to see first the price breaking the level of $0.05, $0.06 because these tops here are important because it’s another important level for the market. So if I go back to my Patreon’s page you will see that what I said exactly on that date is.
However, I wanted to see a break of the $0.06 level first because it was important to support and the resistance level. So 0.06 is an important level. You see that the price stopped a few times here, it was a resistance here then it was of support a few times, here as well, here, like 5 times is more than enough to consider it as an important level so here it is, 0.06. I will just drop it precisely and you will see where was my entry.
After that, what we had was a few negative tweets from Elon Musk about Bitcoin which forced the whole crypto market to drop and other Celer trades at about $0.05.
As well, I’ve been using the Fibonacci levels. I will go back to the daily chart and you will see one more time why I said that the $0.06 is an important level.
The Fibonacci levels
Here it was a resistance, then it was a support for a few times. This is why I wanted to see a break from that level. But followed by Elon Musk’s negative tweets about Bitcoin forced most of the coins to drop in the next couple of days. So what more I wanted to show you are the Fibonacci levels.
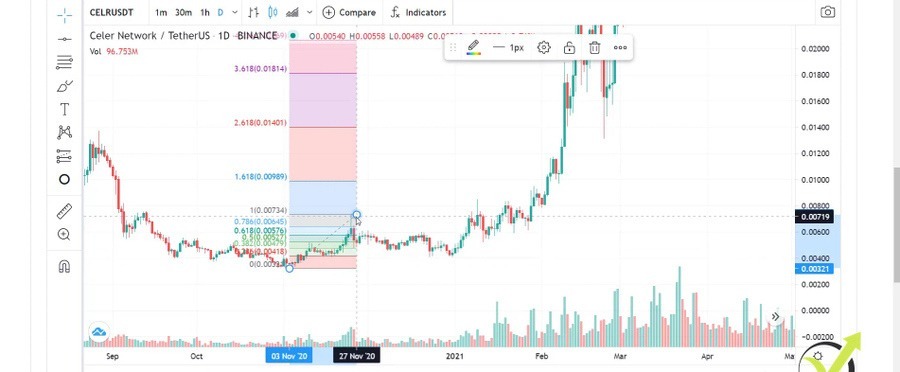
And exactly with the Fibonacci levels, I’ll be showing you what are the realistic price prediction targets that I have and that I’m looking at. So I’ll be going back to the beginning of 2021 and the end of 2020 because right over here in September, we had a very negative move with the Celer, and then the first positive move was this one over here.
The lowest point we consider to be that one over here, you can see the price was at 0.00324 and then we had a positive move, price went sideways, another positive move, and then we had the impulsive moves.
So now I’ll be taking the Fibonacci retracements and I will be drawing one Fibonacci with the first positive move.
The targets
This is the first positive move. I draw it backward starting from the top to the lowest point and you will see how Fibonacci looks like on Trading View. We have retracement levels and we have targets. And exactly I’ve been using the targets to determine realistic price predictions. So I take another Fibonacci and when the price breaks the second target, I draw another Fibonacci from the next top.
So here, the price broke the Fibonacci, I’m taking the next top and I’m drawing it to the lowest retracement.
This system works really nice so stay with me here, I will explain it in detail and you will see that it’s nothing really hard. And by the end of this lecture, you will know exactly what are the realistic targets for the Celer network and for the coin.
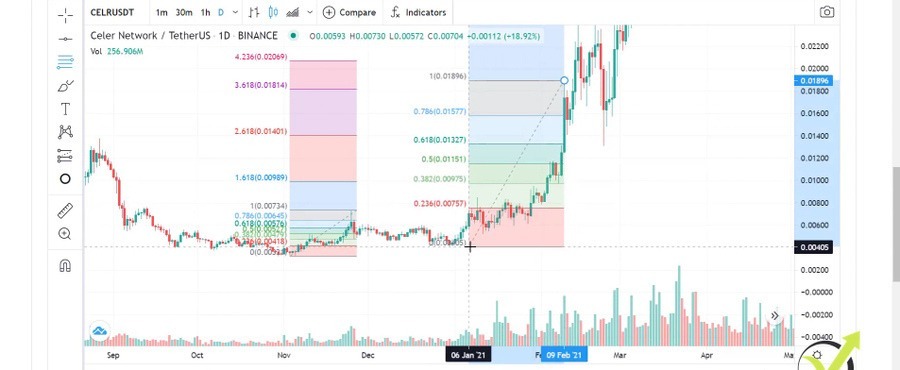
So now I have the new Fibonacci and you see that the price went a little bit higher and did a retracement exactly to the point 61.8 level of the Fib. And then it went higher reaching the second target at this moment. So after it reached, what I will do, I will take another Fibonacci from the next top which is this one over here,
The confirmations
I will draw it precisely to the lowest level, I will have a new Fibonacci, and you see that the target was not reached.
And the target is 0.15, 15 cents. This is the next target I’m looking at based on the moves we had so far from the beginning of 2021. So let me draw it really precisely because it’s important. Every small change reflects the target.
So here is the lowest point of the retracement and then we have the highest point right over here, yes, here it is. Now, what I do is to look at the second target. One more time, it sits at 0.15 or this is 15 cents. After the price reached the target, you can see that it went sideways, a little bit down, and it did a nice retracement to the 0.04.
And you can see that the 50 level of Fibonacci matches with the 0.04. It is 0.03992 but this is super close to the 0.04. And when we have nice retracements to the Fibonacci, this gives me a great opportunity to enter the market and to buy the coin. So here I have a few confirmations. First is the retracement to the 50 level from Fibonacci.
My personal opinion on Elon Musk’s remarks
Second is the support level of 0.04 where the price stopped twice. Third is this reversal pattern that we had from the Candle sticks, almost a doji. And then we had the break of the counter-trend line. So one more time, I waited in this case to see a break of the 0.06 as well and I have bought right over here.
The recent days, Elon Musk keeps tweeting negatively about Bitcoin which reflects the whole Cryptocurrency world but I think this is temporary. I personally don’t feel like selling everything because Elon Musk decided Bitcoin consumes a lot of energy. It’s nearly the same energy it consumed a month or two ago. It’s a super speculative move from Elon Musk to tweet against Bitcoin.
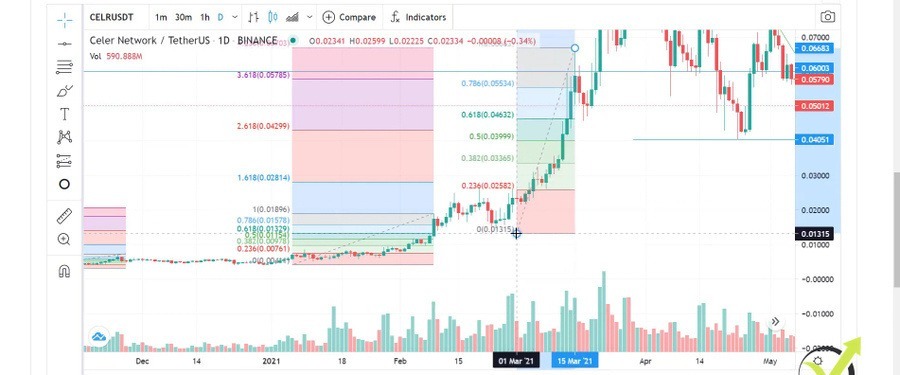
I personally believe he just wants to buy it at a cheaper level so I expect another positive move from the coins. So this is my current setup. This is what I’m looking at and if I draw a box where I feel comfortable buying it, this will be the retracement levels from the Fibonacci.
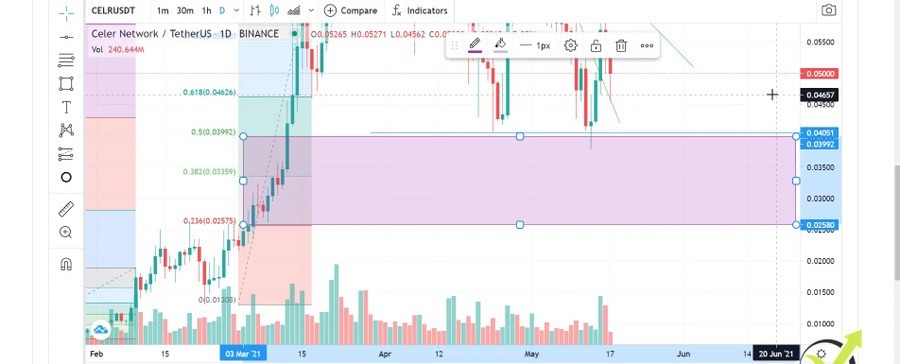
I will take a rectangle and I usually use the 50 level, and I usually lock it between the 23.6 level up to the 50 level.
I want to see the price breaking the counter-trend line
So anywhere in this box, I’ll be happy to buy some more of Celers and improve my average price. This is in case the price drops. And you see that the price already has been into that box but one more time, I don’t feel comfortable buying for one reason, I want to see confirmations from a few things as I already explained.
If you are a more aggressive player and you want to buy the dips then you might want to buy every time the price drops into the retracement level or in this box that I formed between 23.6 and the 50 level. And ideally, what I’ll be looking at is discounted trendline, I will just increase it.
If the price does something like that, probably a little bit of a drop and then retesting again this counter-trend line, then dropping more to the zone and anything here that breaks the counter-trend line. This is just a potential setup that would make me happy to buy some more Celers.
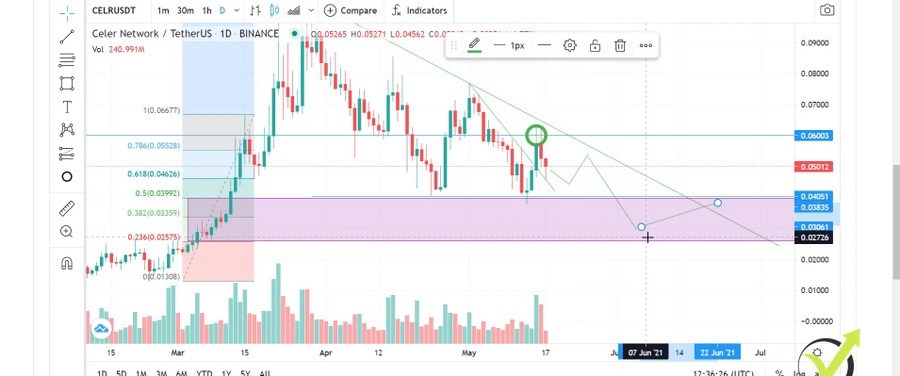
So I want to see the price breaking the counter-trend line or eventually something like that which will form a higher low, here it is, and a break.
My current setup
So if I see the price forming a higher low on the daily chart, this will make me happier buying it and as well a break of the counter-trend line in the box would make me feel comfortable adding more Celer coins into my portfolio. This is my first entry so if my second entry is somewhere in the levels of 0.04, I will have an average price of 0.05.
And then if the price reaches my target of 0.15, this will bring me over 200% of a profit with the Celer coin. So this is my current setup, guys. This is what I’m looking at. Of course, if the price now just goes upwards, even better. If it drops, no worries. I’m happy when the price drops lower so I can improve my average price and when the targets are reached, I have more profits compared to if I have put all of the money in the first place.
So usually, I determine an amount that I’m ready to invest. With the Celer in this case, it was $300 but the first time I buy is only with $100 or something around it. Then if the price drops lower, I add to the position, I improve my average price, if the price drops more I will be looking for more buying opportunities and buy some more.
Check out my Patreon’s page
So after that when the price reaches my target, I will have more profits compared to if I have bought for the whole $300 at the beginning. This is my strategy, this is what’s been working for me great since 2020 after the Coronavirus crash. We’ve been having great opportunities on the Cryptocurrency market.
I’ve been sharing many of them on my YouTube channel in my Cryptocurrency Investment Strategy course which you can find in the description below. I’ll be posting as well a 50% discounted coupon. And as well, recently I started my Patreon’s page where I send buy and sell alerts for all the assets that I’ve been purchasing.
And as well, I have shared my Cryptocurrency spreadsheet which is super useful if you are building a portfolio so you can track where you have bought the asset, how many times you have bought it, how many coins you’re holding, in which wallet you’re holding it, what’s the purpose? Is it short-term? Is it long-term?
Please give the video a like if you enjoyed it
And, of course, at the end of the day what matters the most is are you profiting out of it or you’re not profiting out of it. So take it easy, don’t jump with all of your money into one asset. I always suggest the students and my followers to invest in many Crypto coins, not everything into one coin.
Of course, over 70% of my portfolio is in Bitcoin but the rest I split between many coins and I do a detailed analysis daily and I share every time I buy or sell an asset into my Patreon’s page. So check out the links below, make sure to subscribe to the channel so you won’t miss any new price predictions. One more time, for the Celer, a realistic target would be 0.15 or this is 15 cents.
And if you have enjoyed the video, thumbs up, and I will see you guys in another one. Take care, enjoy investing in the Crypto world.
Cheers.