
In today’s lecture, I’ll be doing a realistic price prediction for Bitcoin Cash as one of my early investments this year. And I will show you what are the next targets I’m looking at.
Bitcoin Cash price prediction
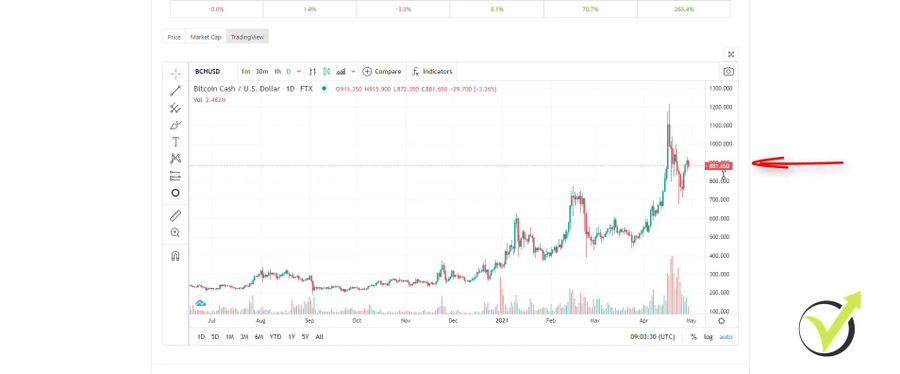
So at the moment of creating the lecture, Bitcoin Cash sits at about $880.
I have bought it at a relatively good price at $345 and I have bought almost 2 coins. Honestly, I don’t remember why I have bought 1.99. Probably I was missing some capital in my account on the exchange so I couldn’t afford to buy the two. But anyway that was a total investment of $686 and the current market value is $1,687 which is about 145% growth already.
So I’m pretty satisfied with that one.
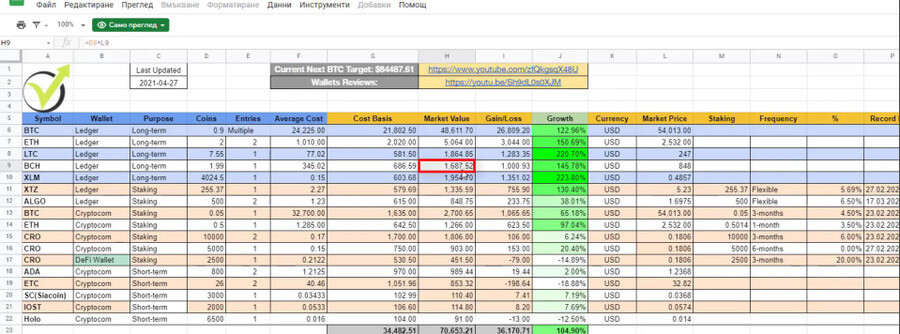
And actually, this is my cryptocurrency portfolio spreadsheet, which I share on my Patreon’s page that I have started recently, you can check out this page to learn more.
Going back to the chart on Bitcoin Cash, you can see that the price reached $1,200 in April, and on yearly basis, we have over 265% already.
The Dow theory of uptrend
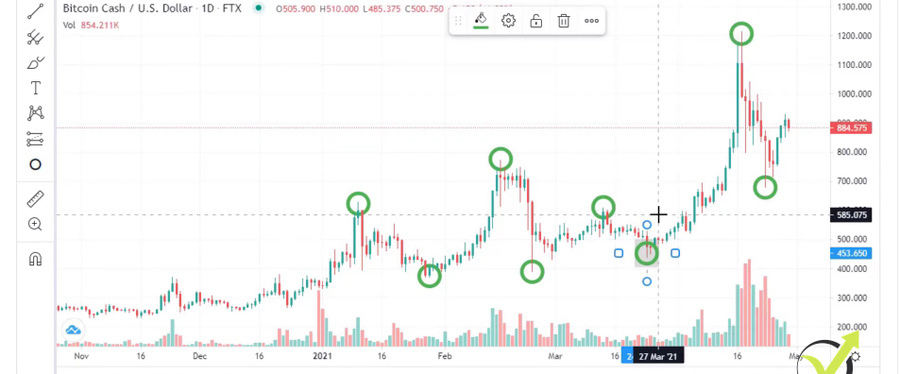
So I am considering my investment as long-term as it is set into my spreadsheet. But in this lecture, I want to give you an idea what are the realistic targets that we have and our price prediction based on what Bitcoin Cash did since November. So on the chart we clearly see that we are still in an uptrend, we have series of higher highs and higher lows.
That high is higher than that one. Then we have another higher high, then we had a lower high. But at this moment, we didn’t have a change in the trend because we didn’t have a lower low than that one. So until that moment, we are in a clear uptrend, we have series of higher highs and higher lows. Then we had a lower high but the price didn’t form a lower low than that one.
And after this amazing move, it did in April, we have a new higher high with another higher low which is higher than that one. So that’s still an uptrend, series of high highs and high lows, this is the Dow theory of uptrend.
The counter-trendline
Now, if the price drops again below the $686 or if I should be precise and I put the mouse on it, you will see that the lowest point is $680.
If the price forms a new lower low, we will have a series of lower highs which I will just make red because it will be a lower high. And here we will have another one, so that would be a downtrend already. So this level is quite important, all ready for the market and especially for the Bitcoin Cash and I will put it right over here, $680. Let me do it precisely $680 and I click on OK, here it is $680.
So definitely that’s a level that we would be looking for and I think any buying opportunities above that level are worthy still.
But let me go down to the hourly chart and show you what usually I use. I will remove now these circles which I used to point out the uptrend.
A great opportunity for entry was with the counter-trendline. As you know, I often use it. Basically, 90% of my trades and investments are based on the counter-trendline.
So right over here we had a nice break, it was not an impulsive break honestly. That’s why I didn’t take the trade but we had as well the failure of the recent low and that was a great entry at a little bit above the $800. And now the Bitcoin Cach price is just going sideways.
What is the Bitcoin Cash?
So for the beginners who have no idea about Bitcoin Cash, with simple words, it is a fork of Bitcoin and it aims at more transaction capacity to the network. So it will be a more useful token, at least this is what they aim for.
Now, what are the real targets and our Bitcoin Cash price prediciton? This is what the lecture is about but I wanted to show you what is my current setup with Bitcoin Cash.
Uptrend, if the price breaks below $680 it will be a downtrend. And one more time, I’m looking for counter-trendlines usually to buy but I didn’t take that one because the break was not impulsive like that one, for example. That’s an impulsive break guys, that’s impulsive moves. This is where the smart money comes in and this is where I want to join.
Not a slow and steady upward movement like that one. However, I have already my investment so I didn’t want to add any more to my portfolio. But what is the target that I am looking at for Bitcoin Cash price? I will remove those as well, very important to always buy when we’re in an uptrend and when we’re in a downtrend be patient, and just wait for the new uptrend to appear.
The Fibonacci
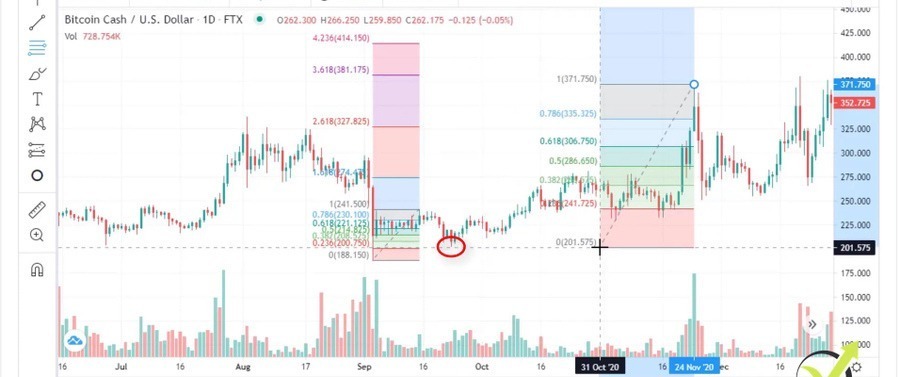
Going back to the daily chart, how I determine the targets and what is the realistic price prediction? I use the Fibonacci levels which I explained, one more time, in my Cryptocurrency Investment course. And now I will grab the Fibonacci retracement and I start from the first move of this new uptrend.
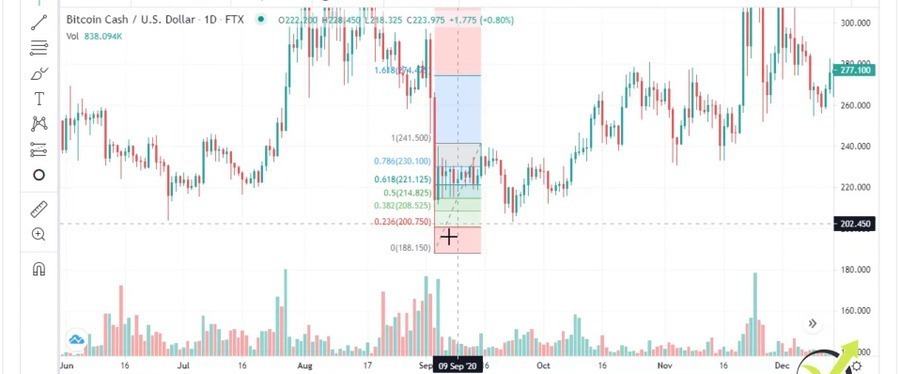
So right over here the Bitcoin Cash price was just sideways, at this moment we have a downtrend, and when we have a new uptrend on a daily chart, I grab the first move which was this one over here. This is the lowest point, so I will need to make it precise. Stay with me here, this is very important, it gives great targets that I’ve been using until the moment for trading.
It works really nice, so here it is. This is the first positive move, I’m taking the lowest point of the previous downtrend to the first higher point. And I draw it from the top to the bottom. Now, the Fibonacci is quite interesting, it gives retracement levels but as well gives us targets. The first target at 161.8, the second at 261.8, we have third and fourth but I usually use the second target.
My realistic Bitcoin Cash price prediction
And when the Bitcoin Cash price reaches the second target right over here, I draw another Fibonacci starting from the top and going to the lowest point. I will show it to you right away. So the price reached at that moment the target from Fibonacci, I take the new high and I draw it to the lowest point right over here which gives us the new targets. This is the lowest point that we have after that move.
Then we have 2 new targets and the new one right over here at about 647. You see that the price nearly touched that target but it did it after that right over here with this impulsive move. And now I will draw the new Fibonacci starting from the top going to the lowest retracement right over here, here it is.
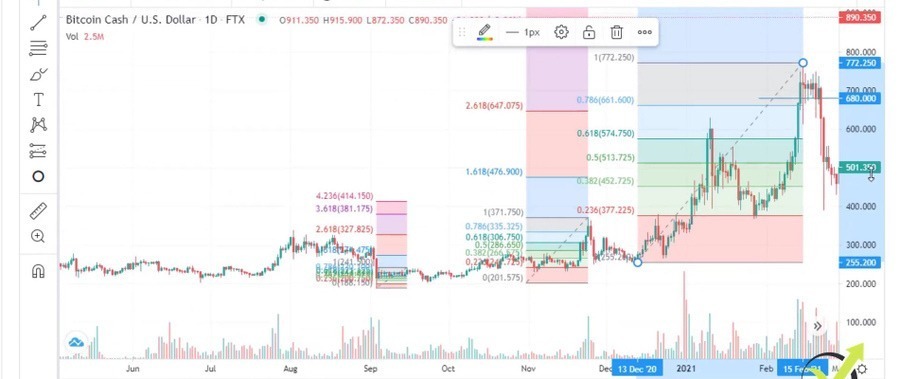
And let’s see, where are the targets?
The first target 1,091, the second target 1,608, and the third target was not reached. So my first Bitcoin Cash price prediction based on the Fibonaccis and the moves we had so far from the end of 2020 and the beginning of 2021 is $1,600. That’s the realistic Bitcoin Cash price prediction.
As I’ve said, I’ve been using the Fibonacci for quite a long time, many years. To be honest, it’s one of the things I’ve been using as well for Bitcoin itself.
Taking profits and re-entering on the next retracement
And it brought me quite many profits, you see that all of these are Fibonacci targets where I was taking profits and re-entering on the next retracements.
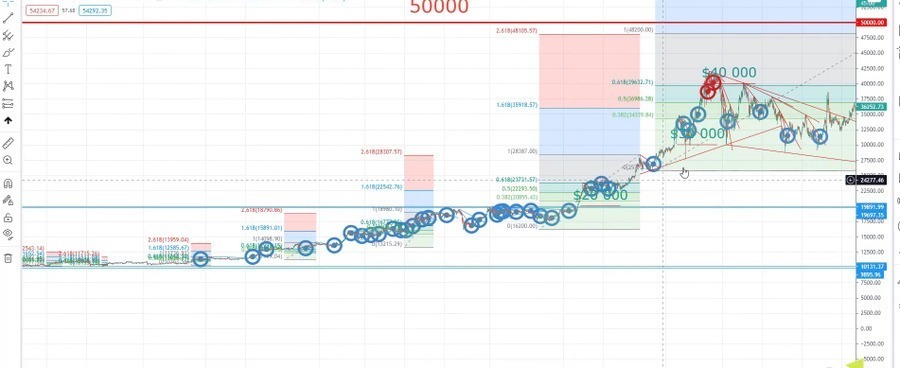
And my current target with Bitcoin honestly, is right over here, sits at $84,487. I have shared that in one of my lectures, it is as well in my Cryptocurrency spreadsheet.
One more time, you can find my crypto portfolio spreadsheet on my Patreon’s page where I give buy and sell signals every time I purchase a coin or I sell, I share basically all of my investments.
Now, what to expect from there? It is really hard to make a Bitcoin Cash prediction because it depends on what the price will do from now. If it drops, as I said we will be in a new downtrend and we will have to wait for a new uptrend and restart the Fibonaccis.
If it goes sideways for some time and then it reaches that level of $1,608, then I will be drawing a new Fibonacci to the lowest retracement. So let’s say the price reaches until here then it drops again, it doesn’t necessarily mean it will stop at that target. It’s a target where I would be looking to take some profits.
We have various determinants of the Bitcoin Cash price
But it could be a little bit above, it could be much higher. It can reach potentially to, let’s say, $1,850, it doesn’t matter.
My point of view is that after we have the new top, I will be drawing a new Fibonacci and going to the lowest retracement over here.
And then I will see what will be my next target and prediction for the Bitcoin Cash price. In this case it is a huge one, $4,211.
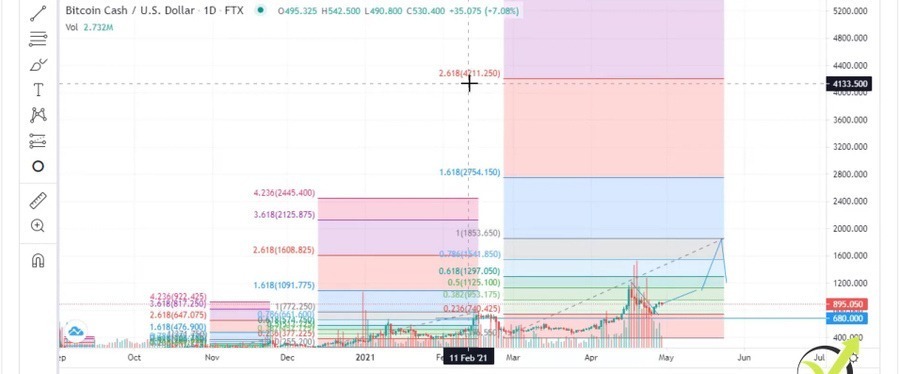
But it depends, one more time, on where this new top will be above the current target of $1,600.
Conclusion
So this is how I use price action and technical analysis to determine new targets for levels where the price hasn’t been this year or the last year. I’m not looking at the levels from 2017, guys. Bitcoin proved to us that what happened in 2017 or in 2018 stays in 2018.
And it doesn’t really matter where the price reached. There was a mass of people trading at this time, not the investors. Now, we see a huge buying power for many companies, hedge funds, popular influencers, investors like Elon Musk that affect the price daily. And I am looking at just what happened in the last months so I can decide on what are my next targets.
Using Fibonacci worked really well so far for me, hope it will work for you as well. One more time, if you want to learn the complete system on how I am using the Fibonacci, the counter trendlines, where I’m buying, you can have a look at the Cryptocurrency Investment course.
I was recording videos, every time when I was buying the different assets, of course, many of them I have sold always on a profit. I never sell an asset at a loss, so always on a profit. If it goes on loss, I’m just hedging or buying a second or a third time to have a better average price and get my account on profit.
So this is my realistic price prediction for Bitcoin Cash. We’ll see when it will reach $1,600. And I’ll be super happy to see what is your Bitcoin Cash price prediction in the comments below. If you have any questions, don’t hesitate to ask in our Community Forum and I will see you guys in the next lecture.